1st Logistics International Conference Belgrade, Serbia 28 - 30 November 2013.
BeerGame reference scenarios for Balanced Scorecard evaluation, highlighting customer perspective
Norina Szander*
Széchenyi István University, Special College of Transportation engineering and Logistics, noinya@gmail.com
Katarina Lestyanszka Skurkova
Slovak University of Technology in Bratislava, Faculty of Materials Science and Technology in Trnava, katarina.skurkova@gmail.com
Richard Zilahi
Eötvös Loránd University of Sciences, Faculty of Informatics, zilahi@ gmail.com
prof. Péter Földesi
Széchenyi István University, Department of Logistics and Forwarding, foldesi@sze.hu
Abstract: The BeerGame software is continuously developed in the Szabó-Szoba R&D Laboratory based on the original game invented by J. Forrester. This simulation helps the students, researchers, managers to understand the so-called system dynamics of supply chains. The software is applied on tablets or smartphones what makes us possible to hold trainings anywhere, easily. It’s also suitable to integrate the Balanced Scorecard measurement system. In that way we can see the graphs and results immediately after the games and to create KPIs, statistical examinations. The most important part of the trainings is the discussion of outcomes and the team learning because the application of modern production and distribution strategies requires flexible innovative thinking and special management skills from experts:
to construct and manage effective, well-balanced manufacturing and logistics process. In our paper we are focusing on the customer perspective to identify individual and general rules on the field of partnership in supply chain management.
Keywords: bullwhip effect, beer game, Balanced Scorecard, performance measurement, partnership.
* Corresponding author
1. INTRODUCTION
The Beer Game logistics management game is widely used to demonstrate the inventory imbalance problems in supply chains – in the frame of the game participants impersonate a four stage supply chain, and make their own decision about actual orders in every round according previous demands and expectations. The factory is responsible for production, and the other three collaborators for distribution towards the customer. The aim of the players is rather simple: each of the four traders has to fulfil incoming orders by forwarding the required units of beers to the partners in the chain with minimal total cost (the charge of inventory holding is 1, in the case of backlog the related cost is 2 units of currency). Communication and collaboration are
not allowed between supply chain stages. This game can be used in the formal education and on trainings as well to model real life situations and to highlight the difference between practice and theory by the learning-by-doing method.
2. THE BULLWHIP-EFFECT
The competing supply chains are characterized by the ever growing extension. The need of mass- production is increasing in the industry while on the costumers’ side the demand of unique goods is extending. These cross-purposes cause the elongation of supply chains and turn them into supply networks with more and more processing, forming, storage stations and resulting in huge transportation and forwarding needs. This system
structure has a serious and inseparable drawback, the presence of the bullwhip-effect.
Because of the growing globalization of supply chains/networks we can observe in an increasing number the bullwhip-effect which is a really expensive phenomenon: at different stages of the distribution channels high inventory levels arise, although at the same time other stages suffer from serious shortages. Therefore, the end users in many cases can’t get the desired product, on the other hand, insufficient or excessive production and warehouse capacity establishment and its inappropriate coordination causes the inaccurate production, delivery and distribution plans. The consequences are growing total cost of supply chains, lower profit rate, and loss of competitiveness. The inappropriate usage of resources implies the increasing logistics costs and declining customer service and its adverse effects which worsen the performance of companies and supply chains.
The inventory levels at different points of supply chains varying separately from the real costumer demand because of the bullwhip-effect. The usage of resources as production-, distribution-, and warehousing capacities is apparently not effective.
The emerging shortage and unnecessary accumulation of inventories at different stages with the passage of time and the fulfillment of the backlogs of orders run through the whole supply chains. Therefore the systems/networks loose their balances and these swings maintain the presence of the bullwhip-effect for an indefinite time. Despite the fact that this phenomenon has been known for long time, its examination, accurate detection and modeling, is still subject of intense scientific interest. [6]
Based on many scientific researches the trigger of the bullwhip effect can be traced by the lead time of information and material. A supply chain’s reaction on a change in end customer demand is delayed firstly because it takes time to pass on information about the change to suppliers and secondly because these suppliers need time to adjust their capacities and deliveries. The longer a supply chain is unable to react on a changed demand, the heavier it needs to react as soon as this is possible. The bullwhip effect increases with longer lead times.
In addition to the lead time of information and material, the bullwhip effect is caused by other reasons:
Insufficient techniques for demand forecast
Batch ordering
Price fluctuation
Exaggerated order quantity in case of shortage
Commonly, demand amplification is mostly caused by some internal mechanism or event; it is not due to something external to the system.
Although the customer demand may be extremely volatile, it is self-induced worsening of any situation. As bullwhip is a time-varying phenomenon, graphical representation of system behaviour is extremely helpful. The next figure shows specific demand amplification in a six month period. [5]
Figure 1. Demand amplification [2]
3. THE BALANCED SCORECARD SYSTEM AS PERFORMANCE MEASUREMENT APPROACH
We had to realize that the traditional efficiency measures by themselves – because they are considering mostly the financial parameters of production processes – are inadequate in providing a complete and useful overview of organizational performance (in our case it means the performance of the whole distribution channel as a system). For better understanding the relations not only on the operational, but also on tactical and strategic levels.
The use of Balanced Scorecard measurement system is widely accepted: it is operating on the financial, marketing (customer-related), operational (internal- business processes) and strategic dimensions (learning and growth)(Figure 2).
Figure 2. The perspectives of the Balanced Scorecard [4]
The financial perspective of course is the basic of the BSC measurement system, but this is the easiest to create exact numbers from which we can jump to a conclusion, and so it has lots of common attribute with the typical measurements systems.
Also the truth is that the managers will always want to see clearly the data, trends, graphs, and use every possible instrument to learn where the company is heading to, be aware of the risk assessment and cost- benefit data. This is why it’s colligated with the other three perspectives, to see the whole picture.
We can generate the most obviously measurable indicators in this area. We can exactly calculate the inventory holding cost and the penalty in case of shortage. We can also easily say the growth in the certain customer's orders, which refers our next perspective.
Examples:
Lot of capital tied up in inventories
Frequency and amounts of out-and in stores
Storage costs depend on the size of the warehouse and the storage technology In our trial gameplay the inventory levels moved quite simultaneous. Increase at one players stock caused the raise at the others. In this case quite natural that the retailer had the lowest and the factory owned the highest stock, so the parallel lowest and highest inventory holding costs.
The next factor is the customer, who should be satisfied. The management has to realise that the future of the company depends on the strong loyalty of the partners. Applying indicators on customer satisfaction may show hidden problems before our partner changes supplier. A possible way to separate our customers in different groups, and rate their different needs, then the customer service can get closer and closer to the needs based on this. We can think about more concrete tools here.
For example:
How much late we can afford with the delivery of an order?
How many times do we have to compensate, until the customer does not choose another supplier?
How do we behave in the case of a missing product?
Do we monitor the order amounts?
What do we conclude from the orders gradient?
Do we look for the underlying reasons in case of fluctuation in the orders?
The different inventory management strategies affect differently the relation with the customer. In
our first try everybody had their own tactic for satisfying the demand. The high safety stock at the Factory was the best solution in this aspect but it conflicts with other goals.
To reach successes the internal business processes must be continuously improved and examined. It makes easier to the employees to perform their tasks, minimise the possible mistakes and the managers can see the quality of the production or services. The problem with this perspective is that it requires very profound knowledge about every tiny detail of the internal business processes, so it can not be developed by an outsider consultant or expert. The internal processes of distribution channels contain lots of components.
Forecasting, human and material resource planning, production and shipment scheduling can largely influence the efficiency of the company, and globally the performance of the chain. Usually there is not only one possible optimal way to fulfil the demand. Furthermore sometimes not possible to find the real optimum; just use any good solutions close to it.
Based on the experiences we can say it’s a good way to treat the whole supply chain as one system. If we consider globally the factors maybe we can get closer to the best solution. A lot of question entails related to the internal processes:
How much information do we share with the partners?
Do we discuss our trading plans with our supplier?
Are we able to manage a common inventory or trading plan with the others?
How efficient is our capacity utilisation?
Do we have idle resources in the shipments?
What kind of forecasting method leads to the optimal resource allocation?
What is the ideal safety stock level?
In the game we all paid huge attention on not sharing any information to see what will happen.
The expectation was fulfilled, we finally created the bullwhip effect without any efforts (some managers may deliberately mislead the partners).
The last perspective is the innovation and learning. It both means the training of the associates and the self development of the company. With this nowadays technical improvement speed no one can afford to miss out these aspects. The employees have to be updated and also evaluated during their work.
It’s a good way if the company has a collective data base of specialised knowledge. The level of technical developments can be measured by adequate metrics (physical and quality indicators).
This part should show us, how fast we can comply with new techniques, trends, and the fluctuation of the customer demands. Some adequate indicators can measure for example the technical or infrastructural development of the company. Yet there are some aspects of progression in the business life which can be really affective but uneasy to evaluate.
Peak management – treat the accumulated stock
Don’t panic – strategy in case of shortage
IT systems – sequential improvement is necessary in every field of company governance including the product tracking, customer-supplier relationship management, inserting new methods in operational processes, development of corporate culture With the BeerGame software we can create graphs to demonstrate the bullwhip-effect and its consequences regarding to the four BSC perspectives.
4. CUSTOMER / PARTNERSHIP
In this case customers are mostly the trading partners, who order from our inventory. We can see their satisfaction, when we consider for example the
“lifespan” of the relationship. If we have old partners with a long-term relation and common history, we should be doing something well. To have a concrete frame for our evaluations we use the following equations in the table below:
Table 1. Equations used for Customer perspective [6]
Maximum Backlog
of orders BLOmax = Ximax
Average shortage
Maximum delay xi, xi+1, …. xj = BLO > 0 =
Average delay
Absolute deviation of order
fluctuation Squared deviation of order
fluctuation
To see the behaviour of different concepts we prepared different scenarios based on simple ordering strategies.
NAM - no amplification
PFO - perfect forecast
In the first scenario we played by a simple rule:
every participant orders the exact amount of their incoming order. The aim of this scenario is not to collect safety stock and amplify the produced and delivered units of beer unnecessarily. (This scenario was already presented in our previous article at the ICLST, 2013, Celje) The results are summarised in the next table:
Table 2. Results of NAM BeerGame [6]
Retailer Wholesaler Distributor Factory Maximum
Backlog of orders
8 8 16 16
Average
shortage 1,33 2,0 3,17 4,0
Maximum
delay 5 7 9 10
Max. delay of the
chain 13
Average
delay 6,4 6,86 8,44 9,6
Average delay of the
chain 4,85
Maximum Backlog of orders:
This is the simplest indicator of the customer perspective; it shows the biggest shortage of each player in the 24 rounds. In this case the Factory accumulated 16 units of beers as backlog which is quite big, according to the maximum order of the customer (12 units) and considering the aim of this scenario is not to amplify.
It refers to one “symptom” caused by the bullwhip-effect: the inventory levels at different points of supply chains varying separately from the real costumer demand. [6]
Average shortage:
From the customer’s point of view it can be really important to see how many missing units he needs to be prepared for in the case of delay. A good supplier has to see with his customer’s eye.
Maximum delay:
This indicator shows the number of the periods in which the players couldn’t satisfy their customers in the longest period.
Average delay:
It can be a crucial factor how reliable one company seem to the customer; they need to provide the lowest average delay as they can, to minimize the amount of missing units in one case of shortage.
Average delay of the chain:
It shows the reliability of the supply chain. In those rounds where somebody couldn’t fulfil an order, we can expect 5 units of beers in backlog.
The second, the PFO scenario means we knew all the information about the future customer orders and the replenishment rule of the participant was to have in stock precisely the amount in every case they need to deliver in the next round. We wanted to examine this scenario, because most of the scientific literature suggests that the information sharing is the way to eliminate the bullwhip effect.
Thanks to the perfect information sharing we were able to exclude the shortages; everybody had the needed amount in stock, in time. The drawback of this scenario that without shortages all the equations we use to demonstrate the customer satisfaction and partner relations equal to zero.
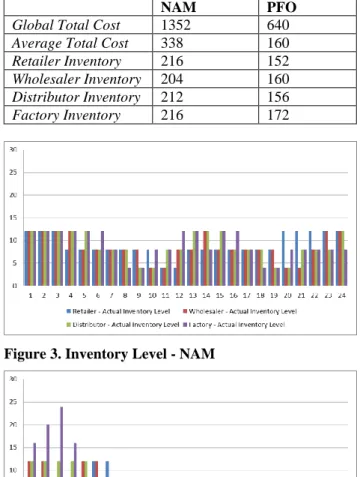
Comparing the other perspectives we can conclude PFO scenario to be more successful than the previous (NAM) reference. (The Table 3 shows the comparison of strategies by other KPIs and the inventory level is demonstrated on Figure 3,4.) Table 3. Other KPIs
NAM PFO
Global Total Cost 1352 640
Average Total Cost 338 160
Retailer Inventory 216 152
Wholesaler Inventory 204 160 Distributor Inventory 212 156
Factory Inventory 216 172
Figure 3. Inventory Level - NAM
Figure 4. Inventory Level - PFO
5. CONCLUSION AND FURTHER RESEARCH
The BeerGame environment is excellent for training university students and expert from the economy to get cooperative and innovative skills in supply chain coordination. In the same time, during the trainings the importance of Balanced Score Card methodology is coming from theory into practice and participants can get real-life experience about the construction and operation of logistics performance measurement systems.
An other important feature of the training came into highlight: we can examine different scenarios, replenishment rules, management tactics in a clearly defined environment. In the last period of the research we were working on some basic scenarios with simple regulations. The basic scenarios we created form the ideal cases of supply chain management actions and provide excellent indicators as reference scenarios.
We should put more emphasis on creating experience based input functions for the simulation.
ACKNOWLEDGEMENT
This research was supported by the European Union and the State of Hungary, co-financed by the European Social Fund in the framework of TÁMOP 4.2.4. A/2-11-1-2012-0001 ‘National Excellence Program’.
REFERENCES
[1] Chopra, S. M., 2001. Supply Chain Management - Strategy, Planning and Operations, Prentice Hall
[2] Towill, D. R., Zhou, L., Disney, S. M. 2007.
Reducing the bullwhip effect: Looking through the appropriate lens, Int. J. Production Economics 108 doi:10.1016/j.ijpe.2006.12.024
[3] http://cowanglobal.com/tag/balanced-scorecard [4] http://www.picstopin.com/1500/balanced-
scorecard-
example/http:%7C%7Cimg*docstoccdn*com%7 Cthumb%7Corig%7C4780628*png/
[5] Nienhaus, J., Ziegenbein, A., Duijts, C. How human behaviour amplifies the bullwhip effect – a study based on the beer distribution game online, Centre for Enterprise Sciences (BWI), Swiss Federal Institute of Technology (ETH) Zurich
[6] Lestyanszka Skurkova, K., Szander N., Zilahi R., Földesi P. 2013. BeerGame reference scenarios for Balanced Scorecard evaluation, The
International Conference on Logistics &
Sustainable Transport 13rd–15th June, Celje, Slovenia
[7] Bhattacharya, R., Bandyopadhyay, S. 2010. A review of the causes of bullwhip effect in a supply chain, Springer-Verlag London Limited
[8] Szegedi Z., Prezenszki J. 2003. Logisztika- menedzsment, Kossuth Kiadó
![Figure 2. The perspectives of the Balanced Scorecard [4]](https://thumb-eu.123doks.com/thumbv2/9dokorg/1105428.76831/2.892.477.787.888.1115/figure-perspectives-balanced-scorecard.webp)
![Table 2. Results of NAM BeerGame [6]](https://thumb-eu.123doks.com/thumbv2/9dokorg/1105428.76831/4.892.81.440.783.1064/table-results-of-nam-beergame.webp)