SEARCHING FOR APPROPRIATE
REPLENISHMENT STRATEGIES IN THE BEER GAME ENVIRONMENT
Norina Szander
Department of Logistics and Forwarding/Faculty of Engineering Sciences Széchenyi István University, Hungary
Attila Bódis
Faculty of Science and Informatics University of Szeged, Hungary Péter Bajor
Department of Logistics and Forwarding/Faculty of Engineering Sciences Széchenyi István University, Hungary
Abstract
The bullwhip effect and its impact on supply chains are in the focus of several researches so as the different methods of avoiding it. Due to the system dynamics it’s almost impossible to prevent the supply chain from the undesired results of operational decisions. The beer game supply chain simulation is widely accepted in the investigations of bullwhip effect. We applied the game on android platform so that we immediately have measurable data of the trainings and these data can be processed by different methods of supply chain performance measure systems. Our goal is to study different replenishment strategies and some “soft factors” that most simulations does not take into account as panic and cancelled orders.
Keywords: performance measurement, replenishment strategies, bullwhip effect, beer game 1. Supply chain complexity
Supply chain is a complicated and complex network of companies. Inside products, services and information flows upstream and downstream.
The supply chain management’s task is to
coordinate this difficult cooperation. The main goal is to reach the customers satisfaction, gain
competitive advance and reduce cost in the same time. In this cooperation/competition we can find various companies with different connection and power. The dependence is also diverse between them. It is a dynamic system which has to adapt to the changes in environment (market, technical, communication, politics ect.) really fast.[4]
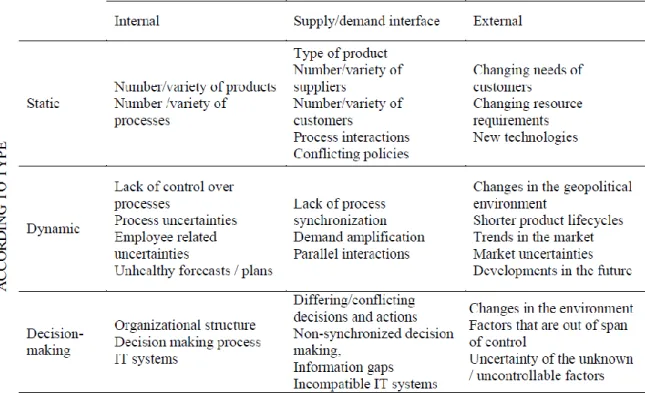
This complexity of supply system is the aim of most management activities. The managers need to face with three types of complexity: static complexity, that is related to the connectivity and structure of the subsystems involved in the supply chain (e.g. companies, business functions and processes); dynamic complexity, that results from the operational behaviour of the system and its
environment; and decision making complexity that involves both static and dynamic aspects of complexity.
Observing the supply chains from another viewpoint we can distinguish the drivers of complexity according to their origin: internal, supply/demand interface, and
external/environmental drivers.
Internal drivers: generated by decisions and factors within the organization (e.g.
product/processes design – these drivers are easier to influence since they are under organisational control.)
Supply/demand interface: drivers generated in cooperation with suppliers /customers, related to the material and information flows between suppliers, customers and/or service providers.
(Partially manageable, it’s under the influence of supply chain partners. The nature of
supplier/customer relations plays a significant role when dealing with these drivers)
External drivers: generated through mechanisms that the company has little, mostly lack of control.
(e.g. market trends, regulations and other various environmental factors.)[5]
Table 1 gives an overview of classification of supply chain complexity drivers according to type and origin:
Differing by origin and type can help
understanding and analysing the phenomena emerging in supply chains. Differing the strategies according to type of drivers allow developing a clear actions aiming to manage the supply chain complexity, although we shouldn’t forget the three complexity types are interrelated, and they should not be considered in isolation [4]
2. Bullwhip effect
The hardest thing in this network is to synthesise common and individual goals. The enterprises are individuals, and all of them want to reach as high profit as possible. But they also have connection with each other, make decision on different level and also have various impacts on each other’s operations. The supply chains show persistent instability and oscillations due to their complexity.
Every supply chain contains different size of
stocks and their unique managing policies
designed to approach specific targets (cost, profit, inventory level etc.) Due to the oscillations won’t let reaching these targets the managers may apply some counteractions – which usually amplify the instability. This phenomenon is – called bullwhip effect – was observed and described by the logistics executives of Procter
and Gamble now almost twenty years ago. [3]
2.1. An empirical study
Shortages and huge inventory level show the presence of the bullwhip effect. Even in the case of stable customer demand small changes in orders at the retail end tend to dramatically increase upstream the supply chain. Since then a lot of investigation were carried out in the topic; a logical assumption would be to think this problem had been solved by the time, and yet according to the fresh empirical studies supply chains still exhibit the bullwhip effect. The graphs below illustrate the arriving supply and the sales of two types of beauty products (shampoo and solar cream). The difference in their demand is obvious, one has relatively permanent consumption
through the year and the other shows strong seasonality, the customers need solar cream normally in the summertime. Conversely the
Table 1 Drivers of supply chain complexity [4]
variance in their supply is quite surprising: where the downstream demand is relatively flat, the Bullwhip effect arises; seemingly there are no any connection between demand and supply. Where the demand cannot be predicted precisely – only the time interval when it will come forward – the variance is low, the supply corresponds to the demand. [2]
Table 2 Sell-in and sell-out for a family of shampoos with a strong Bullwhip-effect [2]
Table 3 Sell-out and sell-in for a family of a solar cream with no Bullwhip-effect [2]
In different articles and reports we can find a lot of different definition of the bullwhip effect, there are no common agreement in the causes and triggers.
Problems caused by Bullwhip effect indicated in most of the literature: (1) excessive inventory throughout the whole supply chain; (2) insufficient or excessive capacity; (3) product unavailability;
(4) higher total supply chain cost; (5) loss of revenue; (6) inaccurate production plans.
Extended impacts of bullwhip effect: (1) reduction in efficiency; (2) manpower wastage; (3) material wastage; (4) unsatisfied customer demand. The literature collected 19 reasons of the bullwhip effect – 16 operational and 3 behavioural – which are listed below.[1]
Operational causes 1. Demand forecasting 2. Order batching 3. Price fluctuation
4. Rationing and shortage gaming 5. Lead time
6. Inventory policy 7. Replenishment policy 8. Improper control system 9. Lack of transparency 10. Number of echelons 11. Multiplier effect
12. Lack of synchronization 13. Misperception of feedback
14. Local optimization without global vision 15. Company processes
16. Capacity limits
Behavioral causes
17. Neglecting time delays in making ordering decisions
18. Lack of learning and/or training 19. Fear of empty stock
Table 4 Causes of the bullwhip effect [1]
2.2. Examples for practical solutions Industry leaders are facing BWE through: (1) information sharing, (2) channel alignment strategies, (3) implementing new incentives to the supply chain partners, (4) increasing operational efficiency, and (5) “defining new original
relationships”.
The literature examines many examples occurring in corporate environment, which mainly focus on information sharing according to scientific research. Many companies recognized, that they are not able to utilize their production capacity
(properly) without knowledge of costumer needs, therefore they collect the POS (Point of Sale) data from their partners and resellers via contracts, or often directly automated (IBM, Apple, HP)
extending their own IT systems. Other companies apply for this purpose developed management and information systems as EDI (Electronic Data Interchange) and the CAO (Computer-Assisted Ordering).
There are further applications in order to coordinate the cooperation, like VMI (Vendor Managed Inventory), application of balanced replenishment rules (CPR - Continuous Replenishment Policies), or programs aimed directly at the costumer (discount for customers who provide information on their consuming habits). The Campbell Soup, Scott Paper, M&M/Mars, Procter and Gamble (P&G), Nestle, Nabisco, and Quaker Oats use CPR, others as P&G, Apple, HP,Motorola, and Texas Instruments choose VMI. The Dell and companies with similar strategy sell their products directly to the
consumer avoiding the negative effects of the value chain this way.
Further practical solutions beside EDI and e- commerce can be the transport capacity
optimization strategies, involving logistics service providers or centralized distribution. [1]
3. Simulation environment
To examine a complex problem - wide scale of input data, various solver algorithms, links and correlations between variables - it is a good way to establish a model environment, which works the same way as the real system but less
extended, easier to comprehend the coherencies and more manageable. The beer game supply chain management simulation is widely used to demonstrate the inventory imbalance problems in supply chains, and it is excellent for highlighting the bullwhip effect. As in many other projects of the Specialized College of Transportation Engineering and Logistics we use learning by doing method and simulation in education. This is a really good way to incite “out of the box
thinking”, giving deeper understanding of an operation by experience and innovative problem solving. In order to have a tool for realizing these goals we created the BeerGame android software based on the original game of J. W. Forrester,
professor of MIT Sloan School of Management. In the frame of the simulation participants
impersonate a four stage supply chain (retailer, wholesaler, distributor, factory), and make their own decisions about actual orders in every round according previous demands and expectations.
This simulation environment is also suitable for examinations of different supply chain
management strategies.
During the training we encourage flexible innovative thinking and improve special management skills, so that they can create innovative performance measurement frames to have a global overview on the problem. The most important part of the training is the evaluation of the results. On this purpose we applied the Balanced Scorecard measurement system in the software, which considers the logistics
performance of supply chain actors based on special indicators from four viewpoints, especially on the finance, the customer (partnership), the internal process and the learning levels. The Balanced Score Card performance measurement system is very popular today, but it is hard to understand how it works in real-life situations.
The simulation also helps to understand the design of this measurement system, the meaning of the balanced perspectives and weighed KPIs.
The main goal of the training – toward
understanding system dynamics – is to develop the evaluation skills of the participants, we teach them how to create a unique measurement system for the complex problem they aim to analyse and how to interpret the results.
Based on the literature we created a few reference scenarios of simulation including theoretical and practical solutions on better coordination of supply chains (focusing mostly the methods applied in the industry). With the
modelling these solutions we can see better the differences between several supply scenarios and conclude the characteristics of an appropriate and effective performance measurement method.
3.1. Fear losing the customers
The customer is really important element of the supply chain, he makes the process work. In a lot of cases in real life companies make big safety stock which helps them to be able to fulfil the requirement. In the simulation the default
inventory cost is 1 $ and the backlog cost is 2 $ but in the real life they have a different rate. There are a lot of company whose products can be stored easily and in a low price (the product can be stored in small place, not perishable, has no special storing needs). In this case the simulation can be changed. The price of stock is lower but the charge of shortage is higher because the effect of losing a customer is associated with large losses (for example in the value chain of mobile phones, because not only the price of the device is an income, but the monthly charges of network services). Changing the evaluation criteria we can observe more intensively this special situation: we set the inventory holding cost 0,1 $ and backlog cost 20$ - it may seem drastic but we also need to be aware of the reduction of brand reputation or market value.
3.2. Agile system and lean system
It is the result of the modern world, consumers keen to buy specific, personalised products.
“Assemble to order” way of production spreads instead of bulk production: the manufacturer produces similar semi-finished goods, and finishes them when customers expressed their needs on features so that the product will be finished as it was ordered - in this case the customer may have to wait a bit. In the simulation this also need the change of weights. In the agile part of the chain it remains the same, but in the lean part the backlog means a much higher cost compared to the stock. With this logic we can also demonstrate situations when the capital tied up in inventory means the higher cost.
3.3. Order batching
Before the simulation we tell the participants they can order only 6 units of beer or its multiples (for example if their need is 4, they need to decide between 6 units or nor ordering any). This simulation shows the effect of order batching and minimum lot size. It is also a good way to simulate the impact of a strong partner in the chain, when the other participants are not being able to enforce their will in contract negotiations. It also becomes clear in this situation how the capacity utilization of transportation or warehouses
contribute to the performance of the company and the whole supply chain.
3.4. Gambling
This scenario demonstrates how the negative impacts of bullwhip effect is influenced by the periodically changing prices and how do the participants react on an announced discount. It can change the inventory strategy when the benefits of reduction exceed the inventory cost. In the regular simulation it means the trainer
introduce that in the next 2 rounds the price of the beer is lower, or after certain higher batch the participant is entitled to the discount.
3.5. Effect of periodic orders
In the companies’ operations the financial years and 3-month (quarter) periods are the milestones instead of months or years. There are targets assigned to these dates such as "sales must be doubled by the end of the year" or "the expenses must be lowered by 30% before the quarter ends".
To simulate how these corporate visions and strategies change the operation of the supply chain we tell the participants they have to empty their inventories or must not exceed 2 units in the 8th, 16th, 24th rounds (equals the end of
quarters). At this point some issues appear like after the lowered inventory the factory will need to activate extra capacities (additional cost), have to pay extra charge for overtime of workers, and the production ramp up causes also time-delay.
Hence, the backlog and the longer lead-time means decreased level of customer service. The same scenario is able to simulate the impact of bullwhip effect, when the unstable production schedules increase the time delays in the whole chain what can sum up huge cost of backlogs.
3.6. VMI (Vendor Managed Inventory) strategy The point of Vendor Managed Inventory strategy is that the Retailer does not make decisions or has any stocks, the Wholesaler performs this task, who is the Retailer's upstream partner in the chain. In the simulation this player does not place orders, only recieves the shipments judged by the Wholesaler. This will cause gambling with the stocks, the stronger partner is able to allocate the storage costs to the downstream partner.
3.7. Involvement of a logistic service Outsourcing of logistic tasks is quite frequent it can gain reduction of costs (cost of transactions, economies of scale advantages). To simulate this situation in the class the participants need to play
two scenarios. In the first it is played with a minimum amount of orders (batching scenario) and the second simulation is played with higher cost of inventory (the fee of outsourced
warehousing). In the end the result can be reached by a comparison.
4. Conclusion
In our essay we gave an overview of
replenishment rules on performance of supply chains. We can conclude that none of the
scenarios can serve the optimal solution. The best way is to choose the method what can improve the performance of the chain. The evaluation depends on the preferences of the company in each case, they need to decide which factor influences their goals and how big is this impact.
The Balanced Scorecard Measurement system helps to create the optimal frame of estimations and the results of the simulations help us to understand the reactions of supply chains on the applied replenishment strategies. In our further research we intend to work on the recognition of replenishment patterns based on company profiles.
5. Acknowledgement
This research was supported by the European Union and the State of Hungary, co-financed by the European Social Fund in the framework of TÁMOP 4.2.4. A/2-11-1-2012-0001 ‘National Excellence Program’.
References
[1] Bhattacharya Ranjan és Bandyopadhyay Susmita (2010): A review of the causes of bullwhip effect in a supply chain. Springer- Verlag London Limited 2010
[2] Giulio Zotteri: An empirical investigation on causes and effects of the Bullwhip-effect:
Evidence from the personal care sector, Int. J.
Production Economics 143 (2012) 489–498 [3] Lee, Hau L., Padmanabhan, V. and Whang,
Seungjin (1997): The Bullwhip Effect in Supply Chains. MIT Sloan Management Review, http://profitchain.com/images/The_Bullwhip_Eff ect_in_Supply_Chains.pdf
[4] Seyda Serdarasan (2012): A review of supply chain complexity drivers, Istanbul Technical University, Industrial Engineering Department, Macka 34367, Istanbul, Turkey
![Table 4 Causes of the bullwhip effect [1]](https://thumb-eu.123doks.com/thumbv2/9dokorg/1179661.86514/3.892.501.804.530.864/table-causes-bullwhip-effect.webp)
