BEERGAME REFERENCE SCENARIOS FOR BALANCED SCORECARD EVALUATION, HIGHLIGHTING INTERNAL
PERSPECTIVE
Katarina Lestyanszka Skurkova Slovak University of Technology in Bratislava
Trnava, Slovakia Phone: +42 190 7577 754 E-mail: katarina.skurkova@gmail.com
Norina Szander Széchenyi István University
Gyor, Hungary Phone: +36 70 426 0730 E-mail: noinya@gmail.com
Péter Bajor, Széchenyi István University
Gyor, Hungary Phone: +36 30 637 3270
E-mail: pbajor@sze.hu
Abstract
In the Szabó-Szoba R&D Laboratory in Győr we use the BeerGame software to demonstrate various supply chain management problems. We have developed this android application in order to have an adaptable, entertaining and effective program, which can provide real life experience to students and industrial partners about the nature of the bullwhip effect, inventory management challenges and create measurable results right away. For the most important part of our trainings and simulations - the discussion of outcomes and the team learning - we use the four (financial, customer, internal, innovation and learning) perspectives of Balanced Scorecard performance measurement system. As a part of our continuous research, in our paper we are focusing on the internal perspective to highlight the specialties of capacity utilization.
Keywords: beer game, bullwhip effect, android, Balanced Scorecard, internal perspective
1. INTRODUCTION
The Beer Game logistics management game is widely used to demonstrate the inventory imbalance problems in supply chains. In the frame of the game participants impersonate a four stage supply chain (retailer, wholesaler, distributor, factory), and make their own decisions about actual orders in every round according previous demands and expectations. The game was invented in the 1960s by Jay W. Forrester at MIT, as a result of his work on system dynamics.
The Beer Game has proven to be a very simple, yet effective experiential exercise for teaching the dynamics of marketing and logistics channels specifically and systems in general. Since its invention, it had been played all over the world by people at all levels, from students to presidents of big multinational groups. The factory is responsible for production, and the other three collaborators for distribution towards the customer. The aim of the players is rather simple: each of the four traders has to fulfil incoming orders by forwarding the required units of beer to the partners in the chain with minimal total cost (the charge of inventory holding is 1, in the case of backlog the related cost is 2).
Communication and collaboration are not allowed between supply chain stages.
This game can be used in formal education as well as in trainings to simulate real life situations and to highlight the difference between practice and theory by using the learning- by-doing method.
The purpose of the game is to show how the patterns we create in our relations with the world around us may end up with unexpected and undesired results. The game can represent how we (re)act in such trading situations and how these situations lead us into standard ways of "thinking" that we accept without question1.
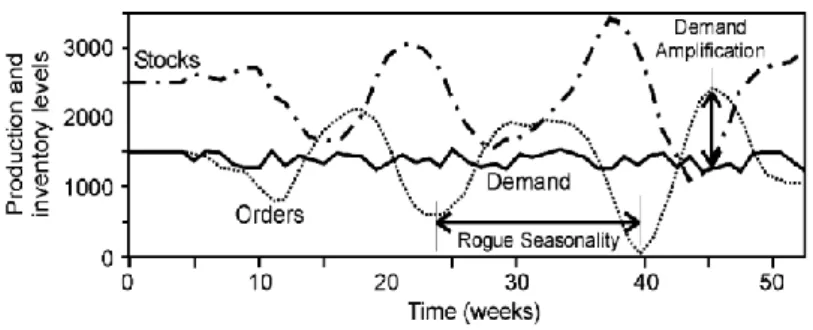
2. THE BULLWHIP-EFFECT
The competing supply chains are characterized by the ever growing extension. The need of mass-production is increasing in the industry while on the costumers’ side the demand of unique goods is extending. These cross-purposes cause the elongation of supply chains and turn them into supply networks with more and more processing, forming, storage stations and resulting in huge transportation and forwarding needs. This system structure has a serious and inseparable drawback, the presence of the bullwhip-effect.
The bullwhip effect is a well-known phenomenon of coordination problems in traditional supply chains. It refers to the effect that the forecast and the actual consumption get separated by the insufficient information sharing. Shortages and huge inventory level show the presence of the bullwhip effect. Even in the case of stable customer demand small changes in orders at the retail end tend to dramatically increase upstream the supply chain.
As a consequence of the bullwhip effect a range of inefficiencies occur throughout the supply chain:
1. excessive inventory throughout the whole supply chain;
2. insufficient or excessive capacity;
3. product unavailability;
4. higher total supply chain cost;
5. loss of revenue;
6. inaccurate production plans.
While the effect is not new, it is still a timely and pressing problem in contemporary supply chains. Bullwhip creates unstable production schedules and that leads to inefficiencies in supply chains, since it increases the cost for logistics and lowers its competitive ability. Companies have to invest in extra capacity to meet the high variable demand. This capacity is then under-utilised when demand drops. Unit labour costs rise in periods of low demand, over-time, agency and sub-contract costs rise in periods of high
1 http://www.masystem.com access 08.09.2013.
demand. The highly variable demand increases the requirements for safety stock in the supply chain. Additionally, companies may decide to produce to stock in periods of low demand to increase productivity. If this is not managed properly, this will lead to excessive obsolescence. Highly variable demand also increases lead-times. These inflated lead-times lead to increased stocks and ultimately the bullwhip effect. (Bhattacharya et al. 2010)9
Based on many scientific researches the trigger of the bullwhip effect can be traced by the lead time of information and material. A supply chain’s reaction on a change in end customer demand is delayed firstly because it takes time to pass on information about the change to suppliers and secondly because these suppliers need time to adjust their capacities and deliveries. The longer a supply chain is unable to react on a changed demand, the heavier it needs to react as soon as this is possible. The bullwhip effect increases with longer lead times. In addition to the lead time of information and material, the bullwhip effect is caused by other reasons:
Demand forecast based on orders of the succeeding tier
Historically oriented-techniques for demand forecast
Batch ordering
Price fluctuation
Exaggerated order quantity in case of delivery bottlenecks (Nienhaus et al., 2003).
Figure 1. Demand amplification
Source: Towill et al., 2007
3. BEERGAME TRAINING ENVIRONMENT
At the beginning of each game we explain the rules and the main points of the simulation, which represent the usual nature of supply chains. We present the roles, the directions of material and information flows, the charge of inventory holding and the backlog. With the software we developed our trainings last for 24 rounds, which is long enough to see the trends and the challenges, but short enough to not get bored. By this time every participant gets some experience about managing a supply-chain, can observe the difficulties, possibilities, typical tricks and some coincidences. At the end of the game they can share their feelings, experiences and some information with each other - along the supportive lead of the trainer. This discussion is very important in the aspects of recognition and learning.
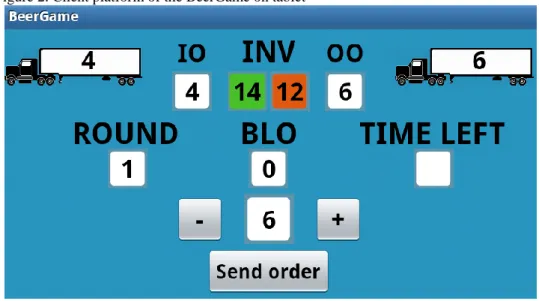
Figure 2. Client platform of the BeerGame on tablet
Source: tablet screenshot
During the discussions the participants express their typical observations:
the evolved shortage spreads along the chain
usually the factory has the biggest shortage and the retailer has the least
at the half of the gameplay (10-12th round) each of the participants gets frustrated by the appearing backlogs and makes the decisions in panic – worsening the situation
the period with the shortages is followed by a period with high inventory level
the bullwhip effect emerges without exception
The time frame usually allows us to have at least one additional full round. In this case the participants are more experienced, they can focus on the discussed and relevant details, they configure some tactics regarding to the consequences. In the second game they usually feel themselves confident and they usually assume that the bullwhip effect at this time won't upset the balance. But is does - in all cases.
The game - as we can see - is quite simple, the tasks and the functions are easy to understand. Our great advantage is that with the help of the Beer Game android application, the results are available promptly, and game experiences can be discussed right after the rounds. To lead the discussions more detailed, we implemented the Balanced Scorecard measurement system into the application.
4. THE BALANCED SCORECARD SYSTEM AS PERFORMANCE MEASUREMENT APPROACH
We had to realize that the traditional efficiency measures by themselves – because they are considering mostly the financial parameters of production processes – are inadequate in providing a complete and useful overview of organizational performance (in our case it means the performance of the whole distribution channel as a system). For better
understanding the relations not only on the operational, but also on tactical and strategic levels, the use of the Balanced Scorecard measurement system is widely accepted: it is operating on the financial, marketing (customer-related), operational (internal-business processes) and strategic dimensions (learning and growth).
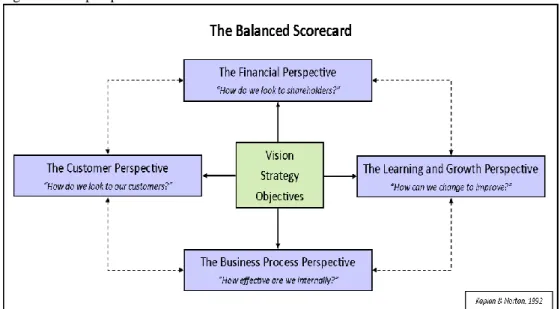
Figure 3. The perspectives of the Balanced Scorecard
Source: http://cowanglobal.com/tag/balanced-scorecard access 08.09.2013
A typical BSC consists of four perspectives - financial and non-financial measures to guide implementation and evaluation: financial, customer, internal processes, and learning/innovation, in addition focuses both on the short- and long-term objectives of the organization (Chopra, 2001).
The financial perspective is the basic of the BSC measurement system. It has a lot in common with the typical measurement systems, and that’s where the easiest to create KPIs.
The truth is that managers will always want to see clearly the data, trends, graphs, and use every possible instrument to learn where the company is heading to, be aware of the risk assessment and cost-benefit data. This is why it’s colligated with the other three perspectives, to help us to see the whole picture. We can generate the most obviously measurable indicators in this area, accurately calculate the inventory holding cost and the penalty in case of shortage, capital tied up in inventories, frequency and amounts of out-and in stores, storage costs (depend on the size of the warehouse and the storage technology).
The next factor is the customer, who – in an ideal supply chain- always should be satisfied. The management have to realize that the future of the company depends on the strong loyalty of the partners. Applying indicators on customer satisfaction may show hidden problems before our partner changes supplier. A possible way is to separate our customers in different groups, and rate their different needs, and then customer service can get closer and closer to their needs. In this case customers are mostly the trading partners, who order from our inventory.
In order to be successful the internal business processes must be continuously improved and examined. It makes it easier for the employees to perform their tasks, minimize the possible mistakes and the managers can see the quality of the production or services. The problem with this perspective is that it requires very profound knowledge about every tiny detail of the internal business processes, so it cannot be developed by an external consultant or expert. The internal processes of distribution channels contain lots of components. Forecasting, human and material resource planning, production and shipment scheduling can largely influence the efficiency of the company, and globally the performance of the chain. Usually, it is hard to find the real optimum, meanwhile it is possible to fulfil the demands by using different logistics strategies
The last perspective is the innovation and learning. It both means the training of the associates and the self-development of the company. With the current technical improvement speed, no one can afford to miss out these aspects. Employees have to be updated and evaluated during their work, and companies are advised to build databases of specialized knowledge. The level of technical developments can be measured by adequate metrics (physical and quality indicators). Those indicators allow companies to see how fast they can comply with new techniques, trends, and the fluctuation of the customer demands.
(Skurkova et al., 2012).
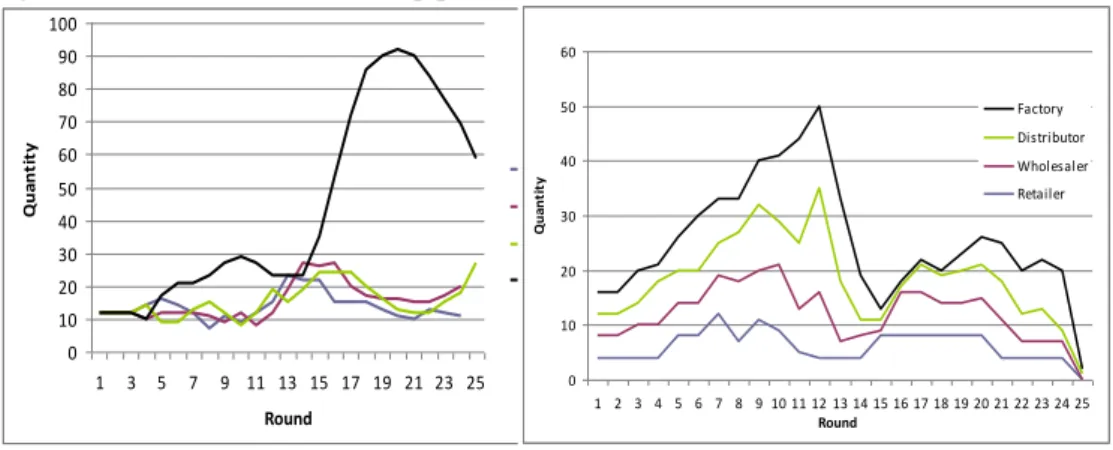
With the BeerGame software we are able to create graphs to demonstrate the bullwhip- effect and its consequences regarding to the four BSC perspectives. The typical results are shown below:
Figure 4. Illustration of the bullwhip phenomenon
Inventory levels Outgoing shipment
0 10 20 30 40 50 60 70 80 90 100
1 3 5 7 9 11 13 15 17 19 21 23 25 Round
Quantity
Retailer Wholesaler Distributor Factory
0 10 20 30 40 50 60
1 2 3 4 5 6 7 8 9 10 11 12 13 14 15 16 17 18 19 20 21 22 23 24 25 Round
Quantity
Factory Distributor Wholesaler Retailer
Shortages Incoming orders Source: own study
5. INTERNAL PROCESSES
New taxonomy:
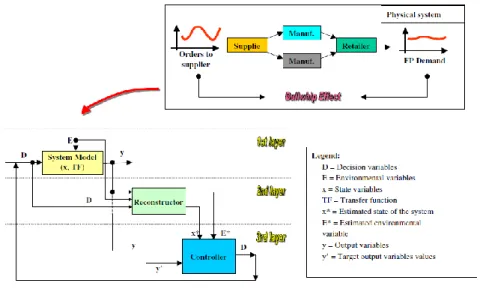
A very interesting research at the Technical University of Milano introduces a twofold distinction between layers (physical, reconstructing and control levels) and mechanisms (determinants and triggers), whose interaction may lead to the Bullwhip Effect. The aim of the article is to make the managers and researchers able to classify, understand and explain the causes of the undesired behaviour, and to understand which interventions (on which mechanism and on which layer) could be more effective in reducing the consequences.
1. System Model: the supply chain’s physical structure, including the operative processes (production, transportation, etc.) and its decisional and environmental variables.
2. Reconstructor Layer: all the methods (processes and systems) used by managers to estimate the state of their own business: the forecasting system, the accounting system (consumption of company’s resources) and the performance measurement system (distance between the company objectives and its current achievements).
The author highlights the difference between this three-layered framework and the standard framework in Control Theory textbooks, because this layer also contains the output measurement processes.
3. Controller Layer: the third layer includes all the models, heuristics, intuition, etc.
used to manage stocks, production activities, and delivery plans and so on.
0 2 4 6 8 10 12 14 16 18 20
1 3 5 7 9 11 13 15 17 19 21 23 25 Round
Quantity
Retailer Wholesaler Distributor Factory
Figure 5. Three-layered modelling of supply chain processes
Source: Miragliotta, 2006.
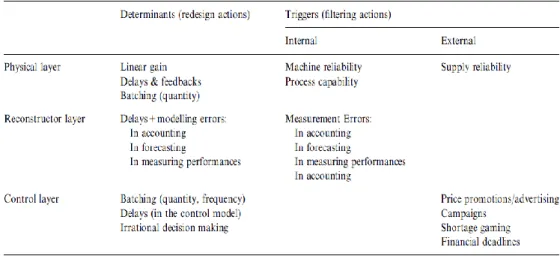
The second concept presented by the author is stability. The stability of a linear system is analytically defined by observing the free response of the system. „This means that the property of being stable has to be checked by triggering an initial perturbation (directly in the state of the system, rather resorting to an external input) and then observing the reaction of the system (Miragliotta, 2006). We can see on the following table how he applied the stability concept on his bullwhip effect study:
Figure 6. Determinants and triggers of the bullwhip effect
Source: Miragliotta, 2006.
As a result of his research he combines the System Thinking and the Management Operations schools into a new taxonomy of the bullwhip effect:
Figure 7. New taxonomy for the Bullwhip Effect
Source: Miragliotta, 2006.
This new taxonomy was directly derived from the existing scientific literature. What makes it special is its completely new viewpoint - which shows us how the various elements were united -, and its attitude, which builds a bridge between theory and practice.
Their aim was to draw attention to renew, revive and rejuvenate the scientific debate about the causes and the mechanisms of the Bullwhip Effect. He concluded that a ‘‘new generation of Beer Games’’ should be developed. The researchers should take not only the ordering processes into consideration, but every process and every factor which may trigger, or determine the Bullwhip Effect (Miragliotta, 2006).
The internal processes of distribution channels contain lots of components. Because of that it shows presence in most of the fields of the new bullwhip effect taxonomy.
Forecasting, human and material resource planning, production and shipment scheduling can largely influence the efficiency of the company, and globally the performance of the chain. Based on the experiences we can say it’s a good way to treat the whole supply chain as one system. If we consider the factors globally, and we treat the whole supply chain as one system, we certainly can get closer to the optimal solution. Several questions may arise elated to the internal processes:
How much information do we share with the partners?
Do we discuss our trading plans with our supplier?
Are we able to manage a common inventory or trading plan with the others?
How efficient is our capacity utilisation?
Do we have idle resources in the shipments?
What kind of forecasting method leads to the optimal resource allocation?
What is the ideal safety stock level?
The consequences of bullwhip effect are increasing total cost of supply chains, lower profit rate, and loss of competitiveness. The inappropriate usage of resources implies the increasing logistics costs and declining customer service and its adverse effects which worsen the performance of companies and supply chains.
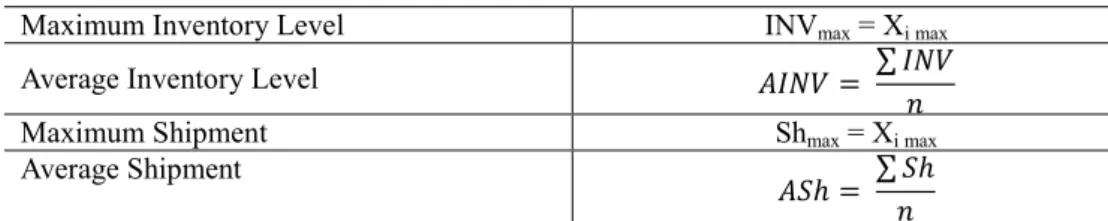
For the investigation of this perspective we used the following equations and had the results below:
Figure 8. Equations used for Internal processes perspective
Maximum Inventory Level INVmax = Xi max
Average Inventory Level 𝐴𝐼𝑁𝑉 = ∑ 𝐼𝑁𝑉
Maximum Shipment Shmax = Xi max 𝑛
Average Shipment
𝐴𝑆ℎ = ∑ 𝑆ℎ 𝑛 Source: own study
Figure 9. Results of sample BeerGame
Internal Retailer Wholesaler Distributor Factory Maximum Inventory
Level 22 38 50 38
Average Inventory
Level 14,79 14,13 17,75 11,92
Maximum Shipment 12 11 15 20
Average Shipment 6,33 6,5 7,58 9,17
Source: own study
The inventory levels at different points of supply chains vary separately from the real costumer demand because of the bullwhip-effect. The usage of resources as production-, distribution-, and warehousing capacities may easily become not effective. (Bhattacharya, 2010).
On the previous table the maximum and the average levels differ strongly in both cases, inventories and shipments. These data clearly shows the common logistics trade-off situation which the management typically have to face when designing the capacity of warehouses and cargos.
For example, while comparing the Maximum -, and the Average Inventory Level we can see significant differences, for example at the Distributor and the Factory. It is a waste of resources to start a warehouse-extension investment to establish a warehouse regarded to the highest stock occasionally - then “store air” on the shelves most of the time; or otherwise, they have to calculate the additional costs of “external storing” the extra stock.
The company needs to be clear with the capacity requirements according to their
“safety/risk” preferences.
The same applies for cargo capacities, where we may notice huge differences between the maximum and average demands.
6. CONCLUSION AND FURTHER RESEARCH
The main challenges of modern logistics and supply chain management are: providing high level quality service for customers according to the ever-growing and ever-changing demands, optimizing low series production and distribution in various environments, managing stocks in lean and agile production systems, eliminating the bullwhip effect, applying different trade-off solutions for minimizing infrastructure investment, distribution and warehousing costs and maximizing capacity utilization. The wide variety of products, the challenges of fluctuating demand, the appropriate inventory management and the application of modern production and distribution strategies requires flexible innovative thinking and special management skills from experts: to construct and manage effective, well-balanced manufacturing and distribution process in supply networks.
The BeerGame environment is excellent for training university students and experts from the economy to get these cooperative and innovative skills. During the trainings, the importance of Balanced Scorecard methodology is coming from theory into practice and participants can get real-life experience about the construction and operation of logistics performance measurement systems. In this article we were focusing on the internal processes perspective of the Balanced Scorecard performance measurement system. We can conclude, that while examining the performance of the supply chain, we always have to consider the logistics trade-offs as well.
In our further research we are focusing on the specification of typical “incoming order” patterns – derived by the expert trainings – and some “best practice” inventory management samples.
7. ACKNOWLEDGEMENT
This research was supported by the European Union and the State of Hungary, co- financed by the European Social Fund in the framework of TÁMOP 4.2.4. A/2-11-1- 2012-0001 ‘National Excellence Program’.
8. REFERENCES
1. Bhattacharya, R., Bandyopadhyay, S.: A review of the causes of bullwhip effect in a supply chain, Springer-Verlag. London Limited, 2010.
2. Chopra, S Meindl, P.: Supply Chain Management - Strategy, Planning and Operations, Prentice Hall, 2001.
3. http://cowanglobal.com/tag/balanced-scorecard access 08.09.2013.
4. http://cowanglobal.com/tag/balanced-scorecard access 08.09.2013 5. http://www.masystem.com access 08.09.2013.
6. Lestyanszka Skurkova, K., Szander, N., Zilahi R., Földesi, P.: BeerGame reference scenarios for Balanced Scorecard evaluation, The International Conference on Logistics & Sustainable Transport, Celje, Slovenia, 2013.
7. Miragliotta, G.: Layers and mechanisms: A new taxonomy for the Bullwhip Effect, International Journal of Production Economics, Vol. 104, Issue 2, 2006., p. 365–381
8. Nienhaus, J., Ziegenbein, A., Duijts, C.: How human behaviour amplifies the bullwhip effect – a study based on the beer distribution game online, Centre for Enterprise Sciences (BWI), Swiss Federal Institute of Technology (ETH), Zurich, 2003.
9. Szegedi, Z., Prezenszki, J.: Logisztikamenedzsment, Kossuth Kiadó, 2003
10. Towill, D.R., Zhou, L., Disney, S.M.: Reducing the bullwhip effect: Looking through the appropriate lens, International Journal of Production Economics, Vol. 108, Issue 1-2, 2007., p. 444-453.