Economic Aspects of Multi-Source Demand- Side Consumption Optimization in the Smart Home Concept
Aleš Horák
1, Miroslav Prýmek
1, Lukáš Prokop
2, Stanislav Mišák
21 Masaryk University, Botanická 554/68a, 602 00, Brno, Czech Republic
2 VSB – TU Ostrava, 17. listopadu 15, 708 33, Ostrava, Czech Republic hales@fi.muni.cz, mjp@mail.muni.cz, lukas.prokop@vsb.cz,
stanislav.misak@vsb.cz
Abstract: Current energy consumption trends lead to rapidly growing consumption of local renewable energy sources. Such installations bring new requirements on energy consumption profiles. Due to the massive multiplication of the results, one of the most interesting elements of the power grid, in this respect, is formed by households. Smart profiling of household energy consumption may be crucial for the adaptability of the global grid. In this article, we present the design and usage of a demand-side, consumption profiling system named the Priority-driven Appliance Control System (PAX). We describe the main features of the PAX system and show its application using real-world data. The main benefits are presented as direct economic assets in connection with various household energy sources (energy grid and photovoltaic panels) and efficient usage with regard to government energy grants.
Keywords: energy consumption; renewable energy sources; demand-side management;
Priority-driven Appliance Control System; PAX
1 Introduction
A significant shift from traditional energy generation systems, to energy systems with distributed energy production and widespread integration of renewable energy sources in modern power systems, often called “smart grids”, present new challenges for research and development. Balancing power demand and supply in a distributed energy system, with a large number of installed types of renewable energy sources (RES), is an important aspect of a smart grid systems.
Power demand-side management (DSM) techniques and other balancing methods, under the smart grid environment, are generally successful with optimization issues at various energy levels [20]. In this paper, we focus our research on the
smallest of the smart grid unit, a “smart home”. The smart home concept as a smart grid elementary unit was chosen here to describe the principles, interconnections and relationships of DSM. The application of DSM techniques to the optimization of smart home appliance switching scheme according to local renewable energy production is one of the main goals of this paper.
The demand-side management techniques have been used for various purposes.
The output of renewable energy generators (such as wind and photovoltaic) varies with weather conditions and generally it is not straightforward to modulate the output of RES to follow a particular load shape. An overview of current methods for the demand-side management can be found in [1], [18], [19]. The main DSM techniques include night-time heating with load switching, direct load control, load limiters, commercial/industrial programs, frequency regulation, time-of-use pricing or demand bidding [13], [14].
A DSM technique presented in [12] reshapes the demand profile by applying a heuristic optimization algorithm and a Genetic Algorithm Optimization.
Evolutionary soft-computing methods are applied in [2]. Another AI technique, an Artificial Neural Networks (ANN), is used to implement a short-term load forecasting module integrated with the proposed DSM technique to estimate the load profile for a 24 hour period. Neural networks are applied in [9] for the demand-side management in a household, with an installed photovoltaic (PV) system. The control system is composed of two modules: a scheduler and a coordinator, both implemented via neural networks. The control system enhances the local energy performance, scheduling home appliances switching and maximizing the use of PV system.
In [7], the demand-side management for smart home is introduced in three different approximations: in a Round Robin scheduling scheme, in a Highest Power Next (HPN) priority scheme and in a Reciprocal Fair Management (RFM) approximation. Both the Round Robin and the HPN scheme incorporate sorting algorithms and thus, need high computational complexity. In, a combination of real-time pricing with the inclining block rate model is used by adopting a combined pricing model. The proposed power scheduling method reduces the electricity cost and the “Peak to average ratio.” Since these kinds of optimization problems are usually nonlinear, genetic algorithms are used. A game theory was used in [11] to formulate an energy scheduling game, where the players are the users and their strategies are the daily usage of their household appliances and loads.
An appliance commitment algorithm that schedules thermostatically controlled household loads based on price and consumption forecasts is introduced in [5].
The formulation of an appliance commitment problem is described using an electric water heater load. The thermal dynamics of heating and coasting of the water heater load is modeled by physical models; random hot water consumption is modeled using statistical methods. The work in [8], presents a load management
technique for the air conditioner loads in large apartment complexes, based on systematic aggregations and load factor controls of the air conditioner loads based on a queuing system model and the Markov birth and death process. The proposed technique can offer effective and convenient load management measures to power companies and large customers. Techniques based on the multi-agent approach are exploited in [4].
Finally, our approach, focuses on a DSM technique for optimizing the daily load profile of a smart home, where various types of home appliances are installed. The primarily aim of this work is to demonstrate that intelligent demand-side consumption control, is not just a theoretical concept, but of practical importance and has a significant positive financial impact.
Advantages of our approach, are in the application of Erlag, especially because of flexibility of this language and possibility for the use of inexpensive devices for DSM. The main focus of this paper is to present results of the application of PAX on Green premium policy. The daily load optimization is processed according to the actual production of the installed photovoltaic system in order to achieve a maximum financial surplus. The details of the computation of the economic aspects of the system management are explicated with a particular example connected with the government photovoltaic subsidy named Green Premium.
Details for this economic model and are presented in Section 4.
2 Smart Household Architecture
In this research, we have focused on the lowest level of the smart grid structure - a household. The main aims of the control logic at this level is to control the operation of particular appliances, according to the actual power supply and its economic parameters, to minimize demand peaks, to make the overall consumption profile as fluent as possible (by coordination of particular appliance operation), to flexibly react to external effects (outage, brown-out, etc.) to minimize possible losses and reach given goals without significant impact on user experience.
In the following text, we describe the Priority-driven Appliance Control System (PAX). The PAX system is designed for small and economic microcontrollers (A prototype hardware implementation uses Atmel microcontrollers in the price of USD 5, see [16] for details.) for a particular appliance control, yet are flexible enough to meet the above-stated criteria. The controlling core of the system can mix real and virtual appliances, the system can thus be used as a smart home simulator, as well as, a real, physical appliance controller. In the following sections, we describe how real world data are used as a basis for smart home modeling.
2.1 Data Sources and Measurement
Long-period measurements (more than one year) were performed to collect actual household data to test the PAX system functionality. Each household appliance in selected real households was monitored using power network analyzer MDS-U [6]
during a long time period. MDS-U is a power analyzer which is able to measure voltage, current and power factors and calculate electrical quantities like active, reactive and apparent power for selected a time interval. In this case, a one minute time interval was used for data collection. Averaged power consumption curves were defined, based on long time power consumption data, for the 20 most common household appliances (refrigerator, cook top, wall oven, personal computer, washer, dishwasher, vacuum cleaner, etc.). During the long-term measurement, the switching scheme was evaluated for all monitored household appliances. Usual power consumption for any daytime can be defined based on averaged power consumption curves and the switching scheme for the most com- mon household appliances. The power consumption curves of household appliances are the fundamental data for PAX testing.
Together with household appliances monitoring, selected renewable power sources were monitored during a one year time period. According to the actual trends in renewable energy sources utilization, photovoltaic (PV) and wind power plants (WPP) were chosen. PV consists of mono crystalline panels Aide Solar (PMAX = 180 W, IMP = 5 A, UMP = 36 V, ISC = 5.2 A, UOS = 45 V, and 5 kWp rated power). WPP uses synchronous generator with permanent magnets of 12 kV∙A, voltage 560 V, current 13.6 A, torque 780 N∙m and 180 rpm. A detailed description of the small off-grid power system test bed can be found in [10] or [14]. Scenario II was applied for PV system with mono crystalline panels BENQ Green-Triplex PM245P00 (PMAX = 250 W, IMP = 8.17 A, UMP = 30.6 V, ISC = 8.69 A, UOS = 37.4 V, and 5 kWp rated power).
In the current PAX experiment, two data sources were used - a data set of power consumption and a data set of power production. Both the mentioned data sets are based on the one year measurements of real data.
2.2 The PAX System Implementation
The PAX system is designed as a multi-agent system based on agent communication between the core scheduler and the source and consumer agents.
The actual system implementation is developed using the Erlang programming language [3], which is excellent in processing large amounts of discrete data.
Erlang is a functional language with no shared memory. The system consists of many autonomous function units which communicate with each other, by message passing only. That is why, applications written in Erlang, can be parallelized in a
natural way and can run easily on multicore processors or even separate machines.
The parallelization scalability is almost linear.
Erlang also has very good support for runtime code compilation and knowledge base changes which is used extensively for particular virtual appliance control in the PAX system and for the user interface adaptations.
2.3 Online and Offline Usage
As we have mentioned above, the PAX system is designed to support the development of smart home automation from the simulation phase up to device control in real-time. For the later usage scenario, the scheduler is driven by real- time clock, the events are induced by external sources or occur at predefined times.
When used as a simulator, without connections to real devices, there is no need to restrain the process with real-time clock. The (simulated) events should occur and be processed as fast as possible to make mass data processing possible. For this purpose, the PAX core implements an event queue. The queue is filled with simulated or real-world measured data and the simulation consists of sequential processing of the queue events.
Each simulation step has several phases:
1. Fetch subsequent event from the event queue 2. Deliver it to the appropriate agent
3. The agent receives the event and/or (a) Changes its inner state
(b) Inserts a new event into the event queue 4. The simulation ends when the event queue is empty
Since the PAX core heavily depends on (asynchronous) message passing, it is possible to convert almost any code sequence into a sequence of events in the event queue. The same code can thus be used for offline data processing (simulation) and online device control. With this pure event-driven design, it is possible to implement arbitrary time precision simulation and simulate every possible aspect of the control system.
2.4 Appliance Categories
The grid appliances are classified into several types according to their control mechanism, user expectations and power consumption profiles.
2.4.1 Interactive Appliances
An Interactive Appliance (IA) is directly controlled by the user and the IA's reaction cannot be deferred. Also the power consumption is mostly constant and cannot be controlled.
A typical example of such an appliance is electric light, electric kettle, cook top, garage doors, gate, iron, lights, microwave oven, mixer, vacuum cleaner.
2.4.2 Intelligent Interactive Appliances
Intelligent Interactive Appliance (IIA) is a special case of the previous type. The main difference lies in the IIA's power control. The appliance can have more power consumption profiles that can be applied according to the current situation.
The appliance can be also driven by special extra communication/control treatment (e.g. a server computer power cannot be cut off immediately, instead a control signal must be emitted and the computer will undergo the internal shut down process as soon as possible).
A typical example of an IIA is a computer.
2.4.3 Deferrable-Operation Appliances
A Deferrable-Operation Appliance (DOA) is also controlled by the user but an immediate operation is not necessary. When the user commands the appliance to operate, he/she only expects it to begin the work in a reasonable (configured) amount of time. The user does not depend on the precise time of the operation start and end, only the operation result must be delivered appropriately.
Typical examples of DOAs are a washing machine, dryer, dishwasher, slow cooker, car battery charger and generally all appliances which require some user intervention before operation and whose products are expected to be available for a longer time period.
2.4.4 Feedback-Controlled Appliance
A Feedback-Controlled Appliance (FCA) is usually designed to keep a predefined and (repeatedly) measured value within specified limits. The value is spontaneously tending in one direction and the power supply is needed to push it in the opposite direction. A conventional operation cycle is as follows: whenever a feedback value reaches the lower bound, the appliance engine is powered up to push it to the opposite bound and powered off as soon as this value is reached.
This way the power profile of the appliance consists of alternating periods of maximum and none power consumption of a more or less constant duration.
A generalization of the FCA model in PAX is based on the assumption that the boundaries of the appliance operation should not be defined as hard limits that cannot be exceeded but rather as gradually increasing measures of the power demand priority (see the next section for details). From this point of view, a FCA can be seen, as a highly flexible device whose power consumption can be efficiently planned to fit together with a power consumption profile of other less- controllable devices. From the most general point of view it can be seen as a power storage device. Of course, FCA cannot store arbitrary amount of power - extreme values of stored power would have unintended consequences such as e.g.
food going to rotten in an under-cooled refrigerator. A typical example of a FCA is a gas boiler, refrigerator, oven or steam cooker.
2.5 From Real Devices to Virtual and Back Categories
A development of a successful energy consumption control scheme consists in several steps:
1. Measure power consumption profiles of typical household appliances 2. Pre-process the data to remove any non-significant fluctuation (at a
desired precision level)
3. Convert the data into power consumption change events
4. Test different consumption planning algorithms on the simulated appliances
5. Test the best algorithm on the real appliances
The main advantage of the PAX system is that the steps 2 to 5 can be done using the same software system thus keeping the simulation results as close to the real deployment as possible. Typical consumption profiles and parameters will be implemented into PAX in order to make the installation more user friendly, but several steps must be optimized for each installation.
3 Model Construction – Accumulator Type Appliance
In this section, we illustrate the above described process of transferring actual appliance measured data, into a virtual appliance model that is suitable for the PAX simulation.
Figure 1 displays parts of actual power consumption profiles of a typical boiler (central water heater) and a Television, measured with a one minute resolution.
The exact measured data are represented by the grey line. However, for model development, the data are transformed to a “cleaned” curve (the black line).
Figure 1
Measured power consumption and preprocessed profiles of a boiler (left) and a TV set (right).
The main objective of the data cleaning is to identify the consumption level breaking points which are then translated to consumption-change events with specific time values. Such events are included into the model communication flow, either in a form of a repeating pattern or (after statistical analysis) reproduced on a (partly) random basis.
The consumption data preprocessing algorithm is as follows:
1. Set a relative threshold value (typically, 1/5 of the maximum consumption)
2. Find the next time point where the difference between the last mean value and an actual consumption exceeds the threshold… This is the next breaking point
3. Compute the mean value between the last two breaking points 4. Repeat until end of data
The number of breaking points (and thus the similarity of the original and preprocessed curves) is determined by the chosen threshold, which is manually tuned to achieve the desired accuracy of the model.
The power consumption profile of a boiler consists of periodic repeating peaks of the same height (consumption) and a covariate length and distance. This behavior is caused by the thermostat, which keeps the inner temperature of the boiler within given limits. Generally, we consider the boiler to be an instance of a feedback- controlled device which acts like a perpetual energy accumulator. Whenever the accumulated energy falls below a given value, the device consumes the electrical power from the grid and accumulates it up to the upper limit value.
Table 1
Events generated from preprocessed measured data for the boiler model: {{{date}, {time}}, {message:
action, appliance, priority, consumption}}
{{{2013,03,04}, {0,34,0}}, {set_consumption, boiler1, 4, 1.984}}
{{{2013,03,04}, {2,25,0}}, {set_consumption, boiler1, 0, 0}}
{{{2013,03,04}, {3,03,0}}, {set_consumption, boiler1, 4, 1.979}}
{{{2013,03,04}, {3,10,0}}, {set_consumption, boiler1, 0, 0}}
{{{2013,03,04}, {4,41,0}}, {set_consumption, boiler1, 4, 1.970}}
{{{2013,03,04}, {4,49,0}}, {set_consumption, boiler1, 0, 0}}
A conventional boiler does not communicate with its environment and follows the accumulation cycle forever in the safe range. Such behavior brings three main disadvantages:
1. If there are several appliances with a similar behavior, they produce unwanted random consumption peaks when their accumulation phases overlap
2. In case of an emergency state of the grid (blackout or brownout), such a device can only be switched off. There is no intermediate state which would not substantially impact the function of the device (to keep the water hot) while lowering the load on the power grid
3. The appliance does not allow, in advance, for the scenerio of an anticipated/planned power loss
To fully exploit the potential of the smart grid concept, the PAX model of a smart boiler derived from real data is presented further. The smart boiler changes its behavior according to the state of the grid and cooperates with other power consuming devices.
In a virtual intelligent boiler model, based on real data, we must first identify the breaking points in the measured power profile of a real boiler and fit the profile to the fluctuation of the controlled value (the inner water temperature, i.e. the accumulated energy). The measured boiler water temperature oscillates between 49 °C and 58 °C. At 49 °C the heating system is switched on and works for 5-110 minutes until the temperature of 58 °C is reached (see Figure 1). The idle phase then lasts 30-90 minutes. Moreover, in the measured household, the boiler operation is limited by the time period of low-tariff energy lasting approximately from 20:30 till 6:30 (with flexible gaps summing to two hours in between). The heating speed can be approximated as 0.0017 °C per second. Of course, the real speed of heating is not linear but a linearization is a sufficient approximation in this case.
As mentioned above, the PAX system consumption scheduling is based on priorities of particular power consumption requests and sources (for details see [17]). The conventional nonintelligent boiler operates steadily in the given
temperature range and therefore its consumption requests have only one given priority P, where P is a high priority, e.g. P = 4 in our model. The appliance agent then periodically asks for power consumption of 1982 W with the priority 4 for 5- 90 minutes (depending on the preceding idle period length). In the model input data, the measured values from Figure 1 correspond to the events presented in Table 1. For each time moment, the actual consumption of the appliance boiler1 is set to the value of ≈ 1982 watts with constant priority 4 or to the value of 0 watts (with 0 priority).
We have obtained a model of a standard boiler. With the inter-appliance communication ability brought by the PAX smart grid, we turn it into a flexible model of boiler behavior. The new model is based on the idea that with a decrease of the accumulated energy value (in the boiler case it equals the decrease of the inner temperature), the urgency of the power consumption increases because of a risk of boiler malfunction. In the PAX model this means that the priority of the consumption requests is inversely proportional to the boiler water temperature.
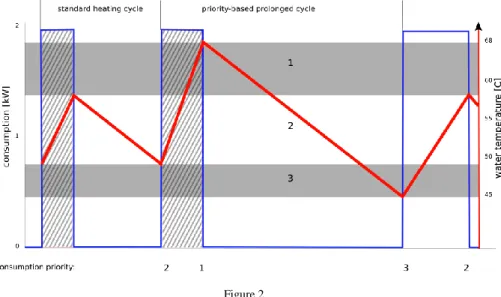
The temperature range is divided into priority zones, according to the risk that the device could miss its primary purpose (i.e. the risk of the water to cool down). If we approximate the temperature change function as stated above, the device agent can in each time interval estimate the time when the temperature crosses the priority border (if the actual consumption does not change). The priority ranges and the consumption prediction, is illustrated in Figure 2.
Figure 2 Priority ranges for boiler
At start, the agent requests the standard consumption time frame from the scheduler. If this request is denied, the agent computes the time when (with no power supplied) the temperature will cross the next lower priority limit and
requests the consumption from that time with a new (increased) priority. If the requested consumption frame is granted, the temperature crosses the priority boundary and the next request will have a decreased priority.
4 PAX Application – Green Premium Optimization
In recent years, the number of distributed power generators increases rapidly as small local power sources are being installed. The main representatives of newly installed power sources are photovoltaic (PV) systems with an installed capacity of around 5 kWp and positioned on the roof of the houses.
Such PV systems can be operated in various operation regimes according to national regulation rules. A frequent choice is using standard feed-in tariffs. The regime that we work with in this section exploits a government subsidy called Green Premium or Green Bonus.
The Green Premium policy supports the situation when the electrical energy produced by the household PV system is directly consumed by the house hold (or the household owner facilities). Only momentary surplus energy is sold in free energy market. Thus, to reach maximum financial profit and investment efficiency, as much produced energy as possible should be consumed by the PV system owner.
In this respect, the main issue of such household system is to optimize the energy consumption by shifting the load to the time when the PV system produces electrical energy. The PAX system is watching for PV system production and then control operation of each home appliances according to switching scheme and switching priorities. The main goal is to maximize energy consumption during PV system energy production using PAX system.
Generally, this leads to an optimization problem, where the load shift is optimized based on home appliances switching priorities and the actual installed PV system production. In the following text, we present the results of using the PAX system to solve such optimization tasks for a particular case of real household appliances and power sources. The households here are a common family houses with the floor area about 200 m2 (scenario II 160 m2) with 1 child and 2 adults living in the house (scenario II 2 adults, 3 little children). Usual home appliances serve as standard power consumers and 5 kWp PV system is installed on the roof for the both households. The PV system operates in the Green Premium policy.
4.1 Photovoltaic System Operation
In the presented optimization task, the first possibility is to operate the household using standard feed-in tariffs. The feed-in tariffs for electric energy produced by PV systems are defined by national regulations. The current tariffs in Czech Republic (where the measurements are performed) are defined by Energy Regulatory Office (ERU) price decision number 4/2012 (See Table 2), which includes a detailed specification of the government financial support for renewable energy sources.
Table 2
Feed-in tariff and Green Premium for photovoltaic (PV) system
Row PV system service start Installed power [kWh]
Feed – in tariff
Green Premium
from to from to [CZK/MWh] [CZK/MWh]
513 Jul 1 2013 Dec 31 2013 0 5 2990 2440
514 Jul 1 2013 Dec 31 2013 5 30 2430 1880
The feed-in tariff for the analyzed households is 3 410 CZK per 1 MWh, while standard electricity tariff (of a major energy distributor) for residential sector is 5723.82 CZK per 1 MWh (Value added Tax (VAT) included). The difference between the feed-in and standard tariffs is fixed and does not leave space for local consumption optimizations.
The other possibility is the Green Premium policy that is based on the assumption that the more renewable energy is consumed in the house, the higher is the overall financial profit of such setup. When a PV system works within the Green Premium regime, two electric meters are wired into the system. The first electric meter measures only the energy produced by the PV system and the second electric meter (4Q electric meter) measure bi-directional power flow from and to the power distribution network. The energy cost savings when following the Green Premium policy are twofold. First, the Green Premium subsidy is computed from the overall energy produced by the PV system. The current Green Premium (in the second half of 2013) for the measured households PV installation is 2440 CZK per 1 MWh. The second part of the Green Premium savings consists in the fact that the PV energy can be used as a part of the household energy consumption and the rest of if (the surplus energy) is sold under specific feed-in tariff for surplus energy, which is currently 640 CZK per 1 MWh.
4.2 Discussion
With an installation of a photovoltaic power source, the household energy system repeatedly changes the states between producing surplus energy that is being sold to the grid and consuming extra energy from the grid. The profitability of both
these modes of operation is graphically presented in Figure 3. As we can see here, each kilowatt hour of PV production is subsidized with 2.44 CZK, thus each kilowatt hour of surplus PV production corresponds to 3.08 CZK (the premium plus the sold energy market price).
Figure 3
The make-up of the price of generated (from photovoltaic) and consumed (from grid) power. If a) the consumed power exceeds the generated power then the difference must be purchased for the standard price from the grid, otherwise b) the surplus power can be solved to the grid for the subsidized price.
In the time of lack of self-generated power, each kilowatt hour costs 4.70 CZK when purchased from the grid. The surplus energy can be thus processed in two possible ways: a) it can be sold for the prize of 0.64 CZK, or b) it can be consumed by an in house appliance that would otherwise consume expensive energy from the grid. This operation requires a time shift in the appliance operation. Each such kilowatt hour of consumption, when moved from the deficit to the surplus hour yields 4.70 – 3.08 = 1.62 CZK.
Therefore, the Green Premium policy offers a good opportunity for consumption profile optimization. The pressure for in-house consumption is here, even higher than the motivation for an energy savings (in the surplus hours).
Figure 4
Comparison of the measured family house consumption profile with its optimized version
5 The Green Premium Model
On the side of the energy sources (photovoltaic and power grid), by setting the priority of the PV source higher than the priority of the grid power, the PAX system will automatically move the consumption into the area with unused PV power where possible. Of course the optimization improvement is highly dependent on the physical structure of the various appliances used within the household.
The DOA appliances category is the best category for the time-shifting optimization. Since we need to move as much consumption as possible to the PV output peak (noon), we must be able to defer the operation of the devices for several hours. This is possible only with DOAs hence this type of appliances yields the most of the achieved optimization.
From the Green Premium optimization point of view, the last two groups of appliances - IIA and FCA behave in a very similar manner. As we have seen in Section 3 and particularly in Figure 2, the operation of such appliances can be controlled intelligently to make a more suitable consumption profile but their operation generally cannot be postponed for hours. In spite of this, these appliances can be controlled with the aim of peak elimination. If there are many small areas of unused power distributed evenly throughout the PV generation peak (which surely is a case of household consumption profile), the PAX optimization reorganizes the overall consumption to fill the gaps. The resulting power consumption profile is more “flat”, with less peaks that need to be satisfied when power is used, from the grid.
5.1 Results and Discussion
The outcome of the optimization heavily depends on the inputs - especially on the number of the appliances in the household and their types. The type of the appliances varies significantly between particular households and substantially affects the consumption profile. The most influential, are the devices with high and steady power consumption such as e.g. electric heating. Such devices multiply the household power consumption and so there are special financial programs for households using these appliances. Therefore, the results presented in this paper cannot be generalized to such households.
Figure 4 shows the results of one day optimizations, of an analyzed household.
The colored bars represent momentary consumption of particular appliances. The black line in the chart shows the daily course of the power from the PV system and the red line denotes the amount of energy either purchased from the global grid (> 0) or sold to the grid (< 0). We can see that most of a standard household consumption, does not follow the peak of the photovoltaic source. The aim of the optimization task thus lies in equalizing this discrepancy.
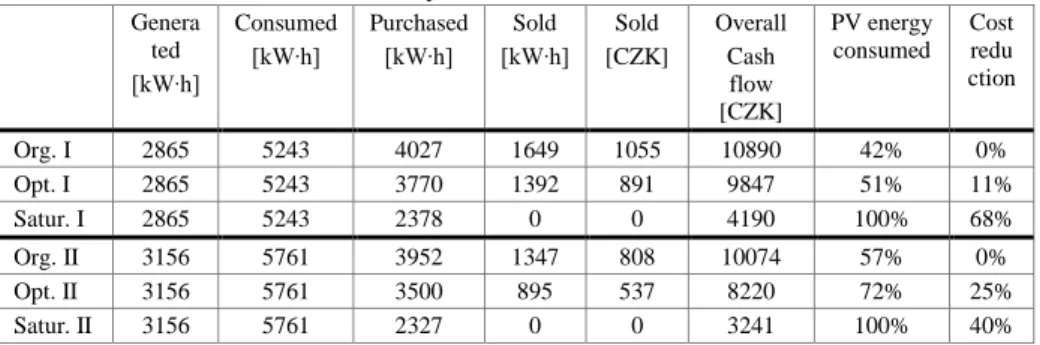
Table 3 Optimization Results Genera
ted [kW∙h]
Consumed [kW∙h]
Purchased [kW∙h]
Sold [kW∙h]
Sold [CZK]
Overall Cash flow [CZK]
PV energy consumed
Cost redu ction
Org. I 2865 5243 4027 1649 1055 10890 42% 0%
Opt. I 2865 5243 3770 1392 891 9847 51% 11%
Satur. I 2865 5243 2378 0 0 4190 100% 68%
Org. II 3156 5761 3952 1347 808 10074 57% 0%
Opt. II 3156 5761 3500 895 537 8220 72% 25%
Satur. II 3156 5761 2327 0 0 3241 100% 40%
Optimization of consumption by means of the PAX system was employed for a typical day with alternating cloudiness and a maximum supply of electric energy from PV around 20% of nominal power. These consisted of days during the autumn months where the element of diffuse radiation and PV making use of monocrystalline technology working with decreased effectiveness is predominant.
The much higher effectiveness of the PAX system can be recorded in the case of typical sunny days, in the spring and summer seasons. The direct element of sun shine, which PV with monocrystalline technology can make better use of, is predominant in these months. This positively manifests itself in a higher PV effectiveness. PV is used more often over the course of the daily cycle in the belt (70-100)% of the installed power and the length of the energy supply from PV is higher (approximately, 3 hours longer in comparison with a mostly cloudy day).
As a result of the longer time interval for energy from PV and also a greater performance from PV, consumption can more effectively optimized with the use
of PAX, with the goal being, to purchase the least amount of energy, sell the least amount, in other words use as much energy from PV for one's own consumption.
Optimization by means of PV has higher effectiveness for this kind of day, which is given by the possibility of shifting, first and foremost, DOAs to the area of the maximum performance curve of PV. All of the appliances from DOAs are characterized by simple predictable cycles, and this including the stream profile and the length of duration. These can be fastened as the same time without actually significantly influencing the usual functioning of the household. These also consist of appliances which are energy demanding as they make up almost 70% of the appliances overall in the framework of the daily cycle. By means of appliances from the category DOAs, the profile under the power curve PV is thereby practically fulfilled at the time of its operations with a maximum effectiveness and a maximum performance. This fact results from the result of the amount of energy either purchased from the global grid (>0) or sold to the grid (<0), where there is an evident minimum amplitude within the period (12-16), in the afternoon.
Table 4
The electrical energy produced by the photovoltaic system (Ed means daily average during the month, Em is overall power production in the month)
month January February March April May June
Ed [kW∙h] 3.15 4.86 8.38 11.28 11.40 11.40
Em [kW∙h] 97 136 260 338 353 342
month July August September October November December
Ed [kW∙h] 11.03 11.16 8.75 5.92 3.70 3.03
Em [kW∙h] 343 345 262 184 111 94
This is of course given by the fact that the majority of energy from PV is consumed whereby it is covered by the consumption of energy dominant appliances (dishwasher, washing machine, dryer). Apart from DOA appliances, the overall effectiveness of the energy system with the optimization of FCE can be increased, where the main representative in the analyzed case is a boiler.
For selected locality, the PV energy naturally varies not only during the day, but the variations also follow the course of seasons in the year. For the particular PV system the yearly history of average produced energy per month is shown in Table 4. Total energy production is 2865 kW∙h.
The results of the PAX optimization of one-year consumption of the analyzed households are summed up in the Table 3. In the first row, there are original values taken from the measurement of the given household consumption profile.
As we can see, the PV power is about one half of the household consumption but nearly 75% of the consumed power must be purchased from the grid operator at high price and more than a half of the PV production is sold for eight times lower market purchase price. The overall cost of the consumed power if it were
completely purchased from the global grid (i.e. without the PV installation), would be 24654 CZK (scenario I) and 27077 CZK (scenario II). The PV installation alone reduced this amount with the Green Premium subsidy of 6991 CZK (7701 CZK scenario II.), the 5718 CZK (6893 CZK scenario II) reduction in the energy purchased from the grid and the surplus PV power sold for the price of 1055 CZK (808 CZK scenario II). The overall cost with the PV installation thus drops to 10890 CZK (10074 CZK in scenario II).
These figures also show that in such typical household with the given PV size, the Green Premium subsidy makes the PV investment mostly, a partial coverage of the electrical power costs. This is consistent with the stress the subsidy puts on the local energy consumption, making it a good solution for individual family investment rather than for for-profit photovoltaic farms. From this point of view, the Green Premium program is surely a better solution over other kinds of PV subsidy programs.
The rows “Opt. I” and “Opt. II” of Table 3 shows the results of the model PAX optimization. As we can see, the amount of the purchased energy was lowered thus increasing the profitability of the PV installation. Time-shifting operations computed by PAX priority rules allowed an increase in the local consumption of the PV power to more than 51% (72% in scenario II). As described above, this number would be different for households with a different appliance structure, like Scenario II (more DOA appliances, such as a dryer used much more often because of care of 3 children).
Due to the PAX system ability to combine the real and virtual appliances, the financial impact of the appliances control system application is highly predictable.
The predictability of the outcome is surely an important property for an overall PV investment/breakeven/profitability decision.
The results obtained by means of the PAX model reveal yet another possibility for increasing the PV investment profitability substantially under the Green Premium subsidy. The crucial figure here is the gap between the power purchase and sale prices. The part of the generated power that is left unused even after the consumption optimization represents a next big opportunity for the PV profitability improvement. This surplus power can be utilized by the last type of the appliance - the Intelligent Interactive Appliance (IIA). We can estimate the maximum financial effect of such an appliance in this way: let us suppose that we have a device which can be switched on in the time of the surplus power, has a scalable, power consumption and its activity has a positive financial effect. For the conservative estimation, we can suppose the financial effect is the same as the price of the consumed power - i.e. under standard circumstances; its action has zero profitability. But with the Green Premium subsidy, such a device will substantially improve the PV financial balance. Thanks to the PAX model, we can estimate the overlap between the power production and the consumption and thus estimate the remaining unused power to be sold to the network. The financial
effect of using all such energy by the described intelligent device is presented in Table 3, in the “Satur. I” row and Satur. II row. We can see that the financial potential of such energy usage is huge even with our conservative “normal zero profitability” assumption. Based on this, we can conclude that the development of such intelligent devices can be of high importance to Czech households using the Green Premium (or similar) subsidy programmer. Besides the above mentioned personal computer, a device of such kind can be represented by e.g. electric car charging stations, for-profit computation clusters or energy back-ups.
Conclusions
This paper introduced an application of the demand-side power consumption management principles that reshapes the demand profile by applying load shifting and load shedding, to reach a maximum financial benefit for the consumer.
The load shifting and load shedding operations are computed by the presented demand-side management system named PAX (Priority-driven Appliance Control System). The PAX system searches for runtime flexible optimal switching scheme for the household appliances according to appliance operation priority and energy sources availability.
We have presented, in detail, an application of the PAX system to the Smart Grid concept. As a particular example of direct exploitation of such a system, we have built a real-world model for optimizing the energy costs of a household equipped with a small on-roof photovoltaic system, operated under the Czech Republic government subsidy program called the Green Premium. This subsidy scheme is based on a principle that motivates the household owner to consume as much photovoltaic energy as possible, locally.
We have enumerated the energy costs, for an example household, in several analyzed scenarios. In the analyzed cases, the PAX system allowed savings of 9%
of the photovoltaic power, without any negative effect on the user experience resulting in 11% for scenario I and 25% for scenario II. Application of the PAX system saved 1.043 CZK (11%) in scenario I and 1.854 CZK (25%) in scenario II.
We have also discussed a possible setup directing photovoltaic power exploitations of up to a 68% (Scenario I) and 40% (Scenario II) reductions from the original costs.
In future research, we want to extend the application of PAX from Smart Homes to Smart Villages, where we suppose better utilization of the PAX advantages, due to more available appliances in FCA group and the related economies of scale.
Acknowledges
This paper was supported by the project LO1404: Sustainable development of ENET Centre, Students Grant Competition project reg. no. SP2015/170 and SP2015/178, project LE13011 and project TACR: TH01020426.
References
[1] J. Aghaei, M. I. Alizadeh, Demand Response in Smart Electricity Grids Equipped with Renewable Energy Sources: A review, Renewable and Sustainable Energy Reviews 18 (2013) 64-72
[2] R. Badawy, A. Yassine, A. Hessler, B. Hirsch, S. Albayrak, A Novel Multi- Agent System Utilizing Quantum-Inspired Evolution for Demand Side Management in the Future Smart Grid, Integrated Computer-Aided Engineering 20 (2) (2013) 127-141
[3] F. Cesarini, S. Thompson, Erlang Programming, O'Reilly Media, 2009 [4] L. Cristaldi, F. Ponci, M. Riva, M. Faifer, Multiagent Systems: an Example
of Power System Dynamic Reconfiguration, Integrated Computer-Aided Engineering 17 (4) (2010) 359-372
[5] P. Du, N. Lu, Appliance Commitment for Household Load Scheduling, Smart Grid, IEEE Transactions on 2 (2) (2011) 411-419
[6] Egu Brno, s.r.o., Power Network Analyzer, available from http://www.egubrno.cz/sekce/s005/pristroje/mds/mds_ostatni_3_5_u.html [7] G. Koutitas, Control of Flexible Smart Devices in the Smart Grid, Smart
Grid, IEEE Transactions on 3 (3) (2012) 1333-1343
[8] S. C. Lee, S. J. Kim, S. H. Kim, Demand Side Management with Air Conditioner Loads Based on the Queuing System Model, IEEE Transactions on Power Systems 26 (2) (2011) 661-668
[9] E. Matallanas, M. Castillo-Cagigal, A. Gutierrez, F. Monasterio-Huelin, E.
Caamanno-Martín, D. Masa, J. Jimenez-Leube, Neural Network Controller for Active Demand-Side Management with PV Energy in the Residential Sector, Applied Energy 91 (1) (2012) 90-97
[10] S. Misak, L. Prokop, Technical-Economical Analysis of Hybrid Off-grid Power System, in: 11th International Scientific conference Electric Power Engineering, 2010
[11] A. H. Mohsenian-Rad, V. Wong, J. Jatskevich, R. Schober, A. Leon- Garcia, Autonomous Demand-Side Management Based on Game-Theoretic Energy Consumption Scheduling for the Future Smart Grid, Smart Grid, IEEE Transactions on 1 (3) (2010) 320- 331
[12] M. Morgan, M. El Sobki Jr., Z. Osman, Matching Demand with Renewable Resources using Artificial Intelligence Techniques, in: IEEE EuroCon 2013, 2013
[13] T. Pinto, I. Praca, Z. Vale, H. Morais, T. Sousa, Strategic Bidding in Electricity Markets: an Agent-based Simulator with Game Theory For Scenario Analysis, Integrated Computer-Aided Engineering 20 (4) (2013) 335-346
[14] Pinto, T., Vale, Z., Sousa, T. M., Praça, I., Santos, G., Morais, H. (2014)
“Adaptive Learning in Agents Behaviour: A Framework for Electricity Markets Simulation,” Integrated Computer-Aided Engineering, 21:4 [15] Prokop, L., Mišák, S. Off - Grid Energy Concept of Family House, (2012)
Proceedings of the 13th International Scientific Conference Electric Power Engineering 2012, EPE 2012, 2, pp. 753-758
[16] M. Prymek, A. Horak, Modelling Optimal Household Power Consumption, in: Proceedings of ElNet 2012 Workshop, VSB Technical University of Ostrava, Ostrava, Czech Republic, 2012
[17] M. Prymek, A. Horak, Priority-based Smart Household Power Control Model, in: Electrical Power and Energy Conference 2012, IEEE Computer Society, London, Ontario, Canada, 2012
[18] P. Siano, Demand Response and Smart Grids - a Survey, Renewable and Sustainable Energy Reviews 30 (2014) 461-478
[19] G. Strbac, Demand Side Management: Benefits and Challenges, Energy Policy 36 (12) (2008) 4419-4426, Foresight Sustainable Energy Management and the Built Environment Project
[20] X. Wang, Y. Wang, Y. Cui, Energy and Locality Aware Load Balancing in Cloud Computing, Integrated Computer-aided Engineering 20 (4) (2013) 361-374