Műhelytanulmányok Vállalatgazdaságtan Intézet
1093 Budapest, Fővám tér 8.
(+36 1) 482-5566, Fax: 482-5567
www.uni-corvinus.hu/vallgazd
Aligning supplier evaluation with manufacturing competitive priorities
Results of an international survey in manufacturing and assembly industries
Zsolt Matyusz Gyöngyi Vörösmarty
164. sz. Műhelytanulmány HU ISSN 1786-3031
2016. december
Budapesti Corvinus Egyetem Vállalatgazdaságtan Intézet
Fővám tér 8.
H-1093 Budapest Hungary
Aligning supplier evaluation with manufacturing competitive priorities Results of an international survey in manufacturing and assembly industries
Zsolt Matyusz (research fellow, zsolt.matyusz@uni-corvinus.hu)
Gyöngyi Vörösmarty (associate professor, gyongyi.vorosmarty@uni-corvinus.hu)
Corvinus University of Budapest, Department of Logistics and Supply Chain Management Fővám tér 8., Budapest, H-1093, Hungary
Phone: +36 20 482-5520 Fax: +36 1 482-5567
Summary
The aim of our research is to investigate a company’s purchasing and manufacturing competitive priorities jointly in order to uncover any relationships between them and also their effect on the supply chain tools implemented by the company. We assume that the supplier selection criteria of the companies reflect the true goals of the purchasing function and we take the purchasing function’s point of view to examine the aforementioned relationships. We use a multinational database for our empirical analysis which contains almost 700 companies from 20 countries and data that were acquired in 2009. We identified four different clusters which reflect a different level of supply chain tool implementation.
Key words: purchasing competitive priorities, manufacturing competitive priorities, supply chain coordination
Introduction
The performance of a supply chain depends on its members’ performance and on how they coordinate their priorities and capabilities: internal functions should align their goals and this is true for processes of the supplier and buyer as well. This means that the purchasing function cannot be viewed in isolation: the decisions and supply solutions should be consistent with operational and logistics strategy and tools. This paper aims to contribute to literature on alignment among purchasing decisions, manufacturing priorities and tools applied to coordinate supply processes.
The paper is structured as follows. First, we review the relevant literature, then we describe the research methodology. During our paper, we try to find the answer to the questions: What are the most important supplier selection criteria and manufacturing priorities according to the International Manufacturing Strategy Survey (IMSS)? How can be these criteria classified and how they relate to each other? Based on this classification we can identify the relationship with supply chain coordination tools.
Literature review
The concept of supply chain management advocates that the concerned value-creating processes of the company and its suppliers should be aligned to each other. To achieve this result there is a great emphasis on defining corporate competitive priorities and on the proper implementation of these priorities in supplier relationships. A popular research topic is to investigate the alignment of corporate strategy and purchasing strategy (e.g. Knudsen, 2003;
Tan, 2002). A lot of these articles and studies accept the assumption from the outset that there is indeed a fit between manufacturing competitive priorities and purchasing priorities, and they focus on examining this relationship (e.g. Krause et al, 2001; Carter and Narasimhan 1996;
Watts et al., 1995).
The literature of operations management deals with the definition and understanding of competitive priorities to a great extent (e.g. Hill, 1993; Skinner, 1969). Thanks to the many contributions of the field to this topic these competitive priorities now more or less very clearly defined. This is reflected by several studies and even textbooks, which are very homogenous in terms of these competitive priorities. From the purchasing’s point of view, however, these priorities are not so clear. There are some comprehensive studies on the evolution of supplier selection criteria from the mid1960s till the early 2000s. In the following we will rely on them in order to show the set of supplier selection criteria that was considered to be important.
Dickson (1966) was the first to investigate supplier selection criteria. He reasonably assumed that the criteria considered when selecting a vendor for nuts and bolts are not the criteria that are appropriate when selecting a supplier for a computer and that the effectiveness of a purchasing decision is a direct function of selecting the proper vendor. He obtained his data from purchasing agents throughout the US and Canada by a mail questionnaire and finally collected a list of 23 criteria, despite the easiness „to abstract a list of at least 50 distinct factors”.
Weber et al. (1991) followed up Dickson’s study 25 years later. They limited their review to vendor selection by industrial purchasers and included only articles published in major journals written in English, but investigated all 23 criteria identified by Dickson (1966). The third study was written by Zhang et al. (2003) and intended to further the work of Weber et al. (1991).
They used exactly the same methodology as Weber et al. (1991) and also discussed whether the precise meaning of some criteria changed or was extended. The results of the previous authors will be discussed further in the following section along with IMSS results.
The industrial context is also very important in the selection of supplier criteria. Recent paper examines the manufacturing and assembly industries (ISIC 28-35), hence its findings cannot be
generalized automatically outside these industries as other aspects also should be considered.
E.g. Wilson (1994) investigated the question that how did changing business climate affect buyers’ choice decisions in supplier selection. She explored supplier selection strategies of the early 1990s compared with late seventies and early eighties. She found that over time it seems that the importance of quality has increased, that price may be relatively less important than in past years, but the relative importance of supplier selection criteria changes depending on the attributes of the product being bought. This finding furthermore supports Dickson (1966).
Lambert et al. (1997) inspected supplier selection criteria in the healthcare industry. Besides product characteristics, the number of suppliers was also of great importance. In case of single- sourcing technical support and product reliability were the most important factors, while in case of multiple-sourcing price, quality and delivery were the relevant criteria.
There was also a debate whether these purchasing competitive priorities should mirror manufacturing competitive priorities at all. The research of Tracey and Tan (2001) confirmed that higher levels of customer satisfaction and firm performance result from selecting and evaluating suppliers based on their ability to provide quality components and subassemblies, reliable delivery and product performance. However, this research calls attention to a trend that lot of companies are putting an ill-advised amount of importance on unit price when selecting supplier, however the path analysis did not support the argument that buying based on unit price will result in an advantage due to competitive pricing.
This gave us the motive to start from the examination of purchasing competitive priorities, where we assume that the supplier selection criteria of the companies reflect the true goals of the purchasing function. We investigate how can these criteria be connected to manufacturing competitive priorities and to supply chain coordination tools. Coordination within a supply chain is a strategic response to the problems that arise from inter-organisational dependencies within the chain and a coordination mechanism is a set of methods used to manage interdependence between organisations (Xu, Beamon, 2006) Proper supplier evaluation and the selection of proper coordination methods should be aligned with the manufacturing priorities.
Our research provides empirical results in this topic based on an international manufacturing survey.
Survey data
We have used IMSS (International Manufacturing Strategy Survey) data for our analyses. IMSS is a global network of researchers with the objective to study international manufacturing strategies, their implementation and resulting performances in operations and related areas, such as supply chain management and new product development. IMSS was initiated by Chris
Voss (London Business School, UK) and Per Lindberg (Chalmers University of Technology, Sweden) in 1992. Since that time five rounds of the survey have been completed.
In IMSS data are collected by national research groups using a standard questionnaire developed by a panel of experts, exploiting the previous editions of the research. The questionnaire is translated, if needed, for local languages by OM professors. Although there is a suggested method of collecting data (focus on better companies, search companies by mail and/or phone, send out the questionnaire to contact person, one per company, usually a plant or manufacturing manager in printed form, follow up to help and inspire contact person to fill in the questionnaire), it is up to the national research team to make decisions on this procedure.
However, research teams have to provide data about the sampling procedure to the global network.
IMSS-V data bank, the one we use in this paper, extends to 671 valid observations from 19 countries from 2009. The survey focused on ISIC 28-35: manufacture of fabricated metal products, machinery and equipment. The industry and country characteristics of the database can be seen in Tables 1 and 2.
Table 1: Industry distribution of the sample
Manufacture of … Valid answers
fabricated metal products 213
machinery and equipment 179
office, accounting and computing machinery 11
electrical machinery and apparatus 76
radio, television and communication equipment and apparatus 37 medical, precision and optical instruments, watches and clocks 37
motor vehicles, trailers and semi-trailers 43
other transport equipment 31
Missing 44
Table 2: Geographic distribution of the sample
Countries Observations Countries Observations Countries Observations
Belgium 36 Hungary 71 Spain 39
Brazil 37 Ireland 6 Switzerland 31
Canada 19 Italy 56 Taiwan 31
China 59 Japan 28 UK 25
Denmark 18 Mexico 17 USA 72
Estonia 27 Netherlands 51
Germany 38 Portugal 10 Total
average 35
Analysis and results
First we take a look at the manufacturing and purchasing competitive priorities themselves. We identify the most relevant criteria from both categories and then proceed to perform a k-means cluster analysis in the space of these selected competitive priorities. After that we use ANOVA to uncover differences among the clusters concerning the attributes of the product, number of suppliers and supply chain tools and programs.
Descriptive statistics
The IMSS questionnaire is quite stable in terms of supplier selection criteria, the variables have not changed too much during the subsequent rounds. The related question asks for the criteria which are used for selecting key/strategic suppliers. The answers are measured on a 5-point Likert-scale where a value of 1 means that the criterion is of no importance while a value of 5 shows high importance. See Q1 in Appendix for the original question.
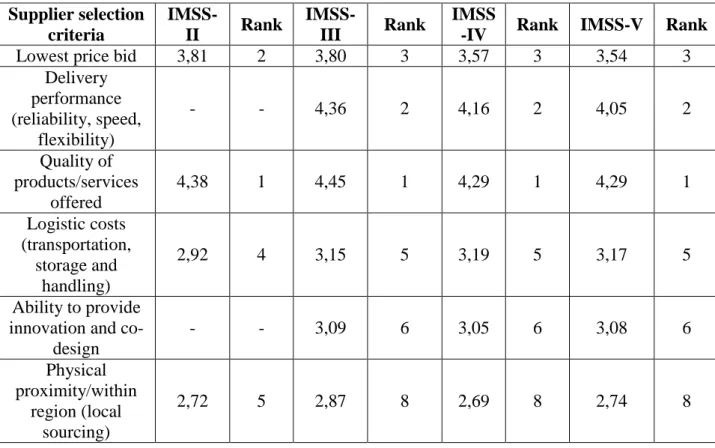
IMSS-II asked about six criteria: lowest price bid, quality of products/services offered, logistics costs, physical proximity, willingness to disclose information and legal terms. In the later rounds the list of criteria was extended with delivery performance, ability to provide innovation and co-design, and evaluation of supplier potential, while the criterion of legal terms was omitted. Table 3 shows the sample averages from rounds II, III, IV and V, and the ranking of the criteria based on the averages.
Table 3: Supplier selection criteria, sample averages and ranking Supplier selection
criteria
IMSS-
II Rank IMSS-
III Rank IMSS
-IV Rank IMSS-V Rank
Lowest price bid 3,81 2 3,80 3 3,57 3 3,54 3
Delivery performance (reliability, speed,
flexibility)
- - 4,36 2 4,16 2 4,05 2
Quality of products/services
offered
4,38 1 4,45 1 4,29 1 4,29 1
Logistic costs (transportation,
storage and handling)
2,92 4 3,15 5 3,19 5 3,17 5
Ability to provide innovation and co-
design
- - 3,09 6 3,05 6 3,08 6
Physical proximity/within
region (local sourcing)
2,72 5 2,87 8 2,69 8 2,74 8
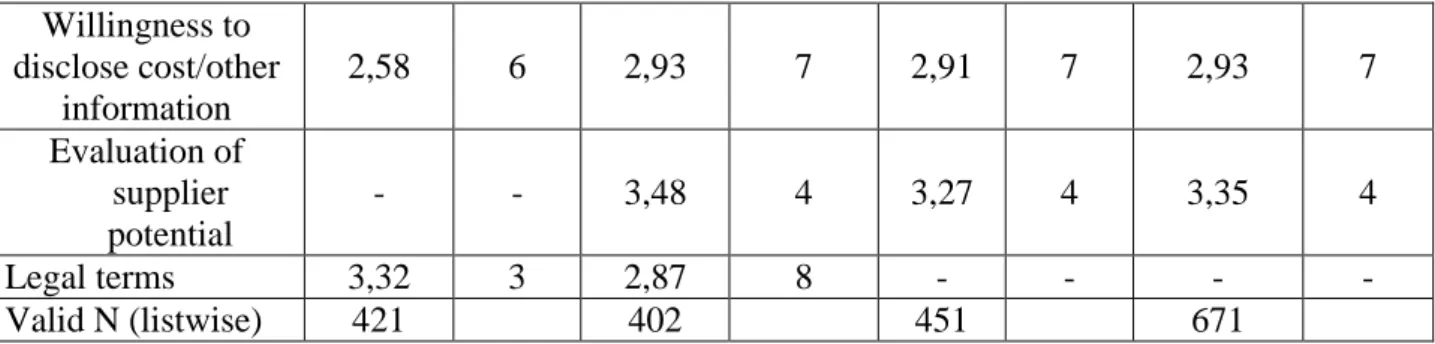
Willingness to disclose cost/other
information
2,58 6 2,93 7 2,91 7 2,93 7
Evaluation of supplier potential
- - 3,48 4 3,27 4 3,35 4
Legal terms 3,32 3 2,87 8 - - - -
Valid N (listwise) 421 402 451 671
The result shows that the relative importance of the criteria has not changed over the rounds.
Quality of products/services offered was always the most important criterion with delivery performance to follow since IMSS-III. It is worth noticing that only these two criteria has a mean above 4.00 points. Lowest price bid is the third important criterion, then evaluation of supplier potential, logistic costs, innovation and co-design, disclosure of information and physical proximity follow.
It is time to look at the results of Dickson (1966), Weber et al. (1991) and Zhang et al. (2003) with a focus on those criteria that are also present in the IMSS questionnaire. Table 4 shows the ranking of these authors in comparison with IMSS ranking. Though the names of the criteria were not always exactly the same in case of IMSS and the previously mentioned authors, but the content of the criteria can be compared. As technical capability includes research and development facilities also in itself, we matched this criterion with the IMSS criterion of ability to provide innovation and co-design, as we think the essence of the two criteria is very close to each other.
Table 4: Supplier selection criteria ranking comparison Supplier selection
criteria
Ranking of Dickson
(1966)
Ranking of Weber et al.
(1991)
Ranking of Zhang et al. (2003)
Overall IMSS ranking
Quality 1 3 2 1
Delivery 2 2 3 2
Performance history 3 10 7 4
Warranties and claims policies
4 - - -
Production facilities and capacity
5 4 4 -
Price 6 1 1 3
Technical capability (including research and development facilities)
7 6 5 6
Geographical location 20 5 6 8
Comparing the rankings we can see that the top three criteria is quality, delivery and price with some difference in the order of the criteria. Nonetheless it seems that these are the most important purchasing competitive priorities, based on both the IMSS results and the rankings in Table 4.
Now we turn our attention to the manufacturing competitive priorities. These priorities are order winner criteria from the major customers of the companies. See Q2 in Appendix for the original question. Table 5 shows the descriptive statistics for the priorities. Only half of the dozen manufacturing competitive priorities seem to be a frequent order winner from major customers:
lower selling prices, design quality, conformance quality, dependable and faster deliveries, and customer service. We do not investigate customer service, as this competitive priority does not have a serious connection to the focus of our paper. The other five important competitive priorities, however, can be directly aligned with the top three purchasing competitive priorities.
Table 5: Manufacturing competitive priorities
N Mean Std. Deviation
Lower selling prices 662 3,8097 1,06805
Superior product design and quality 662 4,2069 ,83299
Superior conformance to customer specifications 660 4,1697 ,87885
More dependable deliveries 657 4,0639 ,90839
Faster deliveries 663 3,8002 1,01482
Superior customer service (after-sales and/or technical
support) 657 3,8326 1,06895
Wider product range 655 3,2702 1,07029
Offer new products more frequently 653 3,0505 1,14402
Offer products that are more innovative 654 3,4817 1,12420
Greater order size flexibility 654 3,2615 1,21394
Environmentally sound products and processes 651 3,1475 1,16080
Committed social responsibility 653 2,9510 1,25103
Lower selling prices can be related to the lowest price bid, they show the price/cost dimension in both purchasing and manufacturing. Design quality and conformance quality from the manufacturing side can be aligned with the quality of the products/services offered from the purchasing side. Finally, manufacturing’s more dependable and faster deliveries emphasize the same dimension as purchasing’s delivery performance. Because of this we keep these competitive priorities for the cluster analysis, where we intend to classify firms into different clusters in the space of the competitive priorities.
Cluster analysis
We performed k-means cluster analysis in the space of the eight most important purchasing and manufacturing competitive priorities. We did not have an a priori assumption of the cluster number, so we ran the analysis with different ones (from 2 to 5 clusters). After evaluating the results, we concluded that the four-cluster-solution can be interpreted well in the context of our research. Lower or higher cluster number led to murky clusters that were not clearly explainable. Table 6 shows the cluster membership. Clusters 1 and 2 consist of approximately 25-25% of the companies, while Cluster 4 has twice as many firms as Cluster 3.
Table 6: Cluster membership
Cluster 1 150,000
2 149,000
3 112,000
4 215,000
Valid 626,000
Missing 45,000
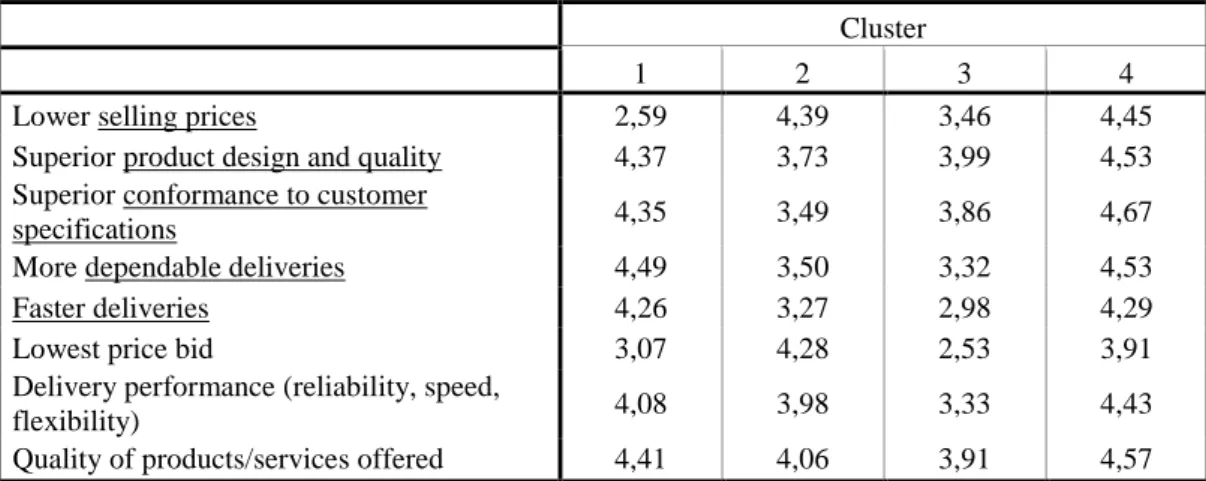
After performing the cluster analysis for 4 clusters, the emerging final cluster centers are shown in Table 7.
Four clusters with different characteristics emerged. Members of Cluster 1 think that the most important order winners are related to quality and delivery performance, and they select their key suppliers based on these attributes. Lower selling prices are not really important to their customers, so the lowest price bid is not a strong selecting criterion for suppliers.
Table 7: Final cluster centers
Cluster
1 2 3 4
Lower selling prices 2,59 4,39 3,46 4,45
Superior product design and quality 4,37 3,73 3,99 4,53
Superior conformance to customer
specifications 4,35 3,49 3,86 4,67
More dependable deliveries 4,49 3,50 3,32 4,53
Faster deliveries 4,26 3,27 2,98 4,29
Lowest price bid 3,07 4,28 2,53 3,91
Delivery performance (reliability, speed,
flexibility) 4,08 3,98 3,33 4,43
Quality of products/services offered 4,41 4,06 3,91 4,57
Members of Cluster 2 are the opposite. Lower selling prices are very important to major customers, so lowest pricing bid is the most important supplier selection criterion. The relevance of quality and delivery performance is under the average in the eyes of major customers, and this is also reflected in the supplier selection criteria. These companies compete with price while maintaning a certain level of quality and delivery performance which is also required from the suppliers.
Members of Cluster 3 are very interesting. Cluster center values are very low in every dimension. Members are located between Clusters 1 and 2 in terms of selling price and quality performance. Lower selling price is not so important as in Cluster 1, but more important than in Cluster 2. For quality performance it is just the opposite situation. Companies in this cluster think that delivery performance is of the least importance for the major customers. If we look at the supplier selection criteria, we see that they have the lowest values compared to the other clusters. Quality performance of suppliers seems to be the most important but even this reflects a lower level than the level of Cluster 2.
Members of Cluster 4 think that all competitive priorities are very important. Among manufacturing competitive priorities they have the highest values for each. Among the purchasing competitive priorities they came second only in terms of lowest price bid, but it is only Cluster 2 (which focuses on price) who has a higher value.
ANOVA
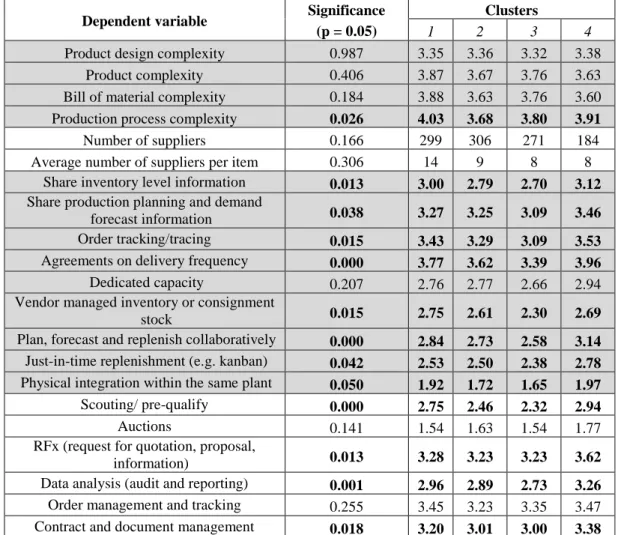
Finally we performed ANOVA analysis to see what kind of significant differences can be identified among the four clusters. Results are shown in Table 8, with the mean values for each cluster, as well as the level of significance (significant differences at p = 0.05 level are marked with bold characters). See Q3-Q6 in Appendix for the original questions.
If we look at first the attributes of the product, it seems that there are no big differences among the clusters. The only significant attribute is the complexity of the production process. Members of Clusters 1 and 4 have more steps/operations in their production process than firms in the other two clusters. These companies probably have more sophisticated and more reliable processes that ensure their better performance in quality and delivery.
Clusters do not show significant difference in the number of suppliers or the average number of suppliers per item. Along these dimensions three clusters out of four have almost identical values, but the fourth cluster do not differ significantly from the others.
The implementation level of several supply chain coordination tools show significant differences among the clusters. Only one tool, dedicated capacity was used to a simliar extent in each cluster. In the other cases, Clusters 1 and 4 have the highest values, usually with Cluster 4 on top. Clusters 2 and 3 that focus on price or on nothing, performed worse in the adoption of every tool.
Table 8: Differences among the clusters
Dependent variable Significance (p = 0.05)
Clusters
1 2 3 4
Product design complexity 0.987 3.35 3.36 3.32 3.38
Product complexity 0.406 3.87 3.67 3.76 3.63
Bill of material complexity 0.184 3.88 3.63 3.76 3.60
Production process complexity 0.026 4.03 3.68 3.80 3.91
Number of suppliers 0.166 299 306 271 184
Average number of suppliers per item 0.306 14 9 8 8
Share inventory level information 0.013 3.00 2.79 2.70 3.12 Share production planning and demand
forecast information 0.038 3.27 3.25 3.09 3.46
Order tracking/tracing 0.015 3.43 3.29 3.09 3.53
Agreements on delivery frequency 0.000 3.77 3.62 3.39 3.96
Dedicated capacity 0.207 2.76 2.77 2.66 2.94
Vendor managed inventory or consignment
stock 0.015 2.75 2.61 2.30 2.69
Plan, forecast and replenish collaboratively 0.000 2.84 2.73 2.58 3.14 Just-in-time replenishment (e.g. kanban) 0.042 2.53 2.50 2.38 2.78 Physical integration within the same plant 0.050 1.92 1.72 1.65 1.97
Scouting/ pre-qualify 0.000 2.75 2.46 2.32 2.94
Auctions 0.141 1.54 1.63 1.54 1.77
RFx (request for quotation, proposal,
information) 0.013 3.28 3.23 3.23 3.62
Data analysis (audit and reporting) 0.001 2.96 2.89 2.73 3.26
Order management and tracking 0.255 3.45 3.23 3.35 3.47
Contract and document management 0.018 3.20 3.01 3.00 3.38
The adoption of electronic supply chain tools show a very similar picture. In four out of six occasions the significance among the clusters was significant and again Clusters 1 and 4 reached the highest values. We should note however, that the adoption level of supply chain tools (both coordination tools and electronic tools) was not really high even in the companies that belong to Clusters 1 and 4. Agreements on delivery frequency are adopted most, followed by an electronic tool (RFx) and a coordination tool (order tracking/tracing)
Conclusions
We found that purchasing competitive priorities and manufacturing competitive priorities can be aligned in the everyday operations of the firms. We were able to identify different clusters of companies that have different preferences for purchasing and manufacturing competitive priorities. These findings also support the results previously described by Tracey and Tan (2001). The adoption level of supply chain coordination tools and electronic supply chain tools were higher in those clusters that put greater emphasis on quality and delivery performance on both the purchasing and manufacturing side. Of course this difference in adoption levels does not necessarily mean that the companies are following a conscious strategy – this question should be an interesting aim for further research.
Acknowledgement
This research was supported by the Hungarian Scientific Research Fund (OTKA T 76233).
References
Carter, J. R., Narasimhan, R., 1996. Is Purchasing Really Strategic? International Journal of Purchasing and Materials Management 32 (1), 20-28.
Dickson, G. W., 1966. An Analysis of Vendor Selection Systems And Decisions. Journal of Purchasing 2 (1), 5-17.
Hill, T., 1993. Manufacturing Strategy, 2nd Edition, McMillan, London
Knudsen, D., 2003. Aligning corporate strategy, procurement strategy and e-procurement tools.
International Journal of Physical Distribution & Logistics Management 33 (8), 720-734.
Krause, D. R., Pagell, M., Curkovic, S., 2001. Toward a measure of competitive priorities for purchasing. Journal of Operations Management 19, 497-512.
Lambert, D. M., Adams, R. J., Emmelhainz, M. A., 1997. Supplier Selection Criteria in the Healthcare Industry: A Comparison of Importance and Performance. International Journal of Purchasing and Materials Management. 33 (1), 16-22.
Skinner, W., 1969. Manufacturing – Missing Link in Corporate Strategy. Harvard Business Review May/June, 136-145.
Tan, K. C., 2002. Supply Chain Management: Practices, Concerns, and Performance Issues.
Journal of Supply Chain Management 38 (1), 42-53.
Tracey, M., Tan, Ch. L. 2001. Empirical analysis of supplier selection and involvment, customer satisfaction and firm performance, Supply Chain Management, An International Journal, 6. (4.) 174-188.
Watts, C. A., Kim, K. Y., Hahn, C. K., 1995. Linking Purchasing to Corporate Competitive Strategy. International Journal of Purchasing and Materials Management 31 (2), 2-8.
Weber, C. A., Current, J. R., Benton, W. C., 1991. Vendor selection criteria and methods.
European Journal of Operational Research. 50, 2-18.
Wilson, E. J., 1994. The Relative Importance of Supplier Selection Criteria: A Review and Update. International Journal of Purchasing and Materials Management. 30 (3), 35-41.
Xu, L., Beamon, B. M. 2006. Supply chain coordination and cooperation mechanism: an attibute-based approach, Journal of Supply Chain Management, 42. (1) 4-12.
Zhang, Z., Lei, J., Cao, N., To, K., Ng, K., 2003. Evolution of Supplier Selection Criteria and Methods
http://www.pbsrg.com/overview/cibtg61/downloads/Zhiming%20Zhang_Evolution%20of%20Supplier%20Selec tion%20Criteria%20and%20Methods.pdf
Date of downloading: June 22nd 2008
Appendix
Q1. What criteria do you use for selecting your key/strategic suppliers? Specify the level of importance of each criterion.
None (1) High (2)
Lowest price bid
Delivery performance (reliability, speed, flexibility)
Quality of products/services offered
Logistical costs (transportation, storage and handling)
Ability to provide innovation and co-design
Physical proximity to/within region (local sourcing)
Willingness to disclose cost/other information
Evaluation of supplier potential (development programs or past performance record)
Q2. Consider the importance of the following attributes to win orders from your major customers.
Importance in the last three years Not important (1) Very important (5)
Lower selling prices
Superior product design and quality
Superior conformance to customer specifications
More dependable deliveries
Faster deliveries
Superior customer service (after-sales and/or technical support)
Wider product range
Offer new products more frequently
Offer products that are more innovative
Greater order size flexibility
Environmentally sound products and processes
Committed social responsibility
Q3. How would you describe the complexity of the dominant activity?
Modular product design (1) (5) Integrated product design Single manufactured components (1) (5) Finished assembled products Very few parts/materials, one-line bill of
material (1) (5) Many parts/materials, complex bill of material
Very few steps/operations required (1) (5) Many steps/operations required
Q4. Indicate the following supplier figures:
Total number of
suppliers
Average number of suppliers per
item
Q5. How do you coordinate planning decisions and flow of goods with your key/strategic suppliers and customers?
Adoption with suppliers None
(1)
High (5)
Share inventory level information
Share production planning and demand forecast information Order tracking/tracing
Agreements on delivery frequency
Dedicated capacity
Vendor managed inventory or consignment stock Plan, forecast and replenish collaboratively Just-in-time replenishment (e.g. kanban) Physical integration within the same plant
Q6. Indicate to what extent you use electronic tools with your key/strategic suppliers and customers for the following.
Adoption with suppliers None (1) High (5)
Scouting/ pre-qualify
Auctions
RFx (request for quotation, proposal, information) Data analysis (audit and reporting) Order management and tracking Contract and document management