Chapter 12
Cross-Country and Inter-Temporal Analysis of Supply Chain Integration (SCI): China, Hungary and the Netherlands - Changes in SCI from 1996 to 2008
Aron Antal, Gergely Tyukodi, Taco van der Vaart, Gyula Vastag
Abstract: Using plant level data from a global survey with multiple time frames, one begun in the late 1990s, this paper introduces measures of supply chain integration and discusses the dynamic relationship between the level of integration and a set of internal and external performance measurements. Specifi cally, data from Hungary, The Netherlands and The People’s Republic of China are used in the analyses. The time frames considered range from the late 1990s till 2009, encompassing major changes and transitions. Our results seem to indicate that SCI has an underlying structure of four sets of indicators, namely: (1) delivery frequency from the supplier or to the customer; (2) sharing internal processes with suppliers; (3) sharing internal processes with buyers and (4) joint facility location with partners. The differences between groups in terms of several performance measures proved to be small, being mostly statistically insignifi cant - but looking at the ANOVA table we can conclude that in this sample of companies those having joint location with their partners seem to outperform others.
Keywords: Supply chain integration, Survey data, Cross-country comparison, Temporal analysis
Introduction
One of the most “published” (novel) areas of Supply Chain Management is Supply Chain Integration (SCI). Early promoters of this area of survey research are Frohlich and Westbrook, with their seminal empirical paper (Frohlich and Westbrook, 2001), where, based on a global sample of companies producing fabricated metal products, machinery and equipment1, they found signifi cant relationships between a variety of performance measurements and Supply Chain Integration strategies.
Since Frohlich and Westbrook (2001), several papers seem to have verifi ed these results (for example Bagchi et al., 2005; Flynn et al., 2010) using different samples in different industries. However, some recent papers have found that the connection between supply chain integration strategy and company performance depends on other factors too - i.e. there is no direct or deterministic connection between the two, thus it cannot be generalized (Van der Vaart and Van Donk, 2008).
In this paper we would like to make a context-based review and do an analysis of SCI and test the connection between SCI and company performance. In doing so, we will not necessarily rely on introducing further variables into models but, instead, will explore the underlying structure of SCI that can be revealed from data and concepts used in earlier research.
The covered 13 years of the questionnaires enables us to see a development path and compare the changing strategies of companies in countries of different sizes and at different development stages. The Netherlands is a small Western-European country with a well-developed democracy; Hungary is a small, transitional Central European country; while China is becoming (within the time frame of the study) a world-leading, powerful country with a communist government. In terms of the manufacturing industry, due to the huge increases in electronics and IT business in the last two decades, manufacturing industrial output has increased signifi cantly.
As the market grew, China has increased its manufacturing output and become a world-leading, exporting country, while the other two countries in the analysis have stayed more or less at the same level, i.e. their performance growth has remained moderate. Due to increased global trading and innovations in the IT industry we expect that supply chain integration strategies of companies in these countries are similar to each other, though their performance and their development are notably different;
thus it can be assumed that the connection between SCI and company performance depends on other factors, like culture or stage of economic development.
1 ISIC Division 38, as specifi ed by ISIC Rev.2, United Nations Statistics Division, 2011
Literature Review
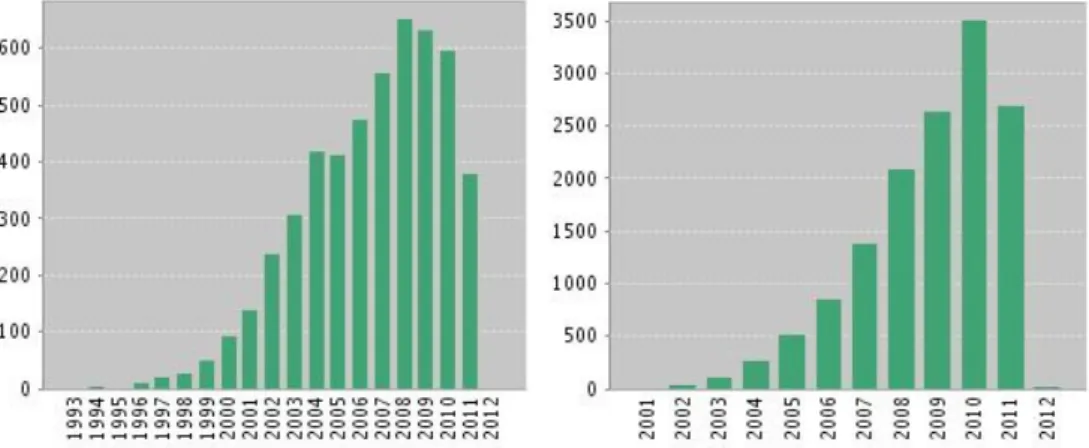
Supply chain integration is a much debated concept in operations management, particularly because this has evolved a lot from the early stages - yet still some questions remain unanswered. To understand the origins of existing debates in the literature, we have structured the literature into two parts. The fi rst early stage lasts until 2000/2001, while the second, more mature, stage starts in 2001. We differentiate the two periods based on the number of articles published on the SCI topic. In the years 2000/2001, there was a huge spike in SCI topic articles which resulted in a further, more linear expansion lasting up to the present.
Figure 1. Number of Articles Published on the Lemmatized Topic of SCI before and after 2000/2001
Source: Thomson Reuters Web of Science Topic search: supply chain integration (lemmatized) on 2011.11.17.
The true pioneer of extolling the benefi ts of coordination in complex systems is Forrester, well-known for his work on systems dynamics (Forrester, 1968); yet the fi rst lemmatized (that is counting all the different infl ected forms of a word so they can be analyzed as a single item) appearance of supply chain integration comes under the name of “distributed cooperative work” (Hammainen, 1991), and it comes from a Scandinavian polytechnic journal. The paper presented a practical application of a mathematical model used in the supply chain of one-of-a-kind elevators.
Holland et al (1994) reported a case study of Motorola’s global cash management system with a supply chain focus that resulted in a better alignment of money fl ows with physical fl ows. The appearance of Inter-organizational Information Systems (IOS) allows such integrations, and IOS is still a major topic of research in current e-business, information and science literature.
We shift our perspective from a chronological to an “importance” focus, using the number of citations as a proxy for importance. Presenting the top, most cited articles (Thomson Reuters Web of Science on 2011.11.17.) from the pre-2001 phase does not substitute for a thorough, chronological review, but does give a good representation of the posteriori focus of references from the second, post- 2001 time period.
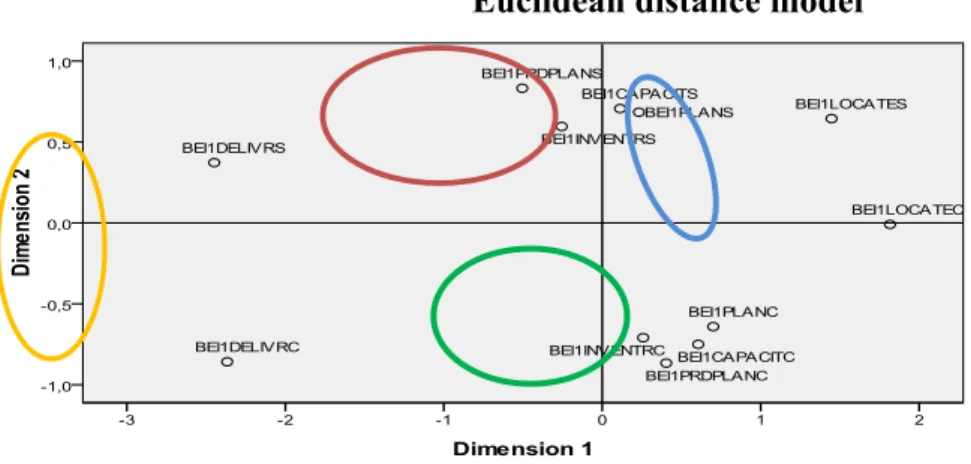
The number of references for the fi rst period is in the domain of hundreds/
year, and for the second period it is thousands/year. This signifi cant growth can be linked to the growing number of SCI topic articles, which we must consider a self- generating process to some extent after analyzing the number of citations.
Figure 2. Number of Citations/Year of Articles Published before and after 2000/2001 in the Lemmatized Topic of SCI
Source: Thomson Reuters Web of Science Topic search: supply chain integration (lemmatized) on 2011.11.17.
The most quoted article considering the number of citations up to now (exceeding 1000) is about the bullwhip effect (Lee et al., 1997) - an amplifi cation of information distortion when moving from downstream to upstream companies.
Even though this article is not explicitly about supply chain integration, information sharing is crucial in both instances; for both SCI and the bullwhip effect are about coordination.
The second most cited article (Lambert and Cooper, 2000) demonstrates the importance of cross-functional integration via marketing with examples of several cases. Being the third most cited, Frohlich and Westbrook’s (2001) paper – referred to as the FW paper from now on - introducing the concept of ’arcs of integration’
also acts as a trigger point for the fl ourishing SCI literature, especially in the Journal of Operations Management.
Empirical and straightforward enough, the article has had an astounding career with over 257 independent citations - and still growing (T. Reuters Web of Science on 2011.11.17.). The high number of citations earns the article fi rst place in the 2001 period and the period afterwards, proving it to be a true trigger point and an inspiration for articles published later on.
The key to FW’s success is probably their simple and elegant model – arcs of integration- used to categorize the different integration strategies of companies, where there are associations with better performance by those attaining more successful peer-to-peer relations (Frohlich and Westbrook, 2001).
The journals with the highest impact factor provide the published paper with a certain prestige - and some might yield to the temptation of superfi cially citing these results. We have checked this assumption by skim-reading the cited parts referring to FW (2001) in 87 articles from the topic of Operations Management (Thomson Reuters Web of Knowledge on 2011.06.12.); and we have found that from 102 overall citation spots in 40 different articles, 16 are in-depth, which may well show that most of the papers have not necessarily been critical enough in scientifi c terms. Because the number of citations/year has been rising (8 in 2002 and 45 in 2010) we need convincing via scientifi c means that the arcs of integration fi ndings are still valid - or, if not, they can be validated with some extensions.
The second most cited paper after 2001 (Subramani, 2004) has 173 references in Reuters Web of Science (2011.11.17.). The paper weighs the costs and benefi ts of Supply Chain Management Systems not from the perspective of central, network-leading companies, but from that of the supplier. This paper displays a shift from the perspective of the focal fi rm presented in FW (2001) to that of other parties in the chain. We continue our review with papers published in JOM, as an aftermath of the FW (2001) article, having found more than 50 papers from JOM on the topic of SCI; yet we also provide some insights from rival journals. The review considers a time span of JOM publications, fi nishing with an extended
cross validation paper on the original model (Schoenherr and Swink, 2011).
Pagell (2004) very succinctly summarized the core issue in SCI: “In its essence the entire concept of supply chain management is really predicated on integration.”
Integration is sometimes used as a synonym for supply chain coordination, and in this case it is somehow rather trivial for managers to hear that better coordination will lead to better company performance. Science is always about the details, in our case the understanding of underlying theory, company practices and the environment or context we are facing. The viewpoint is also important: almost all survey-based papers concentrate on one company, and not on a group or network of companies - with one of the few exceptions being a paper by Lanier et al (2010).
More than half of papers published in JOM about SCI are qualitative in nature and based on psychometric questionnaires – Likert-type scales – answered by senior managers (e.g. Frohlich and Westbrook, 2001, 2002; Vickery et al., 2003). The second group of articles is based on single or multiple case studies and simulations (e.g. Sahin and Robinson, 2005; Blackhurst et al., 2005; Lockström et al., 2010), and the last is based on secondary data analyses of external data sources (e.g. Lanier Jr. et al., 2010; Dehning et al., 2007). Each of the previously mentioned scientifi c methods has virtues and limitations, but there is a need for secondary data analysis in operations management (Lanier et al., 2010; Boyer and Swink, 2008; Roth, 2007; Fisher, 2007) to balance the methods used. The replication and extension of existing qualitative research papers may be a solution to this problem.
Internal processes and external connections are linked, and the FW article is intuitive in the way that it was the fi rst to provide empirical proof of some observations on strategy, i.e. that upstream and downstream broad integration is benefi cial to a company’s performance. Yet it doesn’t analyze the internal integration conditions had by the focus company. Proof of a general belief or theory is disputable because it derives from a purposely biased sample of 322 (702) companies. The benefi t of the article is that it made a connection between the basics of supply chain integration and company performance. The following papers give evidence of the rich potential in context that might be incorporated into present and future research.
There has been a three-way extension to FW fi ndings, fi rst by the introducing of a new supply chain integration intensity construct; second, via including mediating variables for the manufacturing capacities of fi rms; and, third, by testing the hypothesis on a sample of consumer product manufacturers – industrial product manufacturers with FW 2001 data (Rosenzweig et al., 2003). The SCI intensity construct can provide ways of obtaining broader generalisability. The relationship between an outward facing supply chain and
customer satisfaction is not direct, as suggested by FW (2001), but is indirect.
Pagell (2004) built a model for the enablers of internal integration acting between operations, purchasing and logistics; he reported that proximity is a key driver here, especially with informal communication (Pagell, 2004).
Production information integration (Devaraj et al., 2007) is sharing information about production planning and scheduling, and it acts as a mediator of the effects of eBusiness adoption on company performance. Researchers also demonstrate empirical proof that it is best to develop supplier integration before customer integration, and not vice-versa (Devaraj et al., 2007). The positive effects of Information Technology (IT) on Supply Chain Integration and company performance have also been proven not only by qualitative analysis (Frohlich and Westbrook, 2002; Power and Singh, 2007) but also in quantitative terms (Dehning et al., 2007).
The information absorbing capacity of an integrated network of companies is much greater than that of a single fi rm. Selecting suppliers based on their new product development capabilities is important in a competitive environment (Koufteros et al., 2007).
A rare paper about the effects of SCI in the case of services - others are mainly manufacturing – gives evidence that integration has an important role to play in Business Process Outsourcing (BPO), based on a survey of 205 Indian service providers (Narayanan et al., 2011).
There is evidence of a difference between smaller upstream SMEs and larger downstream businesses in terms of SCI. Perceived benefi ts, organizational readiness and external pressures infl uence an SME’s eBusiness strategy adoption and also enable chain integration decision-making. This study - Harland et al., 2007 - goes beyond focal fi rm survey methodologies, and considers entire chains. Suitable and not extensive integration per se is the key to better performance (Das et al., 2006 - cited in Harland et al., 2007). It is the missing “push” from customers that makes most SMEs uninterested in SCI and eBusiness adoption.
A further fi nding supports the context-based view of SCI. Supply chain integration in China is infl uenced by the power and relationship commitment of participating companies. Customer power and relationship commitment act as antecedents to SC integration (Zhao et al., 2008), proving that the cultural context - the national economy - is still acting on SCI in the age of globalization. The main aspects of the Chinese institutional environment are (Cai et al., 2010) legal protection, government support and the importance of guanxi. Trust and information sharing are positively affected by the existing institutional environment, and these act as
enablers of supply chain information integration. The institutional environment is unique with every country - so, for example, in Germany trade associations are stronger, while in China it is guanxi (Cai et al., 2010).
Formal control and integration – cross-functional or internal integration based more on human interactions – reduces process variability thus enabling better fi nancial performance; yet the marginal effect depends on the context, namely demand variability. For if demand variability is high, then cross functional integration outruns formal control. Otherwise, formal control might perform just as well (Germain et al., 2008).
A recent empirical study (Hendricks et al. 2009) – based on a sample of 307 supply chain disruptions announced by publicly traded firms during 1987–1998 – shows that firms with a high degree of vertical relatedness (a.k.a. integration) experience a less negative stock market reaction. Vertical relatedness gives greater control within the extended supply chain and permits faster recovery after a disruption (Hendricks et al., 2009).
Braunscheidel and Suresh (2009) defi ne a fi rm’s supply chain agility (FSCA) as its ability to adapt in a timely manner to marketplace changes, both internally and in conjunction with partners. External integration with key suppliers and customers was seen to be the strongest predictor of a firm’s supply chain agility, and internal integration had the third greatest effect. This may mean that beyond performance improvements as proven by Frohlich and Westbrook (2001), risk is also mitigated at the same time, thus leading to even greater successes.
Researchers tested the contingency effects of environmental uncertainty (EU) on the relationships among three dimensions of supply chain integration and four dimensions of operational performance (Wong et al., 2010), based on survey responses from 151 Thai automotive companies. They found that the impact of SCI on operational performance is statistically signifi cant and EU has a moderating effect on all three aspects of integration, i.e. internal, supplier and customer integration.
The research was built on Contingency Theory (CT) and Organizational Information Processing Theory (OIPT) to explain the effects of environmental uncertainty. CT states that the performance of the individual fi rm is infl uenced by the “fi t” between a fi rm’s processes, structures and the environment. Sousa and Voss (2008) suggested that “when the value of a best practice, such as SCI, is supported by empirical evidence, research should shift from justification of its value to getting to understand the contextual conditions under which it is effective.”
(Wong et al., 2010)
Critical examinations of Supply Chain Integration (SCI) literature (Van der Vaart and Van Donk, 2008; Costes and Jahre, 2008) have shown that the layers, direction, forms and practices captured in the constructs are so different that there is a need for a common denominator, a need for a coherent theory of Supply Chain Integration (SCI).
Based on survey responses from 403 companies, the resource-based view of the fi rm (RBV) and the information processing theory, Schoenherr and Swink, 2011) cross-validated the original fi ndings of Frohlich and Westbrook (2001). The main extension to the original article is the inclusion of internal integration as a moderating effect; though this validation was only of the methods and was not true for a sample validation of the model.
The fi ndings in different papers are mostly consistent with the Frohlich and Westbrook (2001) article’s arc of integration concept – the broader arc leads to better fi rm performance – which may be due to the robustness of the results or perhaps some common acceptance without any attempt at falsifi cation. Endogenity is a serious limitation with all papers because even if relationships do truly infl uence performance, we cannot rule out that performance has an effect on long- term relationships (Lanier et al., 2010).
Replication with Extensions
We must assume that OM research has to contribute to the designing of new operating procedures. Van Aken (2004; 2005) sees Management theory as a design science - and distinguishes it from Organization theory, which is an explanatory science. The concepts developed in Organization theory may be “interesting” and may help improve understanding of what is going on, yet their use in practice is limited. Management theory, being a design science, has to lead to valid and useful technological rules. In our view, Operations Management belongs with Management theory and has to follow such instrumental technological rules (Vastag and Wijngaard, 2005).
A research result for a context with specifi c characteristics may be transferable to a situation with a different context by redesigning that context – that is, it shouldn’t be regarded as given. It is not necessary to have research results for all imaginable contexts - which is one of the basic arguments for replications with extension.
Frohlich, coauthor of the original paper, also acknowledges the importance of
replication in theory-building, as he states that nothing can be proven or disproved entirely, and there is a need for falsifi cation and duplication (Frohlich and Dixon, 2001).
In order to investigate and understand the connection of SCI with company performance, the construct of SCI fi rst has to be robust when set against sampling differences. We shall use a multi-item analysis to get to understand the structure of Supply Chain Integration as it was measured by the multi-item scales in IMSS II (1996).
The analysis bases itself on the original dataset (IMSS II) that was used in the FW article, but since it was based on a questionnaire where the questions were measured on a psychometric scale we will assume that multi-dimensional scaling (MDS) is a better statistical method with which to create supply chain integration strategies than a factor analysis, which is designed mainly for linear variables.
MDS was developed for psychometric analyses (Borg and Groenen, 1997), thus it can be of great service in developing measures for supply chain integration based on survey answers from managers. MDS works on the basis of differences between measurements, which can be calculated based on the Euclidean Alscal SPSS method or manually through a transformation of the correlation matrix – (r+1)/2. The idea is to reproduce the order of differences at a lower dimension (2D, 3D), and with low error. MDS is robust against sampling and data collection problems because it reproduces the order, and not specifi c values.
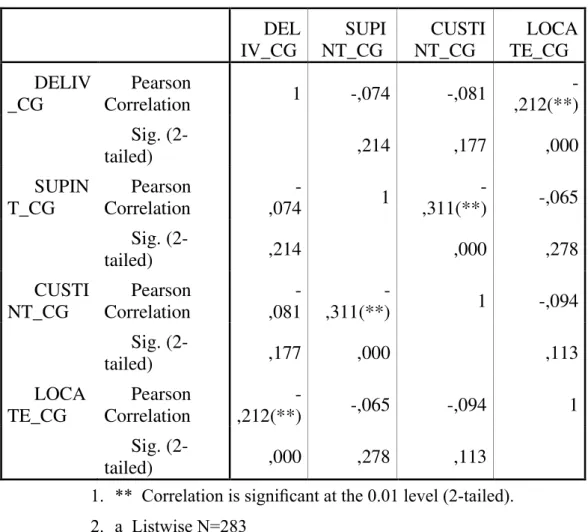
Using MDS, we can see that the different integration measures can be grouped into four signifi cantly different integration measurement groups, namely:
Delivery frequency from the supplier or to the customer -
Joint plant location with the supplier or the customer -
Integration of internal activities with the supplier -
Integration of internal activities with the customer -
Figure 3. Strategic Groups Based on MDS
Euclidean distance model
Source: Sample from IMSS II. 1996 dataset, with the Lock-in effect and average effect removed; SPSS Alscal Euclidean distances
We include only 6 integration measures out of the possible 13 integration measures of the IMSS II database since only such data was available from a more recent IMSS survey. Cross-validation shows us that the grouping developed on the basis of the 1996 data structure performed well in a discriminant analysis in relation to group classifi cation in the 2008 dataset (82.9% of originally grouped cases were correctly classifi ed).
The robustness of the groups over time also implies that including further variables in surveys conducted later on doesn’t alter the underlying structure of SCI. We ran MDS on subsamples of countries, to test for differences, and although our results are limited by the small country samples (30 to 60 observations) we found that the differences between countries are larger than differences for the same country over time (1996 vs. 2008) and on a different sample (Figure 4.).
Figure 4. The Difference between the Three Countries in Cross Section is Larger than Within the Same Country, over Time
Source: IMSS II (1996), IMSS V (2008)
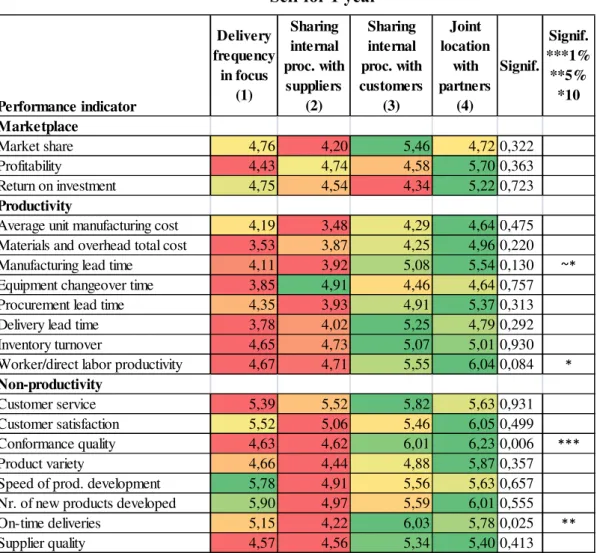
Since the correlation between these groups is minimal and less signifi cant, we can assume that these groups take on board the sphere of integration measurements well, as can be seen from the data in Figure 5 and the MDS graphical representations – in MDS the result is best if the dots take a form close to a circle, without dots in the axis intersection, because in the latter case a further dimension would be needed for a good structural representation.
Hungary Stress=0,07552; RSQ=0,96953
1996 2008
Hungary Stress=0,11666; RSQ=0,93136
Netherlands: Stress=0,08188; RSQ=0,97122
China : Stress=0,05532; RSQ=0,98911
Netherlands: Stress=0,07389; RSQ=0,97302
China: Stress=0,11522; RSQ=0,91689
Figure 5. Correlations between New Strategic Group Centres
** Correlation is signifi cant at the 0.01 level (2-tailed).
1.
a Listwise N=283 2.
Source: IMSS II., 1996
With the use of any statistical data compressing method, be it PCA2 or MDS, for fi nding the underlying structure we cannot group the observations afterwards as a few dimensions have already been lost during the process. This implies that the original observations need to be grouped based on the revealed structure.
After forming the four new supply chain integration strategies we created group averages, and calculated the differences in observations from these group centroids.
Based on the biggest difference of distances of observations from the group
2 Principal Component Analysis, or Factor Analysis as most commonly used in the literature, also in FW(2001)
DEL IV_CG
SUPI NT_CG
CUSTI NT_CG
LOCA TE_CG DELIV
_CG
Pearson
Correlation 1 -,074 -,081 -
,212(**)
Sig. (2-
tailed) ,214 ,177 ,000
SUPIN T_CG
Pearson Correlation
-
,074 1 -
,311(**) -,065
Sig. (2-
tailed) ,214 ,000 ,278
CUSTI NT_CG
Pearson Correlation
- ,081
-
,311(**) 1 -,094
Sig. (2-
tailed) ,177 ,000 ,113
LOCA TE_CG
Pearson Correlation
-
,212(**) -,065 -,094 1
Sig. (2-
tailed) ,000 ,278 ,113
averages, we are able to assign each observation to one of these four groups and we can check the connection of these groups with their average company performance.
By running an ANOVA analysis on the supply chain integration strategies and company performances, we attained the following results, ones that are robust against sampling differences3, though only a few of them are signifi cant.
Figure 6. Mean Percentage (%) Change of Performance against Self for 1 year
Source: IMSS II (1996) full sample, controlled for Lock-in effect and average effect
3 The strict replication of FW(2001) proved that their grouping was sensitive to sampling differences
Performance indicator
Delivery frequency
in focus (1)
Sharing internal proc. with
suppliers (2)
Sharing internal proc. with customers
(3)
Joint location
with partners
(4)
Signif.
Signif.
***1%
**5%
*10 Marketplace
Market share 4,76 4,20 5,46 4,72 0,322
Profitability 4,43 4,74 4,58 5,70 0,363
Return on investment 4,75 4,54 4,34 5,22 0,723
Productivity
Average unit manufacturing cost 4,19 3,48 4,29 4,64 0,475 Materials and overhead total cost 3,53 3,87 4,25 4,96 0,220
Manufacturing lead time 4,11 3,92 5,08 5,54 0,130 ΕΎ
Equipment changeover time 3,85 4,91 4,46 4,64 0,757
Procurement lead time 4,35 3,93 4,91 5,37 0,313
Delivery lead time 3,78 4,02 5,25 4,79 0,292
Inventory turnover 4,65 4,73 5,07 5,01 0,930
Worker/direct labor productivity 4,67 4,71 5,55 6,04 0,084 Ύ Non-productivity
Customer service 5,39 5,52 5,82 5,63 0,931
Customer satisfaction 5,52 5,06 5,46 6,05 0,499
Conformance quality 4,63 4,62 6,01 6,23 0,006 ΎΎΎ
Product variety 4,66 4,44 4,88 5,87 0,357
Speed of prod. development 5,78 4,91 5,56 5,63 0,657
Nr. of new products developed 5,90 4,97 5,59 6,01 0,555
On-time deliveries 5,15 4,22 6,03 5,78 0,025 ΎΎ
Supplier quality 4,57 4,56 5,34 5,40 0,413
As the forming of integration strategies is different from the groupings in the original FW article, we cannot make analysis-based conclusions in the same way, for each supply chain integration strategy leads to an increase in some company performance - thus, a general supply chain strategy cannot be pointed to.
The underlying grouping of variables found with the help of MDS proves the viability of the context-based view, with each group having a specifi c context (e.g.
proximity/location, delivery frequency). The grouping is robust over time in terms of a group classifi cation based on initial integration measures, yet the differences in performance for the four groups are statistically non-signifi cant.
The performance measurements had to be recoded into ranges and we had to convert them into a three-year period in the case of IMSS II to make them comparable with IMSS V data. New results from the ANOVA analysis for the IMSS II (1996) data show that our fi rst results are robust, and even profi tability and return on investment got closer to becoming signifi cant (at a level of 25%).
We cross-validated our results using the 2008 (IMSS V) dataset and found that the difference between groups is even more signifi cant cases of the following performance measurements: Delivery lead time, Worker/direct labor productivity, Conformance quality and On-time deliveries. This shows us that SCI has a direct effect on the operational performance of companies, which is robust over time and in relation to sampling differences.
The results for fi nancial and market performance are not conclusive over time and with sampling/scaling; and the link is not strong enough possibly because of the infl uence of mediating, context-based variables. We were unable to compare the ANOVA results of the three countries - China, Hungary and the Netherlands - for the same dataset and over time because Chinese performance measurements were missing for 1996 and the samples/country were too small for statistically signifi cant results.
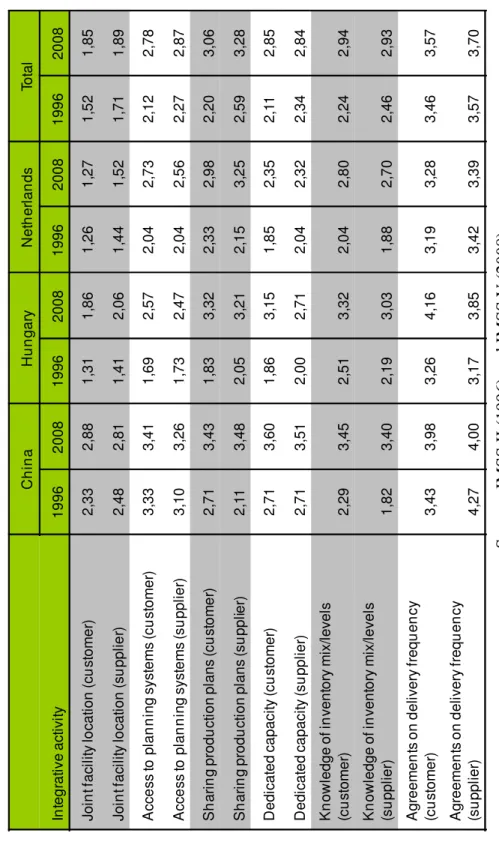
Due to the limited number of observations per country (Hungary, Netherlands, China) we could not run ANOVA analyses, yet we did come up with a crosstabs table of integration measurements per country for the two time frames (1996, 2008). The results, in Figure 7, show that China scores higher on average than the other two, European countries. This might be due to the fact that respondents introduced a cultural bias – as acknowledged by IMSS members at a meeting at Budapest. In China, managers try to conform to high expectations, thus giving higher points on Likert scales for integration measurements.
The other pattern in the data shows that companies tend to increase integration over time with customers and suppliers in relation to all listed measurements. The difference in average scores between Hungary and the Netherlands was lower in 2008, but country-specifi c items do remain - joint facility location is more important in Hungary, where the density of the infrastructure (e.g. motorways) is much lower than in the Dutch areas.
Figure 7. How the Importance of Integration Activities Changed between 1996 and 2008 in China, Hungary and the Netherlands Source: IMSS II (1996) and IMSS V (2008)
ChinaHungaryNetherlandsTotal Integrative activity19962008199620081996200819962008 Joint facility location (customer)2,332,881,311,861,261,271,521,85 Joint facility location (supplier)2,482,811,412,061,441,521,711,89 Access to planning systems (customer)3,333,411,692,572,042,732,122,78 Access to planning systems (supplier)3,103,261,732,472,042,562,272,87 Sharing production plans (customer)2,713,431,833,322,332,982,203,06 Sharing production plans (supplier)2,113,482,053,212,153,252,593,28 Dedicated capacity (customer)2,713,601,863,151,852,352,112,85 Dedicated capacity (supplier)2,713,512,002,712,042,322,342,84 Knowledge of inventory mix/levels (customer)2,293,452,513,322,042,802,242,94 Knowledge of inventory mix/levels (supplier)1,823,402,193,031,882,702,462,93 Agreements on delivery frequency (customer)3,433,983,264,163,193,283,463,57 Agreements on delivery frequency (supplier)4,274,003,173,853,423,393,573,70
Our results have limitations because the datasets used are based on survey method, although by using multi-dimensional scaling (which is suitable for psychometric measurement analysis) we managed to control some of the biases introduced by respondents, with their specifi c backgrounds.
Conclusions and Further Research
As opposed to what was seen in FW (2001) results, we have demonstrated, using the same dataset, that SCI is not one-dimensional - it has an underlying structure of four groupings, namely: (1) delivery frequency focused; (2) sharing internal processes with suppliers; (3) sharing internal processes with buyers and (4) joint facility location with partners. These four groups prove to be contextual in the case of China, Hungary and the Netherlands; yet we have to do further tests on other countries and industries to fi nd out whether our results can be generalized or not. The difference between groups in terms of several performance measurements proved to be small, mostly statistically insignifi cant, but looking at the ANOVA table as crosstabs we can conclude that with this sample of companies those having joint location with their partners seem to outperform others.
There are rare opportunities for replication in Operations Management mainly because of the current practice of limited data sharing. This shows us that one should take advantage of these seemingly rare cases because even in one replication there is much potential to release genuine, new knowledge. Our current results are based on strict replications and also extensions, both in sample and methodology, though further tests are needed especially in relation to the connection between SCI and company performance as mediated by some contextual variables. The extension possibilities are numerous; and in future research we shall include internal integration proxies from the original dataset and other moderating variables controlling context.
References
Bagchi, P. K., Byoung- Chun, H., Skjoett-Larsen, T., Soerensen, L. B. (2005):
Supply chain integration: a European survey. The International Journal of Logistics Management 16(2): 275-294
Blackhurst, J., Wu, T., O’Grady, P. (2005): PCDM: a decision support modeling methodology for supply chain, product and process design decisions. Journal of Operations Management 23(3-4): 325-343
Borg, I., Groenen, P. (1997): Modern multidimensional scaling. Theory and applications. New York: Springer.
Braunscheidel, M.J., Suresh, N.C. (2009): The organizational antecedents of a fi rm’s supply chain agility for risk mitigation and response. Journal of Operations Management 27(2): 119-140.
Cai, S., Jun, M., Yang, Z. (2010): Implementing supply chain information integration in China: The role of institutional forces and trust. Journal of Operations Management 28(3): 257-268.
Dehning, B., Richardson, V. J., Zmud, R. W. (2007): The fi nancial performance effects of IT-based supply chain management systems in manufacturing fi rms.
Journal of Operations Management 25(4): 806-824.
Devaraj, S., Krajewski, L., Wei, J. C. (2007): Impact of eBusiness technologies on operational performance: The role of production information integration in the supply chain. Journal of Operations Management 25(6): 1199-1216.
Flynn, B. B., Huo, B., Zhao, X. (2010): The impact of supply chain integration on performance: A contingency and confi guration approach. Journal of Operations Management 28:58-71.
Forrester, J. W. (1968): Industrial Dynamics - After the First Decade. Management Science 14(7), Theory Series (Mar., 1968): 398-415.
Frohlich, M., Westbrook, R. (2001): Arcs of integration: an international study of supply chain strategies. Journal of Operations Management 19(2): 185-200.
Frohlich, M., Westbrook, R. (2002): Demand chain management in manufacturing and services: web-based integration, drivers and performance. Journal of Operations Management 20(6): 729-745.
Frohlich, M. T., Dixon, J. R. (2001): A taxonomy of manufacturing strategies revisited. Journal of Operations Management 19: 541-558.
Germain, R., Claycomb, C., Droge, C. (2008): Supply chain variability, organizational structure, and performance: The moderating effect of demand unpredictability. Journal of Operations Management 26(5): 557-570.
Hammainen H. (1991): Form-based approach to distributed cooperative work. Acta polytechnica Scandinavica – Mathematics and computer sciences series 58:
1-4.
Harland, C. M., Caldwell, N. D., Powell, P., Zheng, J. (2007): Barriers to supply chain information integration: SMEs adrift of eLands. Journal of Operations Management 25(6): 1234-1254.
Hendricks, K. B., Singhal, V. R., Zhang, R. (2009): The effect of operational slack, diversifi cation, and vertical relatedness on the stock market reaction to supply chain disruptions. Journal of Operations Management 27(3): 233-246.
Holland, C. P., Lockett, G., Richard, J. M., Blackman, I. D. (1994): The evolution of a global cash management system. Sloan Management Review 36(1): 37- 47.
Koufteros, X. A., Cheng, T. C. E., Lai, K. (2007): ”Black-box” and “gray-box”
supplier integration in product development: Antecedents, consequences and the moderating role of fi rm size. Journal of Operations Management 25(4):
847-870.
Lambert, D. M., Cooper, M. C. (2000): Issues in supply chain management.
Industrial Marketing Management 29(1): 65-83.
Lee, H. L., Padmanabhan, V., Whang, S. (1997): Information distortion in a supply chain: The bullwhip effect. Management Science 43(4): 546-558.
Narayanan, S., Jayaraman, V., Luo, Y., Swaminathan, J. M. (2011): The antecedents of process integration in business process outsourcing and its effect on fi rm performance. Journal of Operations Management 29(1-2): 3-16.
Pagell, M. (2004): Understanding the factors that enable and inhibit the integration of operations, purchasing and logistics. Journal of Operations Management 22(5): 459-487.
Power, D., Singh, P. (2007): The e-integration dilemma: The linkages between Internet technology application, trading partner relationships and structural change. Journal of Operations Management 25(6): 1292-1310.
Rosenzweig, E., Roth, A., Dean, J. (2003): The infl uence of an integration strategy on competitive capabilities and business performance: An exploratory study of
consumer products manufacturers. Journal of Operations Management 21(4):
437-456.
Sahin, F., Robinson Jr., E. P. (2005): Information sharing and coordination in make- to-order supply chains. Journal of Operations Management 23(6): 579-598.
Schoenherr, T., Swink, M. (2011): Revisiting the arcs of integration: Cross- validations and extensions. Journal of Operations Management, in Press.
Subramani, M. (2004): How do suppliers benefi t from information technology use in supply chain relationships? MIS Quarterly 28(1): 45-73.
Van Aken, J. E. (2004): Management research based on the paradigm of the design sciences: The quest for fi eld-tested and grounded technological rules. Journal of Management Studies 41: 219-246.
Van Aken, J. E. (2005): Management research as a design science: Articulating the research products of Mode 2 knowledge production in management. British Journal of Management 16: 19-36.
Van der Vaart, T., Van Donk, D. P. (2008): A critical review of survey-based research in supply chain integration. International Journal of Production Economics 111: 42–55.
Vastag, G., Wijngaard, J. (2005): What Do We Know? Taking Stock of Operations Management. 12th International EurOMA Conference on Operational and Global Competitiveness, June 19-22, 2005, Budapest.
Vickery, S., Jayaram, J., Droge, C., Calantone, R. (2003): The effects of an integrative supply chain strategy on customer service and fi nancial performance: an analysis of direct versus indirect relationships. Journal of Operations Management 21(5): 523-539.
Wong, C. Y., Boon-itt, S., Wong, C. W. Y. (2011): The contingency effects of environmental uncertainty on the relationship between supply chain integration and operational performance. Journal of Operations Management 29(6): 604- 615.
Zhao, X., Huo, B., Selen, W., Yeung, J. H. Y. (2011): The impact of internal integration and relationship commitment on external integration. Journal of Operations Management 29(1-2): 17-32.