INDIVIDUAL AND REGIONAL-LEVEL FACTORS CONTRIBUTING TO VARIATION IN LENGTH OF STAY AFTER CEREBRAL INFARCTION
IN SIX EUROPEAN COUNTRIES
MIKKO PELTOLAa,*, TIMO T. SEPPÄLÄa, ANTTI MALMIVAARAa, ÉVA BELICZAb, DINO NUMERATOc,d, FANNY GOUDEe, EILIDH FLETCHERf, RICHARD HEIJINKg
ON BEHALF OF THE EUROHOPE STUDY GROUP
aCentre for Health and Social Economics CHESS, National Institute for Health and Welfare, Helsinki, Finland
bSemmelweis University, Budapest, Hungary
cCentre for Research on Health and Social Care Management, Bocconi University, Milano, Italy
dDepartment of Sociology, Faculty of Social Sciences, Charles University, Prague, The Czech Republic
eMedical Management Centre, Karolinska Institutet, Stockholm, Sweden
fNational Health Services, Edinburgh, Scotland
gNational Institute for Public Health and the Environment, Bilthoven, The Netherlands
ABSTRACT
Using patient-level data for cerebral infarction cases in 2007, gathered from Finland, Hungary, Italy, the Netherlands, Scotland and Sweden, we studied the variation in risk-adjusted length of stay (LoS) of acute hospital care and 1-year mortality, both within and between countries. In addition, we analysed the variance of LoS and associations of selected regional-level factors with LoS and 1-year mortality after cerebral infarction. The data show that LoS distributions are surprisingly different across countries and that there is significant deviation in the risk-adjusted regional-level LoS in all of the countries studied. We used negative binomial regression to model the individual-level LoS, and random intercept models and ordinary least squares regression for the regional-level analysis of risk-adjusted LoS, variance of LoS, 1-year risk-adjusted mortality and crude mortality for a period of 31–365 days. The observed variations between regions and countries in both LoS and mortality were not fully explained by either patient-level or regional-level factors. The results indicate that there may exist potential for efficiency gains in acute hospital care of cerebral infarction and that healthcare managers could learn from best practices. Copyright © 2015 John Wiley & Sons, Ltd.
Received 28 February 2014; Revised 2 March 2015; Accepted 8 May 2015
KEY WORDS: cerebral infarction; length of stay; regional variation; Europe
1. INTRODUCTION
Cerebral infarction, caused by a blockage of an artery supplying blood to the brain, is a common cause of disability and mortality around the world (WHO, 2008). In addition to affecting the lives of the people suffering a cerebral infarction, it has a major impact on healthcare expenditure (Evers et al., 2004). The costs in the treatment of cerebral infarction mostly stem from inpatient care (Cadilhac et al., 2009; Rossnagel et al., 2005); the hospital costs have been shown to vary enormously (Luengo-Fernandezet al., 2009).
In the treatment of similar cases of cerebral infarction, the length of stay (LoS) should not vary considerably, and the LoS distributions between comparable units should hypothetically be similar. If there is much variation
*Correspondence to: Centre for Health and Social Economics CHESS, National Institute for Health and Welfare, Mannerheimintie 166, FI-00270 Helsinki, Finland. E-mail: mikko.peltola@thl.fi
in LoS between units, or if the LoS averages differ substantially, it raises the question whether the treatment is optimally managed in all units. For cerebral infarction, LoS is a strong indicator for the costs of treatment (Cipriano et al., 2009; Diringer et al., 1999; Saxena et al., 2006; Seitz and Edwardson, 1987). Therefore, any unwarranted upward variation in LoS also implies undesirable variation in costs and inefficient use of re- sources. In addition, it raises concerns about the quality of care (Ingemanet al., 2011; Svendsenet al., 2009), besides having important implications for health policy, because providing orfinancing of stroke services may need to be adjusted to improve the outcomes of stroke care.
We analysed the association of selected regional-level factors with risk-adjusted LoS and variance in LoS, taking into account the effort that healthcare systems put into treating the patients in six European countries (Finland, Hungary, Italy, the Netherlands, Scotland and Sweden). In addition, we examined the impact that the same regional-level characteristics have on risk-adjusted 1-year mortality after cerebral infarction, control- ling for the average and variance of LoS and the effort of the healthcare system. As an important distinction from previous studies and a significant contribution to analysing LoS, we were able to merge all consecutive hospital stays in the patient-level data and analyse discontinuous acute hospital care across organisational boundaries. Furthermore, to our knowledge, this is thefirst study ever to analyse entire populations of patients across countries using register data linked at the individual-level with a focus on regional-level analysis. If regional-level factors associated with resource use and quality of care were identified, this might assist in improving the performance of the healthcare system.
To construct the hypotheses, we built a model that is reminiscent of the model used by Martin and Smith (1996) and leans on empiricalfindings from Sposato and Saposnik (2012). The model captures the twofold character of LoS as being an indicator for quality of care (consistent hospitalisation times for patients with similar severity of cerebral infarction) and a measure for (technical) efficiency. It yields the following hypoth- eses: shorter LoSs are associated with greater economic wellbeing measured as gross domestic product (GDP) and lower effort-endogenising/adjusted 30-day case fatality.
2. THEORETICAL FRAMEWORK AND HYPOTHESES
If a health system (or region, hospital or stroke service unit) is productivity-oriented, it is very likely monitoring LoS and costs and aims to steer clinical activities to be more economical. Therefore, the more active the pursuit of productivity in the system, the lesser the differences in LoS distributions of homogeneous patients within the system ought to be. Similarly, the elaborations of Chalkley and Malcomson (1998, 2000) and Biorn et al.
(2003) reveal that when the system-level use of resources is well recognised, it should have an influence on the observed LoS.1
As indicated in the previous section, our model builds on Sposato and Saposnik (2012). They showed that a strong association between GDP and quality of primary prevention and acute care exists in the treatment of cerebral infarction. Furthermore, in relation to GDP, they found that the mean age of patients, 30-day case fatality and incident risk are good macro-level proxies for the quality of care. Adding to theirfindings, we also took into account the effort the system puts into treating the patient.
Let us assume that LoS is, at the regional level, a function of exogenous variablesXincorporating popula- tion density and case volume and endogenous variables Z incorporating average treatment quality (q), its uniformity measured as variance of LoS (v), concentration of cerebral infarction care in the region
1Although the treatment of cerebral infarction is not strictly standardised, there are both international and national guidelines that provide instructions for treatment (European Stroke Organisation (ESO) Executive Committee, ESO Writing Committee, 2008; Adamset al., 2007; European Stroke Initiative, 2000). These guidelines are used to a varying extent at hospitals (Donnellanet al., 2013), and the guide- lines may have varying emphases (Kernet al., 2013) that may be reflected in LoS.
(Herfindahl-Hirschman index,2 HHI) and existence of a primary or comprehensive stroke centre (CSC).3 Formally,LoS=f(X,Z) for some functionf.
Let us then consider treatment quality that has its effect at an individual level. Using findings from Sposato and Saposnik (2012), the following interrelationship should hold: q=q(a(G),m(G),r(G)), f′g<0, where age (a),case-fatality (m)and incident risk (r) are all associated with GDP (G), with the featuresa′>
0;m′G<0; r′<0 . Because it is apparent that m is also associated with the effort the system puts into treating a patient, we endogenise this into the model to arrive at m(G,e), m′e<0 and q=q(a(G),m(G,e), r(G)). We thus obtain the effort-adjusted 30-day case fatality, where the effort, (e), may be constructed as follows:
e¼∑Ni¼1μiti
30N þ∑Ni¼1ð1μiÞ
N ;
whereNis the number of cerebral infarction admissions for a 1-year interval,iis the index number of an indi- vidual,μiis an indicator variable for surviving for over 30 days from the admission (μi= 0 for survivors and μi= 1 for deceased within the 30-day time bracket) andtiis the survival time measured from the time of admis- sion. The effort is then constrained in the unity interval for everyiandN, and for effort-adjusted 30-day case fatality, it is weighted with the distance from the maximum level of effort. Formally,m=m(G,e) =F(G)(1e), whereF(G)is the 30-day case fatality.4Aggregation over hospitals in a specified area yields the average effort for that particular area.
Applying this model, we examined whether LoS is shorter in countries and regions where GDP or concen- tration of treatment of public provision is higher, variance of quality is lower or primary and CSC exist. More- over, because longer LoSs and their greater variation may be interpreted as indications of inefficiency, we examined whether within-area LoS variance and GDP are associated.
3. METHODS 3.1. Data
The approach used in this study is described in Häkkinenet al.(2013). Register data on hospital discharges, prescription drugs and mortality were acquired in the six participating European countries.5Using hospital dis- charge data, all patients admitted between 1 January 2007 and 31 December 2007 because of stroke subtypes of cerebral infarction (WHO International Classification of Diseases, 9th Edition, codes 433–434; 10th edition code I63), intracerebral haemorrhage (431; I61), subarachnoid haemorrhage (430; I60) or ill-defined stroke (436; I64) were identified. The hospital discharge records for the identified patients were gathered for the period 1 January 2006 and 31 December 2008, and continuous episodes of hospital care were constructed starting from the first admission (index admission) due to stroke in 2007 by combining all consecutive hospital dis- charges for each patient. Thefirst admissions of patients in 2007 that had not been preceded by any stroke sub- type admission in the 365 days before the index admission defined the starting, new stroke episodes of care in the study data.
Stroke subtypes were graded as follows (from most to least severe): subarachnoid haemorrhage, intracere- bral haemorrhage, cerebral infarction and ill-defined stroke. In the event a patient had many different stroke
2For a region, HHI was derived byfirst calculating the percentages of treated stroke patients at hospitals in the region and then squaring the percentages, and summing the squared percentages over the hospitals in the region. The regional HHIs were normalised into unity interval.
3For definitions of primary and comprehensive stroke centres, please see Albertset al.(2000) and Albertset al.(2005) .
4We thus map quality onto the LoS space with the caveat that while short LoS is in general a signal of good quality, it does not necessarily capture the whole truth when LoS falls short because of early mortality.
5The Italian data covered the inhabitants of the city of Turin and of the provinces in the Lazio region (Frosinone, Latina, Rieti, Roma and Viterbo).
subtypes or ill-defined stroke diagnoses during the episode of care, the most severe diagnosis was chosen as the stroke subtype characterising the episode of care. For this study, only the episodes characterised by cerebral infarction were included.
Patients were followed up for 365 days from the index admission for inpatient and outpatient care in hospitals, for medication purchases and for mortality. In addition, the hospital admissions and the purchases of prescribed medicines in the 365 days prior to the index admission were used in determining the comorbid diseases of the patients.
We measured the LoS in acute hospital care during the episode of care from the index day starting on the day of admission to the last day of acute hospital care during the continuous hospital care (LoS=T–t + 1, whereT is the last date in acute care andtis the index date). We defined acute hospital care as treatment given at an intensive care unit, on a stroke ward, on a neurological ward or in other acute care (all other medical and sur- gical specialties). In addition, we calculated the number of days in hospital during the entire follow-up year.
LoS was truncated at 365 days if the LoS was longer. In each country, patients with LoS of continuous hospital care longer than the 99th percentile, patients under 18 years of age, tourists, visitors and other residents with incomplete personal identification numbers were excluded.6
Regional-level risk-adjusted LoS indicators were constructed from the LoS predictions of individuals who were resident in the region (but might have been treated at a hospital in some other region). Predictions were based on coefficients of sex, age group and hospital inpatient days and comorbid diseases observed during the 365 days prior to the index admission, produced using a weighted negative binomial regression model with pooled Finnish, Hungarian, Italian and Swedish data. One-year mortality was similarly risk-adjusted, but with predictions stemming from logistic regression modelling on the pooled data. The comorbid diseases were de- termined according to the primary and secondary diagnoses in the hospital discharge records and the purchases of prescribed medication in the 365 days prior to thefirst cerebral infarction admission. In Scotland, comorbid- ities were defined only on the basis of the main and secondary diagnoses because of lack of data on prescribed medication. The comorbid diseases used in the risk adjustment and the methodology of risk adjustment for regional-level measurement of LoS were discussed in Häkkinenet al.(2013) and Moger and Peltola (2014), respectively. Malmivaaraet al.(2015) discussed the validity and quality of the EuroHOPE cerebral infarction stroke database in depth.
Regional-level data were acquired from the statistical database of the Organisation for Economic Co- Operation and Development (OECD), OECD.Stat (http://stats.oecd.org) and the national statistics authorities.
Four regions with fewer than 100 cerebral infarction cases in 2007 were excluded from the regional-level anal- yses. In addition, one region in Scotland was excluded because acute and non-acute care were not reliably distinguishable.
3.2. Analysis strategy
The individual-level data could not be pooled with all national data because of privacy legislation and data- sharing restrictions, and thus, the individual-level data were analysed by each partner with a common method- ology. The partners had a common Stata script that was used to produce all the individual-level analyses and results presented here. The regional-level results for risk-adjusted LoS and mortality as well as the variables describing regional-level characteristics were available to all partners.
3.2.1. Individual level.In addition to studying the associations of regional-level factors with LoS as stated ear- lier, we analysed the effects of patient-level characteristics on LoS available in the data for each country. We assumed that LoS was generated by a Poisson-like process, but with overdispersion. Thus, negative binomial regression was used to model the LoS at the individual level. Age, sex, comorbid diseases, number of inpatient days in the 365 days prior to the admission and admission weekday were included in the models as independent variables. The primary interest here was whether the independent variables had similar estimates in each
6In Italy, residents of the Lazio and Piedmont regions with an index admission outside their respective regions were excluded.
country or whether their sign or magnitude would differ. Statistical significance was evaluated at 0.05 level, and p-values less than 0.01 and 0.001 are also indicated in the tables with asterisks.
3.2.2. Regional level.Regional-level analyses were carried out by pooling the regional data from all countries.
We performed four different estimations, because at the regional level, the study had four dependent variables (risk-adjusted LoS, LoS variance, risk-adjusted 1-year mortality and crude mortality between 31 and 365 days after cerebral infarction). GDP per capita (EUR 1000), population density, HHI (for concentration of cerebral infarction care in the region), number of cerebral infarction cases per 100 000 inhabitants and the effort were used in all models as continuous independent variables.
Barro (2013) clearly described the well-known interrelationship between GDP and health. People having higher education seek to reside in economically active areas, and therefore, people with a higher educational attainment congregate in regions with a higher GDP. They also have a higher awareness of health. Thus, areas having a higher GDP may be assumed to have shorter LoSs. Shorter LOSs for regions having a higher GDP are also due to the positive association between GDP and efficiency (Bodenheimer, 2005; Varabyova and Schreyögg, 2013). GDP works as a proxy for efficiency-seeking markets and hence for shorter LoSs. Thus, it may be assumed that we should find shorter LOSs as a function of a higher GDP, as a high GDP requires greater efficiency.
A novelty in our study is that we included the effort as an explanatory variable in the model. In principle, the effort is meant to be taken as life-preserving, that is, the more complex the patient, the more effort is needed to maintain life. Hence, if a patient dies after a short LoS, it is considered an indication of low effort and vice versa. Because patient mix does not vary vastly between subsequent years, and to avoid the endogeneity in our explanatory model, the effort for the regions was calculated with cerebral infarction cases from 2006.
Country dummies (effects shown for each country as a comparison with the grand mean) and an indicator for the existence of either a primary or a CSC in the region were included in all models. We expected that a well-developed infrastructure and skilled personnel at primary and CSC would reduce the average LoS and its variance. As hypothesised earlier, we included risk-adjusted LoS and the variance of LoS in both models estimating mortality.
First, for each dependent variable, an intra-class correlation (ICC) based on estimates of random effects analyses of variance (ANOVA) was utilised to determine the portion of variance that was due to cross-country differences as compared with regional differences. Then, estimations for each dependent variable were per- formed with a random intercept model (mixed-effects maximum likelihood regression), using the explanatory variables described earlier. If the random intercept model did not show evidence of variation in the intercepts according to the likelihood ratio (LR) test, ordinary least squares regression was used. In the study, the main interest was on thefixed part of the model, that is, the effects that the explanatory variables have on the response.
If there appeared to be clustering in the data, we considered it as a nuisance that prevented us fromfitting a single-level regression model.
Patients can be nested within hospitals and regions. Because the whole study data could not be pooled at the patient level, this hierarchical structure could not be accounted for. However, we pooled the individual-level data from Finland, Hungary, Italy and Sweden and estimated hierarchical models as a check of robustness.
4. RESULTS
The number of patients with cerebral infarction included in the study ranged from 3591 (Scotland) to 34 148 (Hungary). Table I summarises the characteristics of these patients in each country in 2007. Regarding age, sex, comorbid diseases and LoS in hospital inpatient care in the 365 days prior to cerebral infarction admission, the patient characteristics appear to be rather similar across the countries.
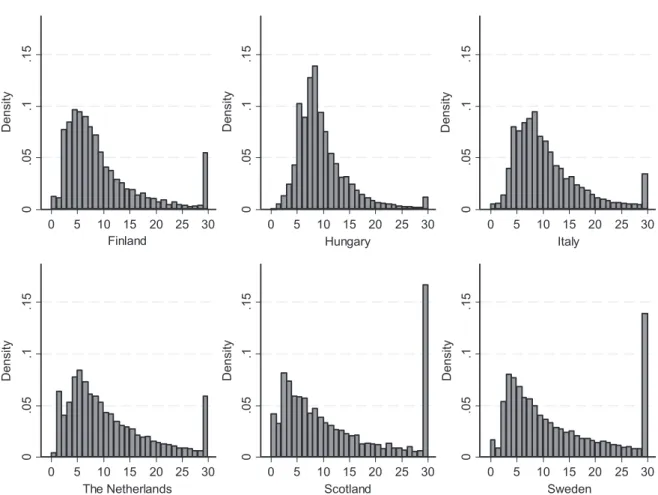
The distribution of LoS in acute hospital care after cerebral infarction in the six European countries studied is shown in Figure 1, with LoS values of over 30 days truncated at 30 days. The LoS distributions show
TableI.CharacteristicsofcerebralinfarctionpatientsandtheirlengthofstayandmortalityinsixEuropeancountriesin2007 FinlandHungaryItalyNetherlandsScotlanda Sweden N(Avg)%(SD)N(Avg)%(SD)N(Avg)%(SD)N(Avg)%(SD)N(Avg)%(SD)N(Avg)%(SD) Patientcharacteristics Npatients(%)873510034148100902410012263100359110019065100 Female(%)429349.11789652.4407145.1590648.161189352.7941349.4 Age,avg(SD)72.612.469.511.973.811.071.613.072.913.276.211.7 Agegroups 18–54years7258.3425712.55235.8139811.43519.89515.0 55–64years135915.6676519.899011.0191015.648113.4225611.8 65–74years224525.7991529.0272730.2306525.088724.7388620.4 75–84years300034.31034630.3346738.4406533.1119333.2697636.6 85years140616.128658.4131714.6182514.967918.9499626.2 Admissionweekday Sunday106912.229258.68699.6142711.647213.1230212.1 Monday142616.3677119.8159217.6207016.959716.6318416.7 Tuesday133015.2570516.7138715.4196816.054215.1291015.3 Wednesday135115.5558416.4137815.3191615.653214.8290115.2 Thursday129214.8501814.7126914.1178414.552814.7284014.9 Friday123614.1488914.3129914.4177414.549613.8271814.3 Saturday103111.832569.5123013.6132410.842411.8221011.6 Comorbiddiseases Hypertension619570.92611576.5590365.4947377.23028.41340570.3 Coronaryarterydisease8669.9452613.36246.94453.63048.515258.0 Atrialfibrillation7979.115504.53353.73312.72256.317179.0 Cardiacinsufficiency4465.115734.62512.82141.7962.710595.6 Diabetes174620.0740521.7209223.2240219.61845.1320016.8 Cancer5556.49872.91942.14533.72517.06083.2 COPDandasthma113413.0509214.9158917.6236319.31584.4209211.0 Dementia4365.09722.81171.31611.3501.45943.1 Depression126214.4521715.3101911.3189215.4140.4340917.9 Parkinson’sdisease1191.413854.11822.02161.8120.33942.1 Lengthofstay Previousyear4.610.54.910.52.48.13.09.46.417.14.612.1 Firsthospitalepisode10.514.49.45.510.88.210.514.416.325.314.715.3 Firstyear19.029.925.132.511.917.819.029.930.538.622.723.0 Mortality 30-daymortality8689.9440812.96647.4142711.648513.5210311.0 One-yearmortality176220.2849724.9143515.9269322.0102928.7451223.7 aForScotland,thecomorbiditiesaredefinedonlyonthebasisoftheprimaryandsecondarydiagnosesbecauseoflackofdataonprescribedmedication.
remarkable differences between countries. In Hungary, the LoS was highly concentrated around the mean value of 9.4 days. In Sweden, more than 10% of the patients had an LoS equal to or greater than 30 days, and in Scotland, around 15%.
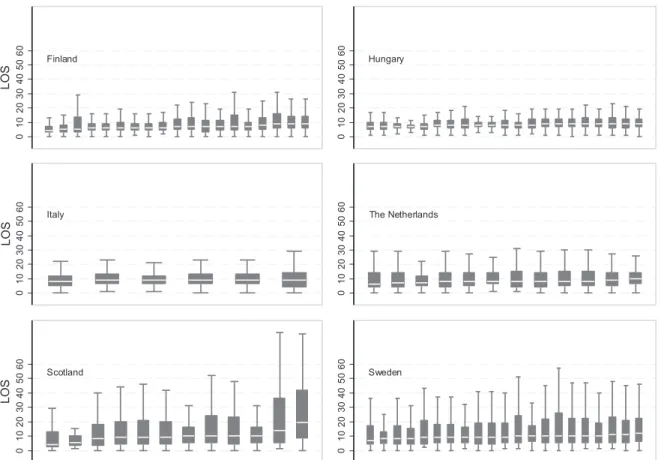
The distributions of LoS within regions in each country are shown on a boxplot graph (Figure 2). Arranged in ascending order of the median value of LoS in the region, thefigure shows variation in LoS distribution among cerebral infarction patients between regions in all the countries. The regional-level characteristics are displayed in Table II. The risk-adjusted regional LoS and 1-year mortality with 95% confidence intervals, shown in Figure 3, both show variation similar to that of the unadjusted LoS.
The results of the country-specific negative binomial regression models are shown in Table III. It should first be noted that the models explained very little of the variation in LoS. There were differences between countries in the sign and magnitude of the estimated coefficients. In Hungary, the Netherlands, Scotland and Sweden, the youngest age group had the shortest LoS, and the LoS was gradually increasing with age in these countries. Contrary to this, in Finland, the oldest patients had the shortest LoS. Gender was statistically significant (p<0.001) in Italy and Sweden, with men having a shorter LoS than women. Hun- gary was the only country where the weekday of admittance showed statistically significant associations with LoS. Compared with admission on Sunday, patients admitted on weekdays from Monday to Thursday had LoS that was statistically significantly shorter (p<0.001). For example, the expected LoS for an admis- sion on Monday was 89% (exp(0.114)) of the LoS of admission on Sunday, holding the other variables
Figure 1. Distribution of length of stay in acute hospital treatment after cerebral infarction in six European countries (length of stay values of over 30 days truncated at 30 days)
constant in the model. In other countries, there were no significant differences in LoS between admission weekdays.
According to random effects ANOVA and ICC, 59% of the variance in risk-adjusted LoS was due to differ- ences across countries, with the remaining 41% attributable to regional differences. For variance of LoS, risk- adjusted 1-year mortality and crude mortality between 31 and 365 days, these shares were 57% and 43%, 83%
and 17% and 51% and 49%, respectively. The random effects ANOVA showed variation in the country-level intercepts, as the LR test gave values of 38.64 (halvedp= 0.00), 30.28 (halvedp= 0.00), 72.96 (halvedp= 0.00) and 15.45 (halved p= 0.00), respectively. Therefore, the modelling was performed with a random intercept model for all four responses.
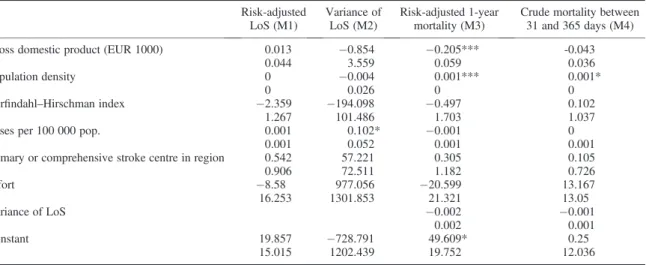
Regional-level average risk-adjusted LoS was not statistically significantly associated with GDP or effort, the factors of primary interest in the present study (Table IV). In the model for risk-adjusted 1-year mortality, both GDP (p<0.001) and effort were negatively associated with mortality. An EUR 1000 increase in GDP was estimated to lower risk-adjusted 1-year mortality by 0.2 percentage points. Interestingly, LoS variance was not associated with mortality. Effort, HHI and the existence of a primary or CSC in the region did not correlate significantly with the responses in any of the models.
As a check of robustness, we ran hierarchical models with individual-level pooled data of Finland, Hun- gary, Italy and Sweden including 64 regions, with 70 686 patients. Table V shows the estimated coeffi- cients and their standard errors from fitting a regional-level random intercept model on risk-adjusted LoS and risk-adjusted 1-year mortality, and from fitting a hierarchical negative binomial regression model on LoS and a hierarchical logistic regression on 1-year mortality on the patient level. The hierarchical models
Figure 2. Region-specific boxplots of length of stay in acute hospital treatment after cerebral infarction in six European countries (outside values excluded, median ordered)
with three levels (patient, hospital and region) failed to converge, and therefore, only two levels (patient and region) were included.
5. DISCUSSION
The data showed remarkable variations in LoS, even after accounting for patient characteristics and comorbid diseases. Similarly, variance of LoS as well as 1-year mortality after cerebral infarction showed both regional- level and national-level variations. As the individual-level estimations indicate, the basic set of patient-level characteristics used in the models explained very little of the individual-level variation in LoS. At the national level, we found that the variation in LoS within regions in countries is remarkable and that countries also show different patterns of LoS for cerebral infarction patients. Contrary to our expectations, GDP per capita was not statistically significantly associated with LoS and the variance of LoS at the regional level. Neither GDP, population density, HHI for the concentration of care, availability of a primary or CSC in a region nor effort was statistically significantly associated with either LoS or variance of LoS. GDP and population density were found to contribute significantly to risk-adjusted 1-year mortality after cerebral infarction in the regions. This finding confirms the link between GDP and mortality after cerebral infarction and shows that the results of Sposato and Saposnik (2012) are valid at the regional level as well. Many studies have shown that primary and comprehensive stroke units have lower mortality (Sunet al., 2013), but thisfinding was not replicated in this regional-level analysis.
At the national level, benchmarking of healthcare providers has become increasingly common (Oderkirk et al., 2013). For European stroke care strategies, clear goals were set in the Helsingborg declaration for the treatment of cerebral infarction, including establishing the means to monitor continuously the quality of care through indicators for process, structures and outcomes by the year 2015 (Kjellstromet al., 2007). There have been a number of studies that have compared the performance of hospitals or units in caring for cerebrovascular
Table II. Regional-level characteristics in 2007
Finland Hungary Italy
Netherlands
Mean IQR Mean IQR Mean IQR Mean
Independent variables
Number of regions (N) 18 20 6 12
Population density (inhabitants/km2)
62 13–35 248 75–99 1379 86–757 494
Gross domestic product per capita (EUR)
29 811 26 233–32 066 14 562 11 448–16 318 27 263 24 834–31 283 35 762 Herfindahl–Hirschman Index 0.75 0.61–0.93 0.37 0.30–0.44 0.22 0.08–0.34 0.23 Cerebral infarction cases/100 000
inhabitants
579 486–665 296 249–331 802 601–829 1613
Regions with no primary or comprehensive stoke centre (N)
6 0 2 0
Effort (2006) 0.96 0.95–0.96 0.93 0.92–0.94 0.96 0.95–0.97 0.93
Dependent variables
LoS (days) 10.4 8.3–11.7 9.3 8.6–10.1 10.8 10.6–11.0 10.7
LoS (days), risk-adjusted (M1) 10.4 8.5–11.7 9.6 8.9–10.3 10.8 10.8–11.0 10.9 LoS (days),
variance (M2)
203 100–256 28.0 21–32 64 56–63 83
One-year mortality (%) 20.5 18.7–23.4 25.2 23.7–26.1 15.5 12.4–18.2 21.6
One-year mortality (%), risk-adjusted (M3)
19.3 18.1–21.0 29.4 27.7–31.5 16.1 13.1–17.9 23.0
Mortality from 31 days to 1 year (%) (M4)
10.2 9.2–11.9 12.0 11.5–13.1 8.7 7.3–10.0 9.9
IQR, interquartile range; LoS, length of stay. M1, M2, M3, M4: dependent variable in models 1 to 4
disease patients across countries (Ruddet al., 2001; Wolfeet al., 2004; Wiedmannet al., 2012; Weiret al., 2001; Heuschmannet al., 2011). However, to our knowledge, the present study is thefirst to analyse entire populations of cerebral infarction patients across countries (with the exception of Italy) with register data linked at the individual level.
Table II. (Continued)
Netherlands Scotland Sweden Total
IQR Mean IQR Mean IQR Mean IQR
Independent variables
Number of regions (N) 9 20 85
Population density (inhabitants/km2)
229–693 253 52–272 46 13–50 276 29–186
Gross domestic product per capita (EUR)
30 923–40 599 31 443 24 881–35 848 31 556 29 038–32 294 27 467 24 168–32 261 Herfindahl–Hirschman Index 0.13–0.34 0.69 0.49–0.90 0.43 0.32–0.47 0.47 0.31–0.64 Cerebral infarction cases/100 000
inhabitants
1178–1563 1429 1274–1721 465 409–496 737 393–890 Regions with no primary or
comprehensive stoke centre (N)
0 0 8
Effort (2006) 0.92–0.94 0.92 0.92–0.94 0.94 0.93–0.94 0.94 0.93–0.95
Dependent variables
LoS (days) 10.3–11.1 17.0 13.9–19.0 14.9 13.7–16.4 12.0 9.9–13.9
LoS (days), risk-adjusted (M1) 10.4–11.2 16.9 13.8–18.7 14.6 13.4–16.0 12.0 10.0–13.6
LoS (days), variance (M2) 68–94 641 213–1014 242 187–298 190 50–233
One-year mortality (%) 20.6–23.3 29.0 26.9–32.0 23.6 21.9–24.9 23.0 20.8–25.7
One-year mortality (%), risk-adjusted (M3)
21.4–24.0 36.2 33.2–37.8 19.8 18.4–21.0 23.9 19.0–28.9 Mortality from 31 days to
1 year (%) (M4)
9.5–11.1 14.7 13.4–15.2 12.3 11.7–13.2 11.5 10.0–12.8
Figure 3. Regional variation in length of stay and 1-year mortality (risk-adjusted, with 95% confidence intervals) after cerebral infarction in six European countries, in ascending order with regional values of length of stay and mortality, respectively
It was demonstrated earlier that national-level health registers can be used to monitor and compare the inci- dence of, treatment practices for and mortality in cases of cerebral infarction for hospitals, regions and countries (Meretoja et al., 2011). The existing national databases for the evaluation of cerebral infarction are often hospital-based and usually rely on voluntary reporting, while nationwide coverage varies (Meretoja et al., 2010). We developed these data a step further as we gathered comparable multinational register-based study Table III. Negative binomial regression results for length of stay in six European countries (standard errors on second row)
Finland Hungary Italy Netherlands Scotlanda Sweden
Age group 18–54 years 0.105** 0.128*** 0.091** 0.231*** 0.626*** 0.328***
0.037 0.01 0.031 0.025 0.074 0.032
Age group 55–64 years 0.013 0.058*** 0.093*** 0.217*** 0.290*** 0.219***
0.029 0.008 0.023 0.022 0.065 0.022
Age group 65–74 years 0.017 0.026*** 0.109*** 0.128*** 0.171** 0.092***
0.024 0.007 0.016 0.019 0.053 0.018
Age group 75–84 years (ref) (ref) (ref) (ref) (ref) (ref)
Age group 85 years 0.109*** 0.008 0.063** 0.051* 0.05 0.023
0.028 0.011 0.02 0.022 0.058 0.017
Male 0.017 0.002 0.073*** 0.035* -0.03 0.049***
0.02 0.006 0.014 0.015 0.041 0.013
Hypertension 0.011 0.062*** 0.006 0.091*** 0.05 0.035*
0.022 0.007 0.015 0.018 0.083 0.015
Coronary artery disease 0.167*** 0.016 0.065* 0.018 0.114 0.011
0.033 0.01 0.029 0.04 0.082 0.027
Atrialfibrillation 0.037 0.050*** 0.021 0.083 0.017 0.069**
0.034 0.015 0.038 0.045 0.091 0.025
Cardiac insufficiency 0.041 0.014 0.126** 0.0 -0.136 0.082*
0.046 0.015 0.043 0.057 0.131 0.033
Diabetes 0.037 0.026*** 0.035* 0.079*** 0.003 0.068***
0.024 0.007 0.016 0.018 0.099 0.018
Cancer 0.039 0.038* 0.058 0.076* 0.008 0.031
0.038 0.017 0.043 0.038 0.084 0.03
COPD 0.075** 0.035*** 0.029 0.019 0.029 0.056**
0.028 0.008 0.018 0.018 0.103 0.021
Dementia 0.013 0.037* 0.076 0.052 0.237 0.142***
0.044 0.017 0.059 0.062 0.175 0.038
Depression 0.092*** 0.058*** 0.012 0.110*** 0.042 0.024
0.027 0.008 0.021 0.02 0.326 0.017
Parkinson’s disease 0.145 0.022 0.047 0.081 0.544 0.034
0.081 0.014 0.047 0.054 0.346 0.046
Length of stay previous year 0.012*** 0.001*** 0.001 0.003** 0.001 0.003***
0.001 0.0 0.001 0.001 0.002 0.001
Monday 0.055 0.114*** 0.046 0.086** 0.139 0.034
0.035 0.011 0.027 0.027 0.074 0.025
Tuesday 0.075* 0.050*** 0.032 0.083** 0.011 0.013
0.035 0.012 0.027 0.027 0.076 0.025
Wednesday 0.069* 0.052*** 0.03 0.043 0.042 0.002
0.035 0.012 0.028 0.027 0.076 0.025
Thursday 0.004 0.040*** 0.038 0.025 0.053 0.047
0.036 0.012 0.028 0.028 0.076 0.025
Friday 0.090* 0.012 0.026 0.004 0.097 0.01
0.036 0.012 0.028 0.028 0.077 0.026
Saturday 0.032 0.003 0.056* 0.031 0.01 0.007
0.038 0.013 0.028 0.03 0.08 0.027
Sunday (ref) (ref) (ref) (ref) (ref) (ref)
Constant 2.332*** 2.376*** 2.463*** 2.552*** 3.001*** 2.75***
0.035 0.012 0.026 0.029 0.066 0.025
N 8735 34 148 9024 12 263 3591 19 065
PseudoR2 0.004 0.003 0.004 0.004 0.004 0.002
aFor Scotland, the comorbid diseases are based only on the primary and secondary diagnoses that the patient had in the hospital discharge records during the 365 days prior to cerebral infarction.
*p<0.05,**p<0.01,***p<0.001.
data, and we used these data to analyse the effect of regional-level factors associated with regional-level out- comes. The present study may be considered a step towards routine international register-based comparisons of health systems in the treatment of cerebral infarction.
The use of register data is both a strength and a limitation of the study. Many of the previous studies were restricted to analysing only the LoS of separate hospital discharges. A major strength of our data is that we were able to combine all hospital discharges for an individual patient and to extract the acute hospital care of the episodes for the analysis. Use of register data is a low-cost means to obtain population-wide patient- level data on cerebral infarction, but there are certain deficiencies in administrative data on cerebral infarction patients (Sacco et al., 2013). Coding practices and the availability of uniformly defined data affect and
Table IV. Results of the random intercept models with regional-level data (standard errors on second row) Risk-adjusted
LoS (M1)
Variance of LoS (M2)
Risk-adjusted 1-year mortality (M3)
Crude mortality between 31 and 365 days (M4)
Gross domestic product (EUR 1000) 0.013 0.854 0.205*** -0.043
0.044 3.559 0.059 0.036
Population density 0 0.004 0.001*** 0.001*
0 0.026 0 0
Herfindahl–Hirschman index 2.359 194.098 0.497 0.102
1.267 101.486 1.703 1.037
Cases per 100 000 pop. 0.001 0.102* 0.001 0
0.001 0.052 0.001 0.001
Primary or comprehensive stroke centre in region 0.542 57.221 0.305 0.105
0.906 72.511 1.182 0.726
Effort 8.58 977.056 20.599 13.167
16.253 1301.853 21.321 13.05
Variance of LoS 0.002 0.001
0.002 0.001
Constant 19.857 728.791 49.609* 0.25
15.015 1202.439 19.752 12.036
LoS, length of stay.
*p<0.05,**p<0.01,***p<0.001.
Table V. Results of the regional-level random intercept models and hierarchical models with pooled individual-level data (standard errors on second row)
With regional-level data With individual-level data Risk-adjusted LoS
(M1)
Risk-adjusted 1-year
mortality (M3) LoS
One-year mortality
Gross domestic product (EUR 1000) -0.049 0.254*** 0.000 0.014***
0.048 0.061 0.001 0.000
Population density 0 0.001** 0.000 0.000**
0 0.000 0.000 0.000
Herfindahl–Hirschman index 0.385 2.291 0.151*** -0.214
1.178 1.481 0.020 0.106
Cases per 100 000 pop. 0 -0.003 0.000 0.000
0.002 0.002 0.000 0.000
Primary or comprehensive stroke centre in region 0.532 0.933 0.021 0.071
0.762 0.966 0.015 0.076
Effort 7.884 129.4*** 1.950*** 6.931***
20.949 26.133 0.149 1.657
Variance of LoS 0.000 0.000
0.003 0.000
Constant 17.649 151.3*** 4.604** 6.982***
19.459 24.31 0.137 1.531
LoS, length of stay.
*p<0.05,**p<0.01,***p<0.001
constrain any register-based study. In the present study, the major limitations were the lack of measures at the patient level for the severity of the disease, socioeconomic status, frailty, care in intensive care units, throm- bolysis and costs. The individual-level data did not include a measure for the severity of cerebral infarction. It has been shown that severity of the disease is the most important factor contributing to a patient’s LoS (Appelros, 2007; Kotonet al., 2010). The very low ability of the patient characteristics we used to explain var- iation in LoS may partly be due to this lack. However, there is some evidence indicating that severity of isch- aemic stroke may be quite similar in different geographical regions (Kunisawaet al., 2013). For Scotland, data on medication in the year before the index admission to better identify patients’comorbid diseases were un- available, and this may have carried over to the risk-adjusted measures of LoS and 1-year mortality. As discussed in Malmivaara et al.(2015), the cerebral infarction data used may not be fully representative in the Netherlands or Scotland. This may also bias the individual-level results for these two countries. Despite this, the regional-level analyses may be considered valid, as the causes for partial representativeness in these two countries do not affect the regional-level comparisons of care and outcomes. Many aspects of nations and healthcare systems have been shown to be related to healthcare expenditure (Martínet al., 2011). One such feature is the remuneration of hospitals, but unfortunately, we did not have enough variation in our regional-level data regardingfinancing of hospitals to be able to study the effects that different payment mech- anisms may have on LoS and mortality. The regional supply of non-acute and social care after cerebral infarc- tion and the cultural differences in informal care may also be linked to LoS acute care, but in the absence of data, it was not feasible to take their effects into account.
Cerebral infarction can be considered a‘low variation condition’regarding expected small area variation with respect to acute hospital care (Wennberg and Gittelsohn, 1973). In addition, given the long and acclaimed history of analyses of LoS in hospital care (Clarke and Rosen, 2001), we expected the variation in LoS after cerebral infarction to be moderate at most. The observed variations between regions and countries in both LoS and mortality were not very well explained by either patient-level or regional-level factors and may therefore represent different healthcare policies and management of cerebral infarction. Furthermore, the present study confirmed that international benchmarking of acute hospital care using individual-level register data is possible. However, administrative data should be enriched with individual-level severity measures of cerebral infarction in order to convey more precise information on performance.
It is important that healthcare managers are informed of differences in LoS observed within and between countries. Comparing the resources used to the outcomes achieved is the next step in research in order to be able to give recommendations about the optimal use of resources in treatment. In particular, it is important to deter- mine which factors can be changed, and which effects stem from which various features in the healthcare system.
CONFLICT OF INTEREST
The authors have declared that there are no conflicts of interest.
ACKNOWLEDGEMENTS
We are indebted to Helen Banks, Unto Häkkinen, Alison McCallum, Fabrizio Tediosi and two anonymous referees for their helpful comments on earlier drafts. Any remaining errors and omissions are the responsibility of the authors.
FUNDING
This project was undertaken within the European Union 7th Framework Programme ‘European Health Care Outcomes, Performance and Efficiency’(EuroHOPE), Contract no 241721.