EUROPEAN REGIONAL DIFFERENCES IN ALL-CAUSE MORTALITY AND LENGTH OF STAY FOR PATIENTS WITH HIP FRACTURE
EMMA MEDINa,*, FANNY GOUDEa, HANS OLAV MELBERGb, FABRIZIO TEDIOSIc, EVA BELICZAd, MIKKO PELTOLAeON BEHALF OF THE EUROHOPE STUDY GROUP
aMedical Management Centre, Karolinska Institutet, Stockholm, Sweden
bDepartment of Health Management and Health Economics, University of Oslo, Oslo, Norway
cDepartment of Policy Analysis and Public Management, Bocconi University, Milano, Italy
dSemmelweis University, Budapest, Hungary
eCentre for Health and Social Economics (CHESS), National Institute for Health and Welfare, Helsinki, Finland
SUMMARY
The objective of this study was to compare healthcare performance for the surgical treatment of hip fractures across and within Finland, Hungary, Italy, the Netherlands, Norway, Scotland, and Sweden. Differences in age-adjusted and sex- adjusted 30-day and one-year all-cause mortality rates following hip fracture, as well as the length of stay of thefirst hospital episode in acute care and during a follow up of 365 days, were investigated, and associations between selected country-level and regional-level factors with mortality and length of stay were assessed.
Hungary showed the highest one-year mortality rate (mean 39.7%) and the lowest length of stay in one year (12.7 days), whereas Italy had the lowest one-year mortality rate (mean 19.1 %) and the highest length of stay (23.3 days). The observed variations were largely explained by country-specific effects rather than by regional-level factors. The results show that there should still be room for efficiency gains in the acute treatment of hip fracture, and clinicians, healthcare managers, and politicians should learn from best practices. This study demonstrates that an international comparison of acute hospital care is possible using pooled individual-level administrative data. Copyright © 2015 John Wiley & Sons, Ltd.
KEY WORDS: hip fracture; length of stay; mortality; regional differences; europe
1. INTRODUCTION
In this international healthcare performance study a disease-focused approach assessing the treatment of hip fracture was used with the advantage of having a consensus around what outcome measures, i.e. mortality, to compare (Häkkinen and Joumard, 2007). Hip fractures are a significant cause of morbidity and mortality worldwide. Hip fractures account for 63–72% of all hospital admissions for fractures in patients aged over 50 years (Strömet al., 2005) and even after the initial hospitalisation, hip fractures continue to generate signif- icant costs throughout thefirst year after hip fracture (Haentjenset al., 2005). Patients with hip fracture have an excessfivefold to almost eightfold increased risk of all-cause mortality during thefirst three months after the fracture (Haentjenset al., 2005).
In Medin and colleagues (Medinet al., 2015) it was demonstrated how the European Union 7th Framework Programme European Health Care Outcomes, Performance, and Efficiency (EuroHOPE) patient database can be used to describe similarities and differences in patient characteristics, all-cause mortality rates, and length of stay (LoS) among patients surgically treated for hip fractures, across seven European countries: Finland,
*Correspondence to: Medical Management Centre, Department of LIME, Karolinska Institutet, Tomtebodavägen 18A 171 77, Stockholm, Sweden. E-mail: emma.medin@ki.se
Hungary, Italy,1the Netherlands, Norway, Scotland, and Sweden. The results showed marked differences in mortality and in LoS at the national level as well as at the regional level. In the current study the objectives were to assess associations between selected national-level and regional-level factors and age-adjusted and sex- adjusted 30-day mortality rate, one-year mortality rate, LoS of thefirst hospital episode in acute care as well as after 365 days following hip fracture surgery in the same seven countries. The paper will start with a presen- tation of underlying hypotheses for national and regional effects on these measures. Thereafter, the data will be thoroughly described and the data analyses conducted presented. The paper will end with the study results and a discussion.
2. HYPOTHESES 2.1. Country-level effects
2.1.1. Type of funding.Social insurance models and tax-based models have basic ideas such as universal cov- erage and third-party payments in common but they typically differ along several dimensions such as redistri- butional efforts, level of integration between payers and providers, and reimbursement methods (Mossialos and Dixon, 2002a; Streetet al., 2011). Reimbursement systems are usually described along two dimensions (Jegers et al., 2002): whether the system is prospective or retrospective and whether the funding is activity-based or fixed. During the studied time period all seven countries included in the current study applied prospective pay- ment systems, but some with elements of cost compensation (e.g. in Finland price adjustments from the regions to the municipalities may appear during thefiscal year). Activity-based funding (ABF) systems were used by Hungary, Italy, the Netherlands, and Norway. The Netherlands used diagnosis-related group (DRG)-based funding, while the Norwegian and the Italian models combined ABF based on the DRG system with risk- adjusted capitation. In Sweden, the reimbursement system differed among the counties with a dominance of DRG-based funding. In Finland and Scotland fixed funding systems, i.e. global budgets, were used. We hypothesised that ABF would lead to shorter LoS than fixed-payment systems where the incentives for discharging a patient are absent (Streetet al., 2011).
2.1.2. National clinical guidelines.There are no internationally accepted clinical guidelines for how to treat hip fractures. However, Finland, the Netherlands, Norway, Scotland, and Sweden all published national clinical guidelines in the 2000s (Michelessonet al., 2005; van Vugt 2008; Frihagenet al., 2010, Scottish Intercollegiate Guidelines Network, 2009, Socialstyrelsen 2003). Most recommendations focus on the maximum waiting time for surgical treatment (24 h) and on what surgical procedure to use, both of which are believed to be associated with better surgical outcome. The hypothesis is that in countries where clinical guidelines are developed and available, better performance in terms of lower mortality rates and shorter LoS should be presented.
2.2. Regional-level effects
2.1.3. Socio-economic status.Socio-economic status is a well-established factor influencing health outcomes of patients. More specifically there seem to be an association between social deprivation and hip fracture mortality (Quahet al., 2011). Therefore, regions in countries with higher GDP per capita and small socio-economic dif- ferences such as Norway, the Netherlands, and Sweden are expected to be associated with lower mortality rate and shorter LoS compared with the other countries.
2.1.4. Distance to hospital.The greater the population density, the higher the probability for short distances to the hospital, shorter preoperative waiting time, and hence lower mortality rates. Also, LoS is assumed to be shorter as patients are assumed to be discharged earlier if they live close to the hospital.
1Italian data cover the inhabitants of City of Turin and of the provinces in the Lazio region (Frosinone, Latina, Rieti, Roma, and Viterbo).
2.1.4. Practice-makes-perfect.If the practice-makes-perfect theory (Halmet al., 2002) is valid for hip-fracture care, a higher population density, a higher number of hip fracture cases per capita, and a more concentrated healthcare delivery system measured by a higher Herfindahl–Hirschman Index (HHI) for concentration of hip fracture care should have a positive effect on mortality rates and on healthcare resource utilisation. In a study of American patients with hip fracture, it was found that individuals undergoing surgery at hospitals performing a relatively large number of hip fracture surgeries had both shorter LoS and lower probabilities of in-hospital mortality rate than patients at low-volume hospitals (Hughes et al., 1988). However, in Sund and colleagues no clear relationship was found between hospital volume and the effectiveness of hip fracture treatment, but an association between the rehabilitation unit volume and effectiveness was detected (Sund, 2010).
2.1.5. Sex.Finally, as the ratio of women to men suffering from hip fracture has been 3:1 (Thorngren, 1995) and as excess mortality associated with hip fracture is higher in men than in women regardless of age (Haentjens et al., 2005), a variable representing the share of males per region was included. It is assumed that a larger share of males would have a negative effect on mortality.
To summarise, in the regression models it is assumed that the values for mortality and LoS were functions of the following exogenous country-level variables: (i) funding type and (ii) availability of national clinical guide- lines as well as of the following regional exogenous variables: (i) GDP per capita; (ii) population density; (iii) HHI; (iv) number of hip fracture cases above 50 years per 100 000 inhabitants; and (v) share of males in the region.
3. METHODS 3.1. Data
Patients were included in the national EuroHOPE comparison databases if they were older than 50 years, had been admitted to hospital inpatient care because of hip fracture and undergone a surgical procedure related to hip fracture surgery between 1 January and 31 December 2007.2Hip fracture was defined using any of the following International Statistical Classification of Diseases and Related Health Problems, 10th revision (ICD-10) diagnosis: femoral neck fracture (ICD-9 code 820.00-10 or ICD-10 code S72.0), pertrochanteric fracture (ICD-9 code 820.20-21, 820.30-31, or ICD-10 code S72.1), or subtrochanteric fracture (ICD-9 code 820.22, 820.32, or ICD-10 code S72.2). The surgical procedures included were total or partial prosthetic replacement, internalfixation, or externalfixation of the hip joint. The development of the national compari- son databases was conducted by using a common protocol and by linking data from the discharge registers to data from other national routinely collected data covering drug utilization and deaths (Hakkinenet al., 2013;
Moger and Peltola, 2014). Because it was not possible to pool individual data due to national data regulations, aggregate regional-level measures calculated from the national comparison databases were used. The depen- dent variables were regional-level age and sex-adjusted mortality rates and LoS, based on the ratio between observed and predicted mortality and LoS in the region. The predicted mortality rates and LoS was acquired with coefficients from a negative binomial regression model (logistic regression), estimated with pooled individual-level data from Finland, Hungary, Italy, and Sweden. LoS was measured as the time from acute care index admission until death or up to 365 days, and it included hospital transfers. Acute hospital care was defined as treatment given in the hospital’s intensive care unit, in a medical or a surgical ward. For a full description of the episode approach developed for the EuroHOPE-project, see Häkkinen, Iversenet al., 2013.
The following patients were excluded: patients with a LoS involving continuous hospital treatment longer than the 99th percentile, patients younger than 50 years of age, tourists, visitors, and other residents with incomplete personal identity numbers.3
2For Norway data from 1 January to 31 December 2009 were used.
3In Italy, residents of either the Lazio or Piedmondt regions with their index admission outside of their regions were excluded.
Data on the national and regional level factors were acquired from the statistical database of the Organisation for Economic Co-Operation and Development and from the national statistics bureaus in each country. The re- gion was defined on the basis of the patient’s residence, not of the location of the hospital where the patient was treated. Regions in Finland (17), Italy (6), Norway (18), the Netherlands (10), Scotland (11), and Sweden (20) refer to local authorities responsible for health care, whereas in Hungary (20) region is based on a regional gov- ernmental division where public authorities have limited responsibility for healthcare provision, but not funding. For Italy, data from only one region (Lazio, population 5.5 million) and one town (Turin, population 0.9 million) were available. Six regions with less than 100 hip fractures in 2007 were excluded as well as four additional regions from Scotland where data were incomplete.
3.2. Analysis
Regional-level analyses were carried out with pooled regional-level data and risk-adjusted indicators for all countries. Four different responses at the regional level were studied: age and sex adjusted 30-day mortality rate, one-year mortality rate, and age-adjusted and sex-adjusted LoS for first hospital stay in acute care and in one year. First a one-way random-effect analysis of variance (ANOVA) model was used to determine the portion of variance that was because of cross-country differences as opposed to regional differences. Then, the estimations for each of the four dependent variables were performed with a random-intercept model (mixed-effects maximum likelihood regression), using the explanatory variables mentioned previously (M2).
If the random intercept model did not show evidence of variation in the intercepts according to the Hausman test, afixed-effect regression model was used (M1). In addition the country-levelfixed effects were replaced with fixed-effects variables describing the funding type as well as the availability of clinical guidelines in a separate model (M3).
4. RESULTS 4.1. Descriptive statistics
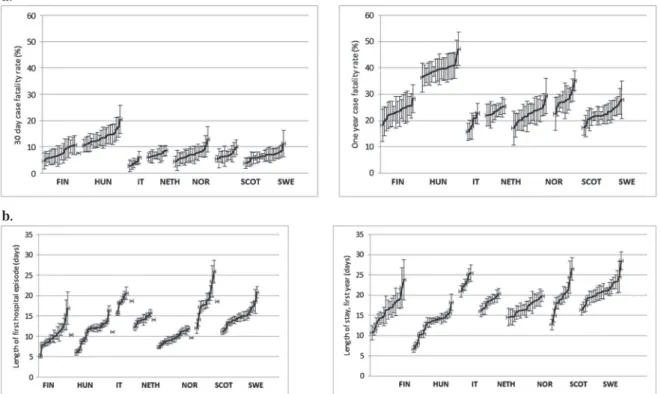
Our database covered 59 605 patients with hip fracture from the period 2007,4residing in 102 regions in seven European countries. Figure 1 present the age-standardised and sex-standardised national and regional mortality rates and LoS. At the national level, Hungary showed the highest one-year mortality rate, and at the same time, the shortest LoS in one year whereas Italy had the lowest one-year mortality rate and the longest LoS during the first acute stay as well as in one year. The same pattern was observed for 30-day mortality rate.
The regional-level indicators and regional averages are presented in Table I. The average GDP per capita per region was almost three times higher in Norway than in Hungary where the within country variation was also greatest. There were marked differences in the average population density per region, where the highest value was found in Italy and the lowest in Sweden. The average HHI was highest in Finland and lowest in the Netherlands, whereas Italy had the highest share of patients with hip fracture per region and Finland the lowest share. The situation was the complete opposite when it comes to share of males per region, which was the lowest in Italy and the highest in Finland.
4.2. Country-level and regional-level analysis
The one-way random effects ANOVA indicated that 73% of the variation in age-adjusted and sex-adjusted 30-day mortality rate was between the countries whereas only 27% of the variation was attributable to regional differences. Variation in one-year mortality rate were to 88% attributable to the country level whereas 57% of the variation in risk-adjusted LoS for thefirst hospital admission and during thefirst year were attributable to
4For Norway data from 1 January to 31 December 2009 were used.
the country level. The Hausman test suggestedfixed effect models for the estimations of 30-day mortality rate and the LoS measures and random effects model for the one-year mortality rates.
Fixed budgets did not have any significant effect on mortality or LoS at the national level (Tables II and III).
Availability of national clinical guidelines was associated with lower mortality rates and longer LoS in one year, which was according to the expectations. There were significant differences between countries in both mortality and LoS where 30-day mortality rate was 5.4% points higher in Hungary than in Finland (which was included in the reference category). In Italy 30-day mortality rate was 4.6% points lower than Finland and in Sweden 1.3% points lower. The result of the random effect model for one-year mortality rates showed the same trend with the addition of Scotland having a higher rate than the average. Thefirst LoS was 8.5 days longer in Italy compared with in Finland, 7.5 days longer in Scotland, 4 days longer in Sweden, and 3 days longer in the Netherlands. Total LoS in one year was 7 days longer in Italy and 4 days longer in Sweden. In Hungary the total LoS in one year was almost three days shorter compared with Finland. At the regional level a larger share of males was associated with higher 30-day mortality rate in M3. The regional variables did not further explain variances in a statistically significant way.
5. DISCUSSION
The EuroHOPE hip fracture project compared healthcare performance for the treatment of hip fractures across and within seven European countries, i.e. Finland, Hungary, Italy, the Netherlands, Norway, Scotland, and Sweden based on pooled administrative patient-level data, taking into account differences in patient characteristics.
At the national level, comparisons of healthcare units has become increasingly common and in many coun- tries disease-specific quality registers are maintained with the objective of comparing outcomes of medical
b.
a.
Figure 1. a: National and regional variation in 30-day and one-year mortality rate (%), age-standardised and sex-standardised mortality rates. b: National and regional variation in length of first hospital episode and during one-year (days), age-standardised and sex-
standardised rates.
treatments and interventions in healthcare, especially for large and resource-consuming groups as patients with hip fractures. However, national datasets may not be sufficient for discovering new approaches that cost less and are more effective. International studies comparing outcomes across countries or across regions in different countries have been less common, and to our knowledge this is thefirst multi-national population-level study on hip fracture where register data have been linked and assessed at the individual level and where explanations to differences are addressed. Among the few international studies available there is one where patients with hip fracture were followed in Sweden and in the Netherlands (Berglund-Rödenet al., 1994). The results showed that the functional outcome after four months was consistent between the centres studied, but a difference in Table I. Regional indicators and their regional averages and coefficient of variations of non-adjusted and age-adjusted and
sex adjusted mortality rate, and length of stay
Finland Hungary Italy
Avg SD CV Avg SD CV Avg SD CV
Number of regions (N) 17 – – 20 – 6 – –
Regional indicators
GDP per capita (EUR) 29 816.5 5225.4 17.5 14 562.6 6372.3 43.8 27 262.6 3860.9 14.2
Population density 64.4 169.1 262.8 248.2 703.8 283.5 1379.5 2758.7 200.0
Herfindahl–Hirschman index 0.7 0.2 33.3 0.4 0.1 33.2 0.3 0.2 86.9
Hip fracture/100 000* 306.7 1785 58.2 641.1 500.4 78.1 1268.8 1780.9 140.4
Share of males (%) 30.5 3.2 10.5 30.2 1.9 6.2 23.1 1.4 6.2
Regional averages
30-day mortality rate (%) 7.6 2.0 26.5 11.7 2.0 17.5 4.1 1.2 29.2
30-day mortality rate (%), age-and sex adjusted
7.5 1.9 25.8 13.7 2.5 17.9 4.0 1.1 28.6
One-year mortality rate (%) 23.6 2.9 12.2 34.8 2.1 6.1 19.7 3.1 15.7
One-year mortality rate (%), age-and sex adjusted
23.3 2.4 10.5 39.7 2.6 6.5 19.1 2.8 14.5
LOS (days) 10.4 2.8 27.5 10.9 2.6 23.9 18.9 1.7 9.2
LOS (days), age-and sex adjusted 10.3 2.8 27.5 11.1 2.6 23.9 18.7 1.8 9.4
LOS 365 (days) 16.4 3.5 21.3 12.6 2.9 23.0 23.4 1.7 7.5
LOS 365 (days), age-and sex adjusted 16.4 3.5 21.3 12.7 2.9 23.0 23.3 1.8 7.6
Avg = average, SD = standard deviation, GDP = gross domestic product, EUR = euro, CV = coefficient of variation.
*Above 50 years of age.
Table I. (Continued)
Netherlands Norway
Avg SD CV Avg SD CV
Number of regions (N) 10 – – 18 – –
Regional indicators
GDP per capita (EUR) 35 273.0 5267.9 14.9 43 060.7 10 680.2 24.8
Population density 548.7 356.7 65.0 103.6 312.9 302.1
Herfindahl–Hirschman index 0.2 0.1 43.9 0.5 0.3 54.3
Hip fracture/100 000* 713.6 405.6 56.8 314.3 151.9 48.3
Share of males (%) 26.8 1.9 7.3 28.9 2.0 6.8
Regional averages
30-day mortality rate (%) 7.3 0.7 9.8 8.4 2.5 30.2
30-day mortality rate (%), age-and sex adjusted
7.1 0.8 11.9 7.2 2.0 28.3
One-year mortality rate (%) 24.0 1.4 5.8 25.3 3.8 15.2
One-year mortality rate (%), age-and sex adjusted
23.5 1.3 5.4 22.4 2.9 13.1
LOS (days) 14.2 1.0 7.3 9.8 1.4 13.9
LOS (days), age-and sex adjusted 14.1 1.0 7.3 9.6 1.3 13.8
LOS 365 (days) 18.3 1.4 7.8 17.0 1.7 10.2
LOS 365 (days), age-and sex adjusted 18.3 1.4 7.8 16.9 1.7 10.2
mortality within thefirst postoperative months was found, which seemed attributable to the operation proce- dure. In a study from 2002 patients with hip fracture in Budapest (Hungary) were compared with those in Sundsvall and Lund (Sweden) with regards to surgical treatment procedure, rehabilitation, and outcomes (Cserhátiet al., 2002). The results showed that less intracapsular and more trochanteric fractures were observed in Budapest and that a larger share of Hungarian patients returned to their homes instead of to a nursing home at discharge. However, the Hungarian mortality rate six months later significantly exceeded that of the Swedish centres (24% versus 15 and 13%). In the current study the differences in mortality between Hungary and Sweden were even higher (39.7% versus 13.3% in six-month mortality rate).
The results of the current study showed that there were remarkable variations in mortality and LoS, across countries and within countries, even after accounting for patient characteristics such as age and sex. One could argue that additional case-mix factors such as pre-fracture mobility and pre-surgery American Society of Anesthesiologists Physical Status would have reduced patient characteristics confounding the results. The variations in mortality rate seemed to be associated with country-level factors such as funding-type, socio- economic status, availability of clinical guidelines, and country-specific effects that remain unexplainable, rather than regional-level factors available for the study. The direction of the effects was the expected for Hungary with higher mortality rate and shorter LoS than in Finland and higher within country variation especially for LoS. Italy had surprisingly lower mortality rates and somewhat longer LoS than expected (please note that the regions included are rich areas). However, there were a number of national-level and regional- level factors that are believed to be associated with lower mortality rate, which unfortunately was not included in the study. For example, there is a belief that a focus on care maps to improve timely surgical intervention, movement toward replacement arthroplasty, a push for earlier weight bearing exercise, better use of prophylactic antibiotics, aggressive medical management, and increased rates of discharge to non-acute healthcare settings (rather than home) may contribute to improvements in mortality (Brauer et al., 2009).
However, none of these aspects could be followed in the current study. The causes for differences in LoS across the countries types were most likely because of the different surgical methods and rehabilitation practices for the different fracture types (Sundet al., 2009). Difference in LoS could also arise because of death of the patient (shortens the LoS). In addition, although we attempted to make the content of care given in hospitals comparable between the countries the differences may be related to the fact that patients in some countries were transferred very soon to hospitals not included in our data (i.e. health centres or rehabilitation institutions), whereas in other countries the care in the acute phase may also include rehabilitation and care services.
Table I. (Continued)
Scotland Sweden
Avg SD CV Avg SD CV
Number of regions (N) 11 – – 20 – –
Regional indicators –
GDP per capita (EUR) 31 075.9 9011.4 29.0 31 556.3 4248.1 13.5
Population density 219.4 304.5 138.8 45.6 64.3 141.2
Herfindahl–Hirschman index 0.6 0.3 43.4 0.5 0.2 46.5
Hip fracture/100 000* 524.4 351.7 67.1 703.4 732.8 99.8
Share of males (%) 23.7 2.5 10.6 29.9 2.1 6.9
Regional averages –
30-day mortality rate (%) 7.0 1.5 21.0 7.2 1.4 19.4
30-day mortality rate (%), age-and sex adjusted
6.9 1.4 20.0 6.3 1.2 19.4
One-year mortality rate (%) 28.5 2.8 10.0 24.5 2.8 11.6
One-year mortality rate (%), age-and sex adjusted
28.1 3.3 11.7 22.3 2.4 10.9
LOS (days) 18.7 3.9 20.8 14.8 2.2 14.9
LOS (days), age-and sex adjusted 18.6 3.9 20.9 14.6 2.2 14.9
LOS 365 (days) 19.5 3.8 19.6 20.9 2.7 12.7
LOS 365 (days), age-and sex adjusted 19.5 3.9 19.8 20.7 2.6 12.7
TableII.Regressionresults,fixedeffects,andrandomeffectsmodelsfor30-dayandone-yearmortalityrates(standarderrorsinbrackets) Standardised30-daymortalityrateStandardisedone-yearmortalityrate M1M2M3M1M2M3 Intercept12.578***(3.113)11.000***(2.841)7.841**(2.811)24.046***(17.583,28.179)26.042***(4.456)30.804***(5.546) GDPpercapita(EUR1000)0.003(0.003)0.004(0.003)0.005(0.004)0.004(0.005)0.005(0.004)0.014(0.007) Populationdensity0.002(0.028)0.003(0.030)0.029(0.040)0.035(0.040)0.037(0.041)0.048(0.078) Herfindahl–Hirschmanindex1.159(0.979)1.071(1.001)1.320(1.286)1.171(1.400)1.175(1.426)3.175(2.537) Hipfracture/1000000.039(0.038)0.035(0.039)0.073(0.050)0.004(0.054)0.002(0.055)0.059(0.099) Sharemales0.103(0.086)0.046(0.085)0.201*(0.086)0.038(0.124)0.054(0.125)0.298(0.171) Dummyforfixedbudget0.610(0.723)2.680(1.427) Dummyclinicalguidelines Countryindicatorsa3.936***(1.002)9.914***(1.978) Sweden1.308*(0.636)0.914*(0.444)1.165(0.911)3.106(2.459) Hungary5.400***(0.870)5.553***(0.895)15.470***(1.244)13.235***(1.064) Italy4.572***(1.215)3.798***(1.009)4.938**(1.738)6.744**(2.374) Netherlands1.090(0.916)0.574(0.482)0.238(1.311)2.112(11.634) Norway0.433(0.838)0.058(0.112)0.933(1.199)2.718(3.493) Scotland1.225(0.944)0.664(0.512)5.364***(1.351)3.402***(0.857) Finland0.0339(0.895)1.957(1.064) AdjustedR-squared0.72080.02040.42490.87940.02870.5276 Fstatistics23.53***1.0011.13***64.65***0.2416.32*** Hausmantest,chisquared28.318***0.511 GDP=grossnationalproduct,EUR=euro,M1=Fixedeffectmodel,M2=randomeffectmodel,M3=dummiesfortax-basedfunding,M4=Dummiesforsystemswithclinical guidelines. Thereferencecategoriesinthefixed-effectmodelareFinland,ABF,andtheabsenceofnationalclinicalguidelines. aDummyvariablesinM1(referenceFinland),randomeffectsinM2. *P≤0.05;**P≤0.01;***P≤0.001.
TableIII.Regressionresults,fixedeffectsandrandomeffectsmodelsforlengthofstay(standarderrorsinbrackets) StandardisedfirstLoSStandardisedLoSinoneyear M1M2M3M1M2M3 Intercept10.225*(4.220)23.532***(3.639)29.761***(3.585)15.127**(4.830)21.631***(4.016)23.990***(3.900) GDPpercapita(EUR1000)0.004(0.004)0.000(0.004)0.007(0.005)0.005(0.005)0.007(0.004)0.000(0.005) Populationdensity0.005(0.038)0.009(0.042)0.018(0.050)0.017(0.044)0.012(0.046)0.020(0.055) Herfindahl–Hirschmanindex0.609(1.326)1.428(1.431)1.813(1.640)0.427(1.518)0.704(1.578)0.208(1.784) Hipfracture/1000000.043(0.051)0.012(0.056)0.050(0.064)0.019(0.059)0004(0.062)0.077(0.070) Sharemales0.020(0.117)0.325**(0.113)0.542***(0.110)0.000(0.134)0.194(0.124)0.342**(0.120) Dummyforfixedbudget0.283(0.922)1.898(1.003) Dummyclinicalguidelines2.092(1.278)4.207**(1.390) Dummyclinicalguidelines Countryindicatorsa Sweden4.232***(0.863)1.013***(0.207)4.279***(0.987)2.534***(0.584) Hungary1.353(1.179)2.019(1.759)2.920*(1.349)4.373*(2.020) Italy8.507***(1.646)4.316***(0.835)7.270***(1.885)4.508***(1.169) Netherlands3.350**(1.241)0.054**(0.020)1.595(1.421)0.258(0.230) Norway1.142(1.136)4.026(4.005)0.090(1.300)1.497(21.623) Scotland7.539***(1.279)3.782***(0.642)2.606(1.464)0.569(0.320) Finland3.012**(1.759)1.482(2.020) AdjustedR-squared0.57230.31940.21940.52860.31450.2234 Fstatistics12.68***8.90798***4.856***10.79***8.68***4.95*** Hausmantest,chisquared52.3425***13.0431** GDP=grossnationalproduct,EUR=euro,M1=fixedeffectmodel,M2=randomeffectmodel,M3=dummiesforDRGsystemsandexistenceofnationalclinicalguidelines. Thereferencecategoryinthefixed-effectmodelincludesFinland,ABF,andtheabsenceofnationalclinicalguidelines. aDummyvariablesinM1(referenceFinland),randomeffectsinM2. *P≤0.05;**P≤0.01;***P≤0.001.
There seemed to be no relationship between GDP and LoS, although there is a wealth of evidence showing that healthcare spending is usually highly correlated with GDP per capita. Higher share of males in the region had a small positive association with higher 30-day mortality rate (in model M3). There was no clear associa- tion between GDP per capita, HHI, population density, or number of hip fracture cases per region and mortality rate or LoS. Previous studies on hospital volume and hip fracture outcome have indeed been inconsistent (Luft et al., 1987; Shervinet al., 2007), but one aspect that is known to be of importance for mortality in patients with hip fracture is pre-operative waiting time. Several studies have demonstrated that a delay in surgery increases morbidity and mortality in these patients (Sorbie, 2003; Szitaet al., 2002; Sund and Liski, 2005), and it is gen- erally recommended that patients with a hip fracture undergo surgery within 24 h after admission (Royal Col- lege of Physicians, 1989). There is also evidence that pre-operative waiting time has an effect on LoS (Olsson et al., 2006; Siegmethet al., 2005). In addition, researchers have suggested that fast-track treatment for patients with hip fracture, including earlier transfers from the emergency room, would benefit outcomes and contribute to better continuity of care (Larsson and Holgers, 2011; Turesson et al., 2003). Unfortunately, data on lead- times were not available in our dataset.
The use of register data is both a strength and limitation of the study. A major strength of our data is that we were able to combine all hospital discharges of a patient and to extract the acute hospital care of the episodes for the analysis and that all transfers of patients between hospitals and between clinical wards were included.
Coding practices and the availability of uniformly defined data affect and constrain any register-based study.
One weaknesses in the register data was the lack of information on aspects known to affect mortality and LoS, such as additional measures at the patient level for case-mix, pre-operative waiting time, post-operative complications (Hommelet al., 2003), and surgical procedure type. Finally, as patients with hip fracture are elderly and in many cases in need of rehabilitation, it would have been useful to include LoS in nursing homes and their related costs.
Despite of many research, the reasons for regional variations in health care are not clearly understood (Skinner, 2011). It is important that doctors, healthcare managers, and politicians are informed of differences in mortality rates and LoS observed within and between countries, and this study can be considered a step towards routine international register-based comparisons of health systems in the treatment of hip fractures.
CONFLICT OF INTEREST
The authors have declared that there is no conflict of interest.
ACKNOWLEDGEMENTS
We are indebted to Clas Rehnberg for helpful comments on an earlier draft. Any remaining errors and omis- sions are the authors’responsibility. This project was undertaken within the European Union 7th Framework Programme European Health Care Outcomes, Performance and Efficiency (EuroHOPE), contract no. 241721.
REFERENCES
Berglund-Rödén M, Swierstra BA, Wingstrand H, Thorngren KG. 1994. Prospective comparison of hip fracture treatment.
856 cases followed for 4 months in The Netherlands and Sweden.Acta Orthopaedica Scandinavica65: 287–294.
Brauer PM, Hanning RM, Arocha JF, Royall D, Goy R, Grant A. 2009. Creating case scenarios or vignettes using factorial study design methods.Journal of Advanced Nursing65(9): 1937–1945.
Cserháti P, Fekete K, Berglund-Rödén M, Wingstrand H, Thorngren K-G. 2002. Hip fractures in Hungary and Sweden - differences in treatment and rehabilitation.Int Orthopaedic26(4): 222–228.
Frihagen F, Figved W, Madsen JE, Lofthus CM, Støen R, ØNordsletten L. 2010. Behandling av lårhalsbrudd Tidsskr Nor.
Legeforen 2010130: 1614–1617.
Haentjens P, Lamarski G, Boonen S. 2005. Cost and consequences of hip fracture occurrence in old age: an economic per- spective.Disability and Rehabilitation27(18–19): 1129–11141.
Halm EA, Lee C, Chassin MR. 2002. Is volume related to outcome in health care? A systematic review and methodologic critique of the literature.Ann International Medical.137: 511–520.
Hughes RG, Garnick DW, Luft HS, McPhee SJ, Hunt SS. 1988. Hospital volume and patient outcomes: the case of hip frac- ture patients.Medical Care26(11): 1057–1067.
Häkkinen U, Iversen T, Peltola M, Seppälä T, Malmivaara A, Belicza E, Fattore G, Numerato D, Heijink R, Medin E, Rehnberg C. 2013. Health care performance comparison using a disease-based approach: The EuroHOPE project.
Health Policy, Volume 112, Issues 1–2, September 2013, Pages 100–109.
Häkkinen U, Joumard L. 2007. Cross-country analysis of efficiency in OECD Health Care Sectors: options for research, OECD Economic Department Working Papers, No 554, OECD, Paris.
Jegers M, Kesteloot K, De Graeve D. 2002. A typology for provider payment systems in health care.Health Policy60:
255–273.
Larsson G, Holgers KM. 2011. Fast-track care for patients with suspected hip fracture. Injury, Int. J.Care Injured 42:
1257–1261.
Luft HS, Hunt SS, Maerki SC. 1987. The volume-outcome relationship: practice-makes-perfect or selective-referral pat- terns?Health Services Research22: 157–182.
Medin E. 2015. EuroHOPE Hip fractures: Results EuroHOPE Discussion Papers.
Michelsson O, Björkenheim J-M, Kirjavainen M, Pajarinen J. 2005. Behandling av höftfrakturer. Finska Läkarsällskapets Handlingar, 2;165:21–25.
Moger TA, Peltola M. 2014. Risk adjustment of health-care performance measures in a multinational register-based study:
A pragmatic approach to a complicated topic. SAGE Open Medicine January - December 2014 vol. 2.
Mossialos E, Dixon A. 2002a. Funding health care: an introduction in Europe: weighing up the options. InFunding Health Care: Options for Europe, Mossialis EA, Dixon A, Figueras J, Kutzin J (eds.)(eds), Open University Press: Buckinham;
272–300.
Olsson LE, Karlsson J, Ekman I. 2006. The integrated care pathway reduced the number of hospital days by half: a prospec- tive comparative study of patients with acute hip fracture.Journal of Orthopaedic Surgery1: 3.
Scottish Intercollegiate Guidelines Network, SIGN. 2009. Management of hip fracture in older people, A national clinical guideline http://www.sign.ac.uk/pdf/sign111.pdf [11 September 2015]
Shervin N, Rubash HE, Katz JN. 2007. Orthopaedic procedure volume and patient outcomes: a systematic literature review.
Clinical Orthopaedics and Related Research457: 35–41.
Siegmeth AW, Gurusamy K, Parker MJ. 2005. Delay to surgery prolongs hospital stay in patients with fractures of the prox- imal femur.Journal Bone and Joint Surgery British87: 1123–1126.
Skinner J. 2011. Causes and consequences of regional variations in health care. InHandbook of Health Economics, Pauly MV, McGuire TG, Barros PP (eds.)(2nd edn), Elsevier: New York, NY; 45–93.
Socialstyrelsens riktlinjer för vård och behandling av höftfraktur. 2003. http://www.alvsbyn.se/wp-content/uploads/2014/
03/2003-102-1_20031022.pdf [11 September 2015].
Sorbie C. 2003. Arthroplasty in the treatment of subcapital hip fracture.Orthopedics26: 337–341 quiz 342–333.
Street A, O’reilly J, Ward P. 2011. DRG-based hospital payment and efficiency: theory evidence, and challenges. InDiag- nosis Related Groups in Europe, Busse R, Geissler A, Quentin Wet al.(eds.), Moving towards transparency, efficiency and quality in hospitals, Open University Press: E Theurl; Winner H. 2007. The impact of hospitalfinancing on the length of stay: evidence from Austria.Health Policy82(3): 375–389.
Ström O, Borgström F, Kanis JA, Compston J, Cooper C, McCloskey EV, Jönsson B. 2005. Osteoporosis: burden, health care provision and opportunities in the EU.Archives of Osteoporosis6(1–2): 59–155.
Sund R, Riihimäki J, Mäkelä M, Vehtari A, Lüthje P, Huusko T, Häkkinen U. 2009. Modeling the length of the care episode after hip fracture: does the type of fracture matter?Scandinavian Journal of Surgery98(3): 169–174.
Sund R, Liski A. 2005. Quality effects of operative delay on mortality in hip fracture treatment.Quality & Safety in Health Care14: 371–377.
Sund R. 2010. Modelling the volume-effectiveness relationship in the case of hip fracture treatment in Finland.BMC Health Services Research10: 238.
Szita J, Cserhati P, Bosch U, Manninger J, Bodzay T, Fekete K. 2002. Intracapsular femoral neck fractures: the importance of early reduction and stable osteosynthesis.Injury33(3): C41–C46.
Thorngren KG. 1995. Fractures in the elderly.Acta Ortop Scand66(266): 208–210.
Turesson E, Ivarsson K, Ekelund U, Hommel A. 2003. The implementation of a fast-track care pathway for hip fracture patients.European Orthopaedics and Traumatology3: 195–203.
van Vugt AB. 2008. Richtlijn Behandeling van de proximale femurfractuur bij de oudere mens http://www.heelkunde.nl/
uploads/gt/I9/gtI9yRKuAUxcHvz1YB92sg/Behandeling-van-de-proximale-femurfractuur-bij-de-oudere-mens-2008.
pdf [11 September 2015].
Quah C, Boulton C, Moran C. 2011. The influence of socioeconomic status on the incidence, outcome and mortality of frac- tures of the hip.The Journal of Bone and Joint Surgery93(6): 801–805.