ACUTE MYOCARDIAL INFARCTION, USE OF PERCUTANEOUS CORONARY INTERVENTION, AND MORTALITY: A COMPARATIVE
EFFECTIVENESS ANALYSIS COVERING SEVEN EUROPEAN COUNTRIES
TERJE P. HAGENa,*, UNTO HÄKKINENa,b, EVA BELICZAc, GIOVANNI FATOREd, FANNY GOUDEe ON BEHALF OF THE EUROHOPE STUDY GROUP
aDepartment of Health Management and Health Economics, University of Oslo, Oslo, Norway
bCentre for Health and Social Economics, National Institute for Health and Welfare, Helsinki, Finland
cHealth Services Management Training Center, Semmelweis University, Budapest, Hungary
dCentre for Research on Health and Social Care Management, Bocconi University, Milano, Italy
eMedical Management Centre, Karolinska Institutet, Stockholm, Sweden
ABSTRACT
Percutaneous coronary interventions (PCI) on acute myocardial infarction (AMI) patients have increased substantially in the last 12–15 years because of its clinical effectiveness. The expansion of PCI treatment for AMI patients raises two questions: How did PCI utilization rates vary across European regions, and which healthcare system and regional characteristic variables correlated with the utilization rate? Were the differences in use of PCI associated with differences in outcome, operationalized as 30-day mortality? We obtained our results from a dataset based on the administrative information systems of the populations of seven European countries. PCI rates were highest in the Netherlands, followed by Sweden and Hungary. The probability of receiving PCI was highest in regions with their own PCI facilities and in healthcare systems with activity-based reimbursement systems.
Thirty-day mortality rates differed considerably between the countries with the highest rates in Hungary, Scotland, and Finland.
Mortality was lowest in Sweden and Norway. The associations between PCI and mortality were remarkable in all age groups and across most countries. Despite extensive risk adjustment, we interpret the associations both as effects of selection and treat- ments. We observed a lower effect of PCI in the higher age groups in Hungary. Copyright © 2015 John Wiley & Sons, Ltd.
Received 9 March 2014; Revised 4 May 2015; Accepted 9 August 2015
JEL Classification: I12; I14; I18; H42
KEY WORDS: acute myocardial infarction; percutaneous coronary intervention; mortality; comparative effectiveness study
1. INTRODUCTION
During the last 15 years, both percutaneous coronary intervention (PCI) and coronary artery bypass grafting (CABG) have increasingly replaced medical therapies such as thrombolysis as the preferred treatment of acute myo- cardial infarction (AMI) because of their clinical effectiveness (D’Errigoet al., 2010; Keeleyet al., 2003). Further- more, the share of AMI patients treated with PCI has increased, while the share of patients receiving CABG has decreased during the same period (Lawessonet al., 2012; Nallamothuet al., 2007). Giving priority to PCI over CABG for AMI patients is based on two arguments:firstly, PCI procedures are, in most cases, less costly than CABG in the short run (Birimet al., 2012); secondly, the relative benefits and harms of CABG versus PCI are even.
For patients with multivessel diseases, CABG is regarded as superior to PCI in the long run (Sipahiet al., 2014).
*Correspondence to: Department of Health Management and Health Economics, University of Oslo, PO Box 1089 Blindern, NO-0317 Oslo, Norway. E-mail: t.p.hagen@medisin.uio.no
Published online in Wiley Online Library (wileyonlinelibrary.com). DOI: 10.1002/hec.3263
This article addresses two questions related to the expansion of PCI treatment for AMI patients. First, how did PCI utilization rates vary across European regions, and which healthcare system and regional characteristics variables correlated with the utilization rates? Second, were the differences in use of PCI correlated with out- come, operationalized as 30-day mortality? By analyzing these two questions within the same study, our aim is to expand the understanding of the effects of different healthcare systems on procedure use and mortality in the specific patient group that we analyzed.
In both parts of the analysis, we controlled for patients’comorbidities and other relevant variables such as the economic and demographic characteristics of the home regions of the patients. Our database covered nearly 100,000 AMI patients for the period of 2007–2009, residing in 110 regions in seven European countries.
We commence by a description of relevant aspects of the healthcare systems followed by a presentation of the data, methods, and the results. Huge variations in both PCI rates and mortality across regions justify the concluding discussion of funding systems and public health measures.
2. BACKGROUND AND THEORY
Many countries in the north and south of Europe departed from the social insurance model during the middle of the 20th century and gradually implemented tax-based health insurance models. Although the social insurance models and the tax-based models have basic ideas such as universal coverage and third-party payments in com- mon, they also differ along several dimensions. In addition to the fundamentally different funding mechanisms, taxes versus social health insurance contributions, dissimilarities exist, for example, regarding redistributional efforts and the level of integration between payers and providers (Mossialos and Dixon, 2002). Alongside the differencesbetweenthe two models, we also observe dissimilaritieswithinthe models. One such difference is the level of fiscal decentralization in the tax-based models. Another important difference is the type of reimbursement system, in particular, the role and extent of activity-based funding (Streetet al., 2011). In the following, we discuss how healthcare system differences may affect our two dependent variables: utilization rates (procedure intensity) for PCI and outcome measured by 30-day mortality.
2.1. Healthcare systems and utilization rates
Numerous studies have shown that the availability of PCI differs widely, according to both socioeconomic sta- tus (Hetemaa et al., 2004; Rosvallet al., 2008; Salomaa et al., 2001) and ethnicity (Popescu et al., 2007).
Furthermore, differences in PCI rates were found in both private insurance-based and tax-based systems (Alter et al., 1999; Bernheim et al., 2007; Rosvall et al., 2008; Widimsky et al., 2010). However, most of these studies were based on data from periods where cardiac treatment facilities were less common and rationing con- sequently harder. We conducted the current study on data from 2007–2009, a period where PCI facilities in most European countries, and in all countries covered by this study, were well developed.
We investigated two healthcare system variables in explaining variation in PCI utilization rates: the type of reimbursement system and the structure of the PCI facilities. Reimbursement systems are usually described along two dimensions (Jegerset al., 2002): whether the system is retrospective or prospective and whether the system is activity-based orfixed. All seven countries applied prospective payment systems but some with elements of cost compensation. In the Finnish system, for example, there have been examples of increases in the prices that the regions set for the municipalities during a fiscal year. The following countries used activity-based funding systems: Hungary, Italy, the Netherlands, and Norway. In particular, Hungary had a strong activity-based component, as a specific fee-for-service (FFS) reimbursement for PCI procedures existed.
The Netherlands used diagnosis-related group (DRG)-based funding, while the Norwegian and the Italian models combined activity-based funding based on the DRG system with risk-adjusted capitation. Finland and Scotland usedfixed payment systems (global budgets). In Sweden, the reimbursement system differed among the counties. We hypothesized that activity-based systems, in particular FFS, would lead to higher
levels of PCI utilization thanfixed payment systems (Streetet al., 2011). The mechanism is well understood within both principal–agent theory (Laffont and Tirole, 1988) and theories of fiscal federalism (Inman, 1979). Activity-based funding will work as a price subsidy and, dependent upon how PCI is handled in the DRG system, decrease the price–cost margin of using the procedures relative to other treatments. The price effect is expected to be stronger in FFS systems (Hungary) than in DRG-based systems because the FFS- component covers the cost of the procedure fully, while the DRG price covers the average cost of a hospital stay for the specific patient group. In more of the countries, only a fraction of the DRG price is reimbursed.
The fact that access to PCI varies with distance to the services has formerly been found in Quebec, Canada, while similar effects disappeared after control for socioeconomic status in Belgium and in the USA (Perelman et al., 2009). A mechanism that may explain differences in access based on differences in distance is that phy- sicians will hesitate to send old, frail patients for PCI treatment if the distances are too long because of fear of complications. The structure of PCI facilities differed widely across the countries in the current study: Norway and Scotland stood out with very centralized structures, while Finland and Sweden had a decentralized struc- ture. The other countries were located between these extremes.
2.2. Procedure intensity and mortality
In the second step of our analysis, we investigated the association between the use of PCI and mortality. The aver- age clinical effectiveness of invasive procedures such as PCI relative to medical treatment is well documented in clinical trials. In a review by Keeley et al. (2003), when compared with in-hospital thrombolytic therapy, PCI lowered mortality from 9% to 7% after 4–6 weeks, a relative reduction of 25%. Results from real-life data are less clear, particularly in the higher age groups. An early six-country comparative study found wide variation in the use of invasive procedures, while mortality was similar in all countries (Yusufet al., 1998). A more recent study com- paring two metropolitan areas in the USA and Sweden, with significant differences in procedure intensity, con- cluded differently, as a marked positive effect of PCI on long-term survival was found (Smith et al., 2013).
Likewise, a nationwide study using Swedish and British patient registers indicated that higher levels of both primary PCI and beta-blockers contributed to the lower mortality ratios that were found in Sweden (Chunget al., 2014).
In this article, we expanded the comparative analysis of the association between PCI and mortality to include a subgroup analysis restricted to patients aged more than 84 years old. It has previously been shown that the primary success rate of PCI at older ages is lower than for younger ages (Kalaet al., 2012). In line with most former studies, we hypothesized that the statistical effect of PCI was positive, but with diminishing return, in the higher age groups.
3. DATA AND METHODS 3.1. Data
The AMI national databases included patients from the national discharge registers hospitalized for AMI (International Classification of Diseases–ICD10: I21–I22 or ICD9: 410). For the development of the data- bases, we used a common protocol and linked data from the discharge registers to data from other national rou- tinely collected data covering drug utilization and deaths (Belicza et al., 2014a; Hakkinen et al., 2013). We excluded patients if they had a known hospital admission with a main diagnosis of AMI within 365 days prior to the index admission, the length of their stay during theirfirst admission was more than 60 days, their age was below 40 or above 85 years (however, we also included patients of 85 years and above in a separate analysis), they had no national ID number or known place of residence in their own country, or they died within 2 days following the index admission (see succeeding text).
We used patient-level data in the international comparative database for all countries except Scotland and the Netherlands, where only data aggregated to a regional level were available because of national data regulations. The patient-level data were from 2007 to 2008 in Finland, Hungary, Italy, and Sweden, and from
2009 in Norway. The regional analysis was conducted using data from 2007 in Finland, Hungary, Italy, the Netherlands, Scotland, and Sweden, and from 2009 in Norway.
3.2. Variable definitions
We defined four dependent variables. In the patient-level analysis, receiving PCI within 2 days (2D_PCI) was described by a dummy variable taking the value of 1 if the patient received PCI on the admission day or on the next day, 0 otherwise. In the regional analyses, which also included data from Scotland and the Netherlands, we defined the dependent variable (2D_PCIR) as the share of patients treated with PCI within 2 days. In the patient- level analysis, we defined the outcome as 30-day mortality (30D_M). 30D_M took the value of 1 if the patient died within 30 days from the index day, and 0 otherwise. We included all causes of death. In the regional analyses, we defined the 30-day mortality rate (30D_MR) as the share of patients who died within 30 days (Moger and Peltola, 2014). In all analyses using patient-level data, we excluded patients who died within thefirst 2 days, because survival in this period was a premise for receiving PCI. In the regional-level analyses, we stan- dardized the dependent variables (2D_PCIRand30D_MR) by age and sex before running the regressions.
We divided the independent variables into two groups. Thefirst group included the individual variables:
age, gender, and a list of comorbidities. We categorized all variables. For the comorbidities, we included indi- cators on whether the comorbidity was present or not based on: (i) hospital admissions with comorbidity as the main or secondary diagnosis during the period 365 days prior to the index admission; or (ii) medication pur- chases for comorbidity during the 365 days prior to the index admission. We included a variable describing the length of hospital stay during the previous year (LOSPY), for additional risk adjustment.
The second group of variables included regional-level data. In the analyses of PCI utilization, we included variables describing the reimbursement system and the structure of the PCI facilities. We described the reimbursement system by dummy variables, usingfixed payment systems as a reference category: DRG-based payment system (DRG-based) and FFS (FFS-based). In an alternative specification, we grouped DRG-based and FFS together and formed the variableABF, still withfixed payment systems as a reference. Based on initial analyses, we chose the number of catheterization labs per 100,000 inhabitants to describe the structure of the ser- vices (CATH_LABS). Demand side variables included gross domestic product (GDP) per capita (logGDP_CAP), size of the population (logPOP), population density (logPOPDENS), education level for men (EDU_MALE), unemployment rate (UNEMPL), and the share of the population aged 70–85 years (SHARE70). Initially, we also tested a variable describing the educational level among women. This variable performed worse than the compa- rable variable for men and was dropped because of colinearity problems. As indicated, we log transformed some of the variables because of the assumption of marginally decreasing effects. The definitions of the comorbidity variables can be found in Häkkinenet al.(2013) and descriptive statistics for age, sex, and comorbidities in Moger and Peltola (2014). We present descriptive statistics for the regional variables in Table I.
3.3. Regression analyses
We estimated multilevel models with regions and patients defining the levels. In addition to the usual individual error terms, the model contained random effects for regions. These region-specific effects allowed for depen- dence between observations of patients within the region. Letqij be the binary outcome for thejth patient treated in theith region, withqij= 1 if the patient died or received PCI, 0 otherwise. The random effects model can then be formulated, for example, by following Ashet al. (2011):
qijjβ0;β;xij;ai∼Bernoulli pij
; whereln pij
1pij¼β0þx′ijβþai; (1) wherexijis a vector of patient-specific characteristics. We assumed that the outcome would follow a logit model, given the region effectai. The latter is a priori assumed to follow a normal distributionaijσ2a∼N 0;σ2a
. The main advantage of the random effect model is that it permits the inclusion of regional-level covariates, which cannot easily be included in afixed-effect model, which would be an alternative to modeling the regional
TableI.Regional-levelvariables(weightedmean,SD,andCV) Finlanda Hungarya Italya Netherlandsa Norwayb Scotlanda Swedena %(SD)CV%(SD)CV%(SD)CV%(SD)CV%(SD)CV%(SD)CV%(SD)CV Regional-levelvariables PCIrate31.2(8.53)27.841.9(9.97)23.835.7(11.80)33.148.2(8.66)18.039.7(12.1)30.518.8(7.14)37.941.1(8.75)21.3 PCIrate(age andsex standardized)
32.1(9.24)28.839.5(9.75)24.734.8(11.66)33.543.4(7.66)17.738.3(10.1)28.217.9(6.77)37.842.8(8.86)20.7 30-days mortalityrate11.4(2.93)25.816.3(2.33)14.37.4(0.56)7.68.5(1.02)12.05.4(9.96)17.713.2(2.77)21.07.9(1.48)18.9 30-days mortalityrate (ageandsex standardized)
10.6(2.41)22.618.2(3.10)17.07.5(6.60)8.89.9(1.13)11.45.5(1.11)20.114.0(3.27)23.37.2(1.29)17.8 CATH_LABS0.69(0.35)50.70.16(0.14)88.20.39(0.17)43.30.16(0.06)37.90.11(0.17)160.20.09(0.10)121.40.31(0.19)60.6 LogGDP10.27(0.15)1.59.52(0.32)3.410.21(0.12)1.2210.47(0.16)1.510.60(0.18)1.710.3(0.25)2.510.35(0.11)1.1 LogPOP12.33(0.60)4.912.98(0.49)3.813.31(1.01)7.5813.85(0.75)5.412.23(0.58)4.712.7(0.78)6.212.62(0.78)6.2 LogPOPDENS3.07(1.14)37.74.65(0.83)17.95.75(1.61)28.15.99(0.63)10.53.02(1.49)49.14.40(1.41)31.93.19(1.13)35.3 EDU_MALE15.8(5.07)32.112.65(4.39)35.730.81(30.30)10.025.06(4.40)17.627.66(8.15)29.5––28.64(4.96)17.3 UNEMPL8.38(1.86)22.38.04(3.16)39.26.95(1.78)25.73.30(0.72)21.91.91(0.33)17.24.40(0.91)20.96.24(0.90)14.5 SHARE702.52(0.17)6.82.40(0.09)3.72.68(0.13)4.82.31(0.17)7.42.38(0.13)5.32.50(0.10)4.22.61(0.10)4.0 N(regions)1920612201221 CV,coefficientofvariation;SD,standarddeviation;PCI,percutaneouscoronaryinterventions;CATH_LABS,structureoftheservices;LogGDP,grossdomesticproduct;LogPOP,size ofthepopulation;LogPOPDENS,populationdensity;EDU_MALE,educationlevelformen;UNEMPL,unemploymentrate;SHARE70,shareofthepopulationaged70–85years. a Datafrom2008. bDatafrom2009.
effects. We treated the country effects asfixed. To test the effects of reimbursement systems, we replaced the fixed-effect variable for countries with fixed-effects variables describing the reimbursement systems (DRG-based andFFS-based) in one of the specifications andABFin another.
In the regional analyses, we analyzed 2-day PCI rate (2D_PCIR), which was standardized1for age and sex.
The basic regression equation of regional PCI rates was
2D_PCIR¼β0þβ1Rrþεc (2)
whererdenoted the region,Rwas a vector of the regional variables mentioned earlier, andεcwas a country variable. As in the patient-level analyses, we included the country-level variables and, alternatively, variables describing the reimbursement systems asfixed effects.
In the patient-level analyses of 30-day mortality (30D_M), we included2D_PCIas an independent variable, in addition to the random effects regional variables andfixed-effects variables for the country. In a separate re- gression, we analyzed the marginal effects of increasing the PCI rate in the higher age groups.
In the patient-level analysis, we applied effect coding to country variables in which the reference (that is, odds ratio) is the grand mean of the sample. In the regional-level analyses, the coefficients of the country variables describe how many percentage points the PCI rate or 30-day mortality differs from the average of all countries.
3.4. Instrument variables
It is obvious that selection of patients for PCI is related to expected health outcomes including variation in expected mortality. The causal relationship between mortality and PCI may therefore work in both ways. This can be taken into account by a two-stage estimation method (Terzaet al., 2008) with instrumental variables (Hakkinenet al., 2014; Stargardtet al., 2014). Unfortunately, our data do not include good instruments such as distance to a hospital with PCI capacity (Newhouse and McClellan, 1998). However, we conducted sensitivity analysis using the hospital-level 2-day PCI rate for unstable angina as an instrument. The instrument variable described procedure intensity for patients suffering from similar, but different, conditions requiring similar treatments (Hakkinenet al., 2014). TheF-statistics of the instrument exceeded 10 (a usually assumed threshold) in all models.
4. RESULTS 4.1. Percutaneous coronary intervention utilization
The age-standardized and sex-standardized PCI rates were highest in the Netherlands (43.4%), followed by Sweden (42.8%) and Hungary (39.5%). The PCI rate was lowest in Scotland (17.9%) (Figure 1 and Table I).
The differences between the countries were lower for 30 days of PCI than for 2 days of PCI (figures not shown), indicating higher variation in the acute phase of AMI treatment than in the overall supply of services.
The intracountry regional variation measured by the coefficient of variation at the regional level was highest in Scotland (37.8) and lowest in the Netherlands (17.7) (Table I).
The probability of receiving PCI within 2 days decreased with age and with having comorbidities (figures not shown), in particular, by cardiac insufficiency (heart failure) and mental disorders. The proba- bility of receiving PCI also decreased with the patient’s length of stay last year (LOSPY) and was lower for women than for men in all countries (Table II, M5a–e). Sex differences were lowest in Hungary and Finland.
The number of catheterization labs per 100,000 inhabitants varied from 0.09 in Scotland (5 out of 12 regions had catheterization labs) and 0.11 in Norway (6 out of 20 regions had catheterization labs) to 0.69
1Only age-standardized and sex-standardizedfigures were used because we did not have comparable data on comorbidity from Scotland and the Netherlands.
in Finland where all regions had labs (Table I). The number of catheterization labs per 100,000 inhabitants at the level of regions had significant positive effects on the probability of receiving PCI across all specifications, except for the country analyses in Finland and Italy (Table II, M3–M5a–e). We also found a positive statistical effect of population size. Neither GDP per capita nor the other regional variables had significant statistical effects.
In models M6–M9 (Table II), we aggregated all patient-level data to the regional level and added data from Scotland and the Netherlands to the analyses. The analyses on the more comprehensive regional dataset confirmed the main findings from the patient-level data, as the number of catheterization labs per 100,000 inhabitants and the size of the population were associated with increased PCI rates. Replacing the country fixed-effects withfixed-effects variables describing the reimbursement system (M2, M4, M7, and M9) indi- cated that the countries with global budgets had a significantly lower PCI rate than average. In a separate spec- ification (figures not shown), we tested the effects of the two activity-based reimbursement systems, the FFS system, and the DRG-based systems, against the effects of global budgets. The activity-based systems had, after controlling for the regional-level variables, a 17% higher PCI utilization rate than the countries with global budget systems (p<0.01). As Hungary was the only country with FFS, it was not possible to distinguish the country effect from the statistical effect of the reimbursement system.
4.2. Thirty-day mortality
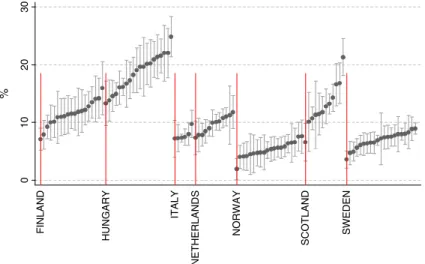
Age-standardized and sex-standardized 30-day mortality rate (30D_MR) differed considerably between the countries (Table I and Figure 2) and were highest in Hungary (18.2%), followed by Scotland (14.0%) and Finland (10.6%). We found the lowest rates in Sweden (7.2%) and Norway (5.5%). The pattern of 365-day mortality (figures not shown) were similar to 30-day mortality but with lower country differences. Regional variations were highest in Scotland (coefficient of variation = 23.3).
Thirty-day mortality was higher than the average in older age groups and was lower for women than for men for all countries except Norway (Table III, M1–M2a–e). We found excess mortality rates for several of the co- morbidities, in particular, for cardiac insufficiency, diabetes mellitus, cancer, and mental disorders (data not shown). In the individual-level analyses, patients treated with PCI had a reduced probability of death within 30 days by approximately 60% but with remarkable variations between the countries. The effects were weakest, but still high, in Hungary and Italy (Table III). The 2-day PCI rates were negatively associated with death rate in the regional-level analyses, but the effects were not significant. There can be several reasons for the
Figure 1. Two-day percutaneous coronary intervention (PCI) rate, standardized for age and sex (regional point estimates with standard deviation)
insignificant statistical effects in the regional analyses, for example, that the marginal effect of PCI varies between countries (Skinner, 2011). Of the regional variables, unemployment rate was associated positively on mortality in the analysis of the full sample and in Sweden (Table III, M1 and M2e).
We investigated the somewhat lower effects of PCI on 30-day mortality in Italy and Hungary, and the higher effects of PCI in Finland, further in age-specific analyses (Table IV). We suspected that the marginal effects of PCI were lower in the higher age groups than in the lower and that the marginal effects were particularly low in the higher age groups in countries with high PCI rates.
As in the former analyses, the probability of dying within 30 days was approximately 60% lower for those that received PCI than for those who did not across all age groups (Table IV, models with no interactions). Con- trary to our expectations, the effects of PCI were as high in the higher age groups (75–84 years and 85 years and over) as in the lower age groups (40–59 and 60–74 years). Neither did wefind a stable diminishing effect of the PCI rate. However, we observed a relatively low effect of PCI in the age group of 75–84 years in Hungary and Italy. Sweden, however, had a PCI rate for this age group as equally high as Hungary and Italy (0.27 in Sweden compared with 0.27 in Hungary and 0.23 in Italy -figures not reported in tables) and combined it with low mortality.
Table II. Variation in 2-day PCI utilization
Individual-level data (2D_PCI), odds ratios (Wald)
M1 M2 M3 M4 M5a M5b
Full sample Full sample Full sample Full sample Finland Hungary
Male 1.311*** (17.47) 1.311*** (17.47) 1.311*** (17.48) 1.311*** (17.47) 1.117* (2.51) 1.196*** (6.08) LOSPY 0.983*** (15.33) 0.983*** (15.33) 0.983*** (15.33) 0.983*** (15.32) 0.963*** (8.62) 0.988*** (6.07)
Finland 0.872 (1.18) – 0.860 (0.91) – – –
Hungary 1.464*** (3.35) – 1.163 (0.60) – – –
Italy 0.600** (2.80) – 0.483*** (3.50) – – –
Netherlands – – – – – –
Norway 0.953(0.42) – 1.289 (1.17) – – –
Scotland – – – – – –
Sweden 1.371** (2.82) – 1.607** (2.78) – – –
REIMB_DRG – 0.915 (0.92) – 0.788 (1.57) – –
REIMB_FFS – 1.281* (2.48) – 1.504 (1.89) – –
REIMB_GLOB – 0.853 (1.90) – 0.843 (1.30) – –
CATH_LABS – – 1.010*** (4.52) 1.009*** (4.21) 0.999 (0.26) 1.023*** (5.04)
LogGDP – – 0.603 (1.41) 0.611 (1.36) 0.976 (0.02) 0.624 (0.98)
LogPOP – – 1.362** (3.12) 1.375** (3.18) 1.499 (1.43) 1.189 (0.82)
LogPOPDENS – – 1.062 (1.00) 0.924 (1.53) 0.782 (1.45) 1.991* (2.53)
EDU_MALE – – 1.005 (0.44) 1.039*** (4.25) 1.034 (0.96) 0.885 (1.86)
UNEMPL – – 0.951 (1.67) 0.945 (1.94) 0.952 (0.69) 0.956 (1.67)
SHARE70 – – 0.963 (1.00) 0.983 (0.51) 1.045 (0.66) 1.004 (0.05)
Intercept – – – – – –
Age variables Included Included Included Included Included Included
Comorbidity variables
Included Included Included Included Included Included
N(patients) 98008 98008 98008 98008 14134 23820
N(regions) 86 86 86 86 19 20
Rho 0.08 0.09 0.05 0.06 0.05 0.02
AIC
Sigma_u 0.53 0.58 0.42 0.45 0.41 0.25
Ll 58241.46 58247.82 58220.81 58227.70 7766.60 14758.17
PCI, percutaneous coronary interventions; 2D_PCI, receiving PCI within 2 days; 2D_PCIR, share of patients treated with PCI within 2 days;
LOSPY, length of hospital stay during the previous year; REIMB_DRG, reimbursement for diagnosis-related group; REIMB_FFS, fee- for-service reimbursement; REIMB_GLOB, reimbursement for global budgets; CATH_LABS, structure of the services; LogGDP, gross domestic product; LogPOP, size of the population; LogPOPDENS, population density; EDU_MALE, education level for men; UNEMPL, unemployment rate; SHARE70, share of the population aged 70–85 years, AIC; Akaike Information Criterion, LI; Loglikelihood.
aThe dependent variable is standardized by age and sex.
*Significant at 10% level;
**significant at 5% level; and
***significant at 1% level.
Results from individual-level (logistic regression models) and regional-level analyses (linear regression models).
4.3. Sensitivity analysis
In most cases, the two-stage estimation with the instrument did not change the effect of PCI rate on 30-day mortality and country ordering as reported in Tables III and IV. In Hungary (0.40) and Sweden (0.27), the odds ratios were
Table II. (Continued)
Individual-level data (2D_PCI), odds ratios (Wald)
Regional-level data (2D_PCIR), regression coefficients (t-values)a
M5c M5d M5e M6 M7 M8 M9
Italy Norway Sweden Full sample Full sample Full sample Full sample
Male 1.472*** (9.85) 1.378*** (5.54) 1.429*** (13.80) – – – –
LOSPY 0.988*** (3.39) 0.977*** (5.18) 0.984*** (8.93) – – – –
Finland – – – 0.045 (1.04) – 0.008* (1.74) –
Hungary – – – 0.052 (1.21) – 0.045 (0.80) –
Italy – – – 0.039 (0.74) – 0.079 (1.48) –
Netherlands – – – 0.128*** (2.76) – 0.080* (1.69) –
Norway – – – 0.018 (0.41) – 0.086* (1.68) –
Scotland – – – 0.159*** (3.45) – 0.125*** (2.71) –
Sweden – – – 0.045*** (1.05) – 0.075* (1.68) –
REIMB_DRG – – – – 0.040 (1.01) – 0.052 (0.87)
REIMB_FFS – – – – 0.027 (0.66) – 0.038 (0.069)
REIMB_GLOB – – – – 0.068* (1.71) – 0.090* (1.70)
CATH_LABS 0.941*** (6.09) 1.012* (2.00) 1.016*** (3.47) – – 0.193*** (4.07) 0.162*** (3.89)
LogGDP 3.537e + 11*** (8.61) 0.234* (2.43) 0.235 (1.58) – – 0.016 (0.31) 0.035 (0.70)
LogPOP 0.226*** (4.05) 1.670** (2.84) 1.420* (2.30) – – 0.039** (2.07) 0.056*** (2.78)
LogPOPDENS 0.364*** (4.70) 1.032 (0.27) 0.998 (0.02) – – 0.014 (1.31) 0.001 (0.12)
EDU_MALE 0.658* (2.57) 0.992 (0.47) 0.995 (0.16) – – – –
UNEMPL – 0.500** (2.99) 0.910 (1.05) – – – –
SHARE70 – 0.746*** (3.45) 0.948 (0.42) – – 0.090 (1.12) 0.010 (0.13)
Intercept – – – 0.342*** (8.94) 0.365*** (9.47) 0.109 (0.18) 0.769 (1.25)
Age variables Included Included Included Not included Not included Not included Not included
Comorbidity variables
Included Included Included Not included Not included Not included Not included
N(patients) 17,007 8,046 35,001 – – – –
N(regions) 6 19 21 110 110 110 110
Rho 0.00 0.02 0.03 – – – –
AIC 141.7 125.3 149.9 129.8
Sigma_u 0.00 0.26 0.32 – – – –
Ll 9979.88 4602.51 20793.22 – – – –
Figure 2. Thirty-day mortality, standardized for age and sex (regional point estimates with standard deviation)
even smaller compared with the estimation results from the model in which PCI was assumed to be exogenous (Table III). In Italy, the effect was clearly smaller (0.82). Similar trends existed also in the age group specific results.
5. DISCUSSION
The use of PCI on AMI patients has increased substantially in the last 12–15 years because of the procedure’s clinical effectiveness. This article has addressed two questions related to the expansion of PCI treatment for AMI patients. First, how did PCI utilization rates vary across European regions, and which healthcare system and regional characteristic variables correlated with the utilization rates? Second, were the differences in use of PCI associated with outcome, operationalized as 30-day mortality?
Although we analyzed variation in a period in which PCI facilities were well developed (2007–2009), we found large variations in PCI utilization rates both across and within countries. PCI rates were highest in the Netherlands, followed by Sweden and Hungary. Within countries, regional variation was highest in Scotland.
We investigated the associations between two healthcare system variables and PCI utilization rates: the struc- ture of the PCI facilities and the type of reimbursement system. Both variables affected the probability of re- ceiving PCI. The probability of receiving PCI was highest in regions with high catheterization capacity. The weaker statistical effects of this variable in Finland and Italy probably reflected that all regions had PCI facil- ities and that the regional variation consequently became small (the data from Italy covered only six regions, all located in metropolitan areas). The statistical effect of reimbursement systems was also strong. The regions with (partly) activity-based reimbursement systems had a 17% higher PCI rate than global budgeting systems.
Two limitations in the analyses of PCI rates should be mentioned. Firstly, the operationalization we have chosen with the use of dummy variables describing reimbursement systems will partly capture country differences because only one of the countries (Sweden) has regional variation on this variable. Secondly, PCI can be handled differently in the DRG systems across the countries. We do not have information that describes these differences.
Thirty-day mortality rate differed also considerably between the countries with the highest rates in Hungary, followed by Scotland and Finland. Mortality was lowest in Sweden and Norway. Regional variations were highest in Scotland. Receiving PCI was, together with age and comorbidities, a strong predictor of individual-level mortality. After risk adjustments, receiving PCI reduced the probability of 30-day mortality by approximately 60%. Despite the extensive risk adjustment, we interpreted the effect as a combination of se- lection and treatment effects. Our use of instrumental variables did not seem to reduce the selection problem.
We considered other alternatives, but the most relevant alternative with the use of distances from home to hos- pital as instrument was not available for our study. The regional-level analyses indicated weaker associations.
Regions with higher PCI rates had lower mortality rates but the statistical effect was insignificant.
The effects of PCI on mortality on individual level were manifest in all age groups and across most of the countries. However, we did observe a lower association between PCI and mortality in the age group of 75–84 years in Hungary, and partly in Italy, than in the other countries. A cost-effectiveness study is beyond the scope of this paper, but the findings motivate a further investigation into the relationship between the FFS system, the PCI rate, and the mortality rate in Hungary. The high AMI mortality rate in Finland was also surprising as it deviated significantly from the neighboring Nordic countries. A possible explanation may be related to the lack of acute services at more of the Finnish central hospitals during nighttime. Thisfinding needs further investigation as well.
Our results were obtained from a large dataset based on the administrative information systems of entire populations of seven European countries. While the dataset did not contain all the variables to fully control for confounding, to our knowledge, it is the largest patient-level dataset on the use of PCI and its association with 30-day mortality. It confirms widely unexplained variations in PCI intervention rates. It also confirms that patients receiving PCI have lower mortality, thus providing real-life evidence of the effectiveness of this intervention.
TableIII.Randomeffectmodelsof30-daymortality Individual-leveldata(30D_M),oddsratios(Wald)Regional-leveldata(30D_MR), regressioncoeff.(t-values) M1M2aM2bM2cM2dM2eM3M4 FullsampleFinlandHungaryItalyNorwaySwedenFullsampleFullsample Male1.166***(5.58)1.26***(3.43)1.07(1.40)1.14(1.67)0.93(0.55)1.20***(3.60)–– LOSPY1.010***(10.74)1.01***(3.98)1.01***(4.10)1.01***(3.84)1.01**(2.74)1.01***(7.49)–– 2D_PCI0.419***(24.88)0.25***(12.21)0.50***(13.40)0.51***(6.68)0.34***(5.86)0.39***(14.03)–– 2D_PCIR–––––––0.01(0.72) Finland1.206**(3.19)–––––0.02(1.57)0.01(0.97) Hungary1.945***(8.22)–––––0.06***(4.18)0.04***(3.00) Italy0.688***(4.61)–––––0.02(1.38)0.04**(2.58) Netherlands––––––0.02(1.07)0.01(0.40) Norway0.775**(3.04)–––––0.05***(3.08)0.02(1.29) Scotland––––––0.02(1.47)0.03**(2.23) Sweden0.800***(3.38)–––––0.03*(1.61)0.03**(2.06) LogGDP0.994(0.04)0.40(1.54)0.76(1.20)0.03(1.38)0.23*(2.42)1.011(0.91)–0.01(1.10) LogPOP1.096*(2.51)1.05(0.39)1.04(0.47)1.01(0.57)1.59**(3.05)1.24***(4.19)–0.01*(1.82) LogPOPDENS1.003(0.11)1.02(0.34)0.87(1.11)1.07(0.15)0.97(0.39)0.94(1.60)–0.00(0.14) EDU_MALE0.993(1.23)1.00(0.21)1.04(1.52)0.89(0.36)0.99(0.63)0.99(0.56)–– UNEMPL1.028**(2.68)1.02(0.55)1.02(1.86)0.90(1.10)0.75(1.35)1.07*(2.04)–0.01***(4.61) SHARE701.022(1.69)0.99(0.55)1.02(0.77)-0.76***(3.76)1.06(1.09)–0.01(0.51) Intercept––––––0.10***(1.61)0.41**(3.32) N98,00814,13423,82017,007804635,001–– N_g86.0019.00020.0006.00020.00021.000110110 Rho0.000.0030.0000.0000.0000.000–– sigma_u0.080.0960.0000.0000.0010.001–– Ll21,711.983647.0437086.7772912.1071185.8756610.804–– AIC––––––501484 30D_M,30-daymortality;30D_MR,30-daymortalityratestandardizedbyageandsex;2D_PCI,receivingPCIwithin2days;2D_PCIR,shareofpatientstreatedwithPCIwithin2days; LOSPY,lengthofhospitalstayduringthepreviousyear;LogGDP,grossdomesticproduct;LogPOP,sizeofthepopulation;LogPOPDENS,populationdensity;EDU_MALE,education levelformen;UNEMPL,unemploymentrate;SHARE70,shareofthepopulationaged70–85years. *Significantat10%level; **significantat5%level;and ***significantat1%level. Resultsfromindividual-level(logisticregressionmodels)andregional-levelanalyses(linearregressionmodels).Coefficientsofageandco-morbidityvariablesnotreportedinindividual levellogisticmodel.
TableIV.Theeffectof2-dayPCIrateandcountryvariableson30-daymortalitybyagegroups Age40–60Age61–74Age75–84Ageover84 PooledsampleNational samplesPooledsampleNational samplesPooledsampleNational samplesPooledsampleNational samples No interactionsWith interactionsNo interactionsWith interactionsNo interactionsWith interactionsNo interactionsWith interactions PCI0.459***0.437***–0.426***0.460***–0.389***0.307***–0.411***–– PCIFinland––0.238***––0.240***––0.256***––0.640 PCIHungary––0.467***––0.494***––0.493***––0.386*** PCIItaly––0.600––0.576***––0.472***––0.487*** PCINorway––0.519––0.395***––0.289***––0.321*** PCISweden––0.573**––0.411***––0.339***––0.374*** Finland1.402***1.732***–1.318***1.443***–1.222***1.244***–1.021–– Hungary2.280***2.186***–2.223***2.17***–1.970***1.870***–1.865***–– Italy0.674***0.649***–0.721***0.707***–0.9200.907–0.954–– Norway0.441***0.423***–0.584***0.572***–0.631***0.644***–0.709***–– Sweden1.0190.961–0.807***0.786***–0.716***0.735***–0.777***–– PCI*Finland–0.439**––0.491***––––––– PCI*Hungary–––––––1.669***–––– PCI*Italy–––––––1.412*–––– PCI,percutaneouscoronaryintervention. *Significantat10%level; **significantat5%level;and ***significantat1%level. Logitmodelestimationfrompooledandcountryspecificdata.Oddsratios.Onlysignificantcountryinteractionreported.Coefficientofageandcomorbidityvariablesnotreported.