ContentslistsavailableatScienceDirect
Health Policy
jo u r n al h om ep a ge :w w w . e l s e v i e r . c o m / l o c a t e / h e a l t h p o l
Health care performance comparison using a disease-based approach: The EuroHOPE project 夽
Unto Häkkinen
a,∗,1, Tor Iversen
b,1, Mikko Peltola
a,1, Timo T. Seppälä
a,1, Antti Malmivaara
a,1, Éva Belicza
c,1, Giovanni Fattore
d,1, Dino Numerato
d,1, Richard Heijink
e,1, Emma Medin
f,1, Clas Rehnberg
f,1aNationalInstituteforHealthandWelfare,CentreforHealthandSocialEconomics(CHESS),Helsinki,Finland
bTheUniversityofOslo,TheDepartmentofHealthManagementandHealthEconomics,Oslo,Norway
cSemmelweisUniversity,Budapest,Hungary
dBocconiUniversity,DepartmentofPolicyAnalysisandPublicManagement,CERGAS–CentreforResearchinHealthcareManagement, Milano,Italy
eNationalInstituteforPublicHealthandtheEnvironment,CentreforPreventionandHealthServicesResearch,Bilthoven,The Netherlands
fMedicalManagementCentre,KarolinskaInstitutet,Stockholm,Sweden
a rt i c l e i n f o
Articlehistory:
Received1November2012
Receivedinrevisedform12April2013 Accepted17April2013
Keywords:
Performancemeasurement Healthcare
Disease-basedapproach Episode
Outcome Cost
a b s t ra c t
Thisarticledescribesthemethodologicalchallengesassociatedwithdisease-basedinter- nationalcomparisonofhealthsystemperformanceandhowtheyhavebeenaddressedin theEuroHOPE(EuropeanHealthCareOutcomes,PerformanceandEfficiency)project.The projectuseslinkablepatient-leveldataavailablefromnationalsourcesofFinland,Hungary, Italy,TheNetherlands,Norway,ScotlandandSweden.Thedataallowmeasuringtheout- comeandtheuseofresourcesinuniformly-definedpatientgroupsusingstandardized riskadjustmentproceduresintheparticipatingcountries.Theprojectconcentratesonfive importantdiseasegroups:acutemyocardialinfarction(AMI),ischemicstroke,hipfracture, breastcancerandverylowbirthweightandpreterminfants(VLBWI).Theessentialsofdata gathering,thedefinitionoftheepisodeofcare,thedevelopedindicatorsconcerningbase- linestatistics,treatmentprocess,costandoutcomesaredescribed.Thepreliminaryresults indicatethatthedisease-basedapproachisattractiveforinternationalperformanceanaly- ses,becauseitproducesvariousmeasuresnotonlyatcountrylevelbutalsoatregionaland hospitallevelacrosscountries.Thepossibilityoflinkinghospitaldischargeregistertoother databasesandtheavailabilityofcomprehensiveregisterdatawilldeterminewhetherthe approachcanbeexpandedtootherdiseasesandcountries.
© 2013 The Authors. Published by Elsevier Ireland Ltd.
夽 OpenAccessforthisarticleismadepossiblebyacollaboration betweenHealthPolicyandTheEuropeanObservatoryonHealthSystems andPolicies.
∗ Correspondingauthorat:NationalInstituteforHealthandWelfare, CentreforHealthandSocialEconomics(CHESS),Mannerheimintie166, 00270Helsinki,Finland.Tel.:+358295247327;fax:+358295247537.
E-mailaddress:unto.hakkinen@thl.fi(U.Häkkinen).
1 OnbehalfoftheEuroHOPEStudyGroup.
1. Introduction
Internationalcomparisonofperformancecanproceed at a number of possible levels, including systemwide, bydisease,andbysub-sector(suchashospital ornurs- inghomes)[1].Thereareargumentsforandagainsteach, butwhenitcomestohealthoutcomesthedisease-based approachisthemostsuitable,sincethehealthgainsofthe activitiescanbemeasuredquiteaccuratelyatthedisease level [2].Compared withsystemwide comparison, this approachreducesheterogeneityofthepopulationstudied 0168-8510© 2013 The Authors. Published by Elsevier Ireland Ltd.
http://dx.doi.org/10.1016/j.healthpol.2013.04.013
Open access under CC BY-NC-SA license.
Open access under CC BY-NC-SA license.
Table1
EuroHOPEinanutshell.
Projectname EuropeanHealthCareOutcomes,PerformanceandEfficiency(EuroHOPE).
Maintask Tocontemplateandcomparenationalaswellasinternationaldifferencesinfiveeconomicallyimportantpatient groupswithrespecttoeffectivenessandefficiencyoftheirwholecycleofcare.
Patientgroups Acutemyocardialinfarction,stroke,hipfracture,breastcancer,andverylowbirthweightandverypreterminfants.
Coordinator NationalInstituteforHealthandWelfare,Finland.
Partners KarolinskaInstitutet,Sweden;RagnarFrischCentreforEconomicResearch,Norway;UniversityofOslo,Norway;
UniversityofEdinburgh,UK(Scotland);UniversitaCommercialeLuigiBocconi,Italy;SemmelweisUniversity, Hungary;NationalInstituteofPublicHealthandEnvironment,Netherlands.
Duration 4years,2010–2013.
andallowsmorepreciseidentificationofthecharacteristics of the health care process that have an effect on outcomes.
Allinternational comparisons require suitable infor- mation systems. These systems have until now been developed using two different approaches. The first approach relies on developing a coherent conceptual framework for information collection, analysisand dis- semination. Anexample of this is national accounts, in whichhealthcareisdealtasapartofthewholeeconomy.
Anotherapproachassemblesreadilyaccessibledata,often theby-productsofexistingnationaldatacollection,suchas hospitaldischargeregisters,aswellasworkthathasbeen doneforotherpurposes.Thebottom-upapproachrelieson individualexperts,providerorganizations,andcountries engaginginqualityandefficiencyimprovementinitiatives.
Micro-level comparative data on clinical actions, costs andoutcomesrepresentsanessentialelementofsuchan approach.Inthiscase,theprecisedefinition,collectionand scrutinyofthedataarelefttoexpertgroupstodetermine [3].
Adesirablehealthcareperformancemeasureatthedis- easelevelisonethatreliablyandaccuratelyreflectsthe process,costsand outcomeof care[4]. Sucha measure provides valuable information for improving treatment processesandforsteeringatnational,regionalaswellas hospitallevels.Inaddition,measuresthatenablereliable comparisonsacrossprovidersmight encourage them to developtheirtreatmentprocessestoattainbetterposition- inginbenchmarking.
Bymakinguseofavailabledatabasesthroughamicroe- conomicdisease-basedapproach,2theEuroHOPEproject (EuropeanHealthCareOutcomes,PerformanceandEffi- ciency,Table 1)evaluatestheperformance of European healthcaresystemsintermsofoutcomes,quality,useof resourcesandcost.EuroHOPEusespatient-leveldataavail- ablefromlinkablenationalorregionalregistersandother datasourcesthatallowformeasuringtheoutcome(byfol- lowingwhathappenstopatients)andtheuseofresources (suchascost,numberofhospitaldays,treatmentwithspe- cificproceduresanddrugs)intheselectedwell-definedand riskadjustedpatientgroups.3Thus,EuroHOPEisnotonly
2 TheEuroHOPEprojectappliessub-sectorapproachtoNordichospi- tals.Thiswillbediscussedelsewhereinthisissue[29].
3 Thisideaisnotnovel,however.Forexample,Eurostat[30]hasdefined theoutputinhealthcare:“Healthoutputisthequantityofcarereceivedby patients,adjustedtoallowforthequalitiesofserviceprovided,foreach typeofhealthcare.Thequantitiesshouldbeweightedtogetherusing dataonthecostsorpricesofthehealthcareprovided.Thequantityof
focusingonaspecifictreatmentorhospitalstay(measured e.g.intermofDRGs)[5]perse,butratheronoutcomesand costsrelatedtothecompleteclinicalpathway.
Usingregisterdataitisnotpossibletoconsiderpatient orproviderexperiences.Forexample,noinformationon health-relatedqualityoflifenorpatientsatisfactionisrou- tinelyavailableintheregistersandthuscannotbeused forenrichingcomparisonsbetweenregionsorhospitals.In ordertofillthegap,feasibilitystudiesmakinguseofpatient surveysonhealth-relatedqualityoflifeand patientsat- isfactioninselectedhospitalsineachcountryhavebeen initiatedinEuroHOPE.4
Theprojectconcentratesonfivediseasegroups:acute myocardialinfarction(AMI),ischemicstroke,hipfracture, breast cancer and very low birth weight and preterm infants(VLBWI).Theapproachisbasedonanalysingthe progressofadisease,withspecificinterestintheroleof health servicesand health carepolicyas adeterminant oftheprogress.Themainideaoftheapproachisthatit analysesperformancebyusingdetaileddatapertainingto specifichealthconditionstoilluminatetheinterconnected aspects(i.e.financing,organizationalstructures,medical technologychoices)thatareresponsibleforhealthsystem performance(i.e.healthoutcomesandexpenditure).Ofthe sevencountriesparticipatinginEuroHOPE,fivecountries are consideredas tax-based systems andtwo countries relyonsocialhealthinsurance.Twoofthetax-basedsys- tems,NorwayandScotland,mainlyrelyoncentraltaxation, whereas the otherthree, Finland,Italy and Sweden, in various ways rely on regionaland local taxes. The two countrieswithsocialinsurancesystemsalsodifferasThe Netherlandsrelyonasystemwithmultipleinsurersand regulatedcompetitionamongthem,whereastheHungar- iansystemisasocialhealthinsurancesystemwithasole insurerwithamonopsonypower.
This article describes the methodological challenges of international comparisonsrelated to a disease-based approach andhow theyareaddressedintheEuroHOPE project. The project is based on merged register data.
Thus,thisarticleshowshowexistingdatasourcescanbe
healthcarereceivedbypatientsshouldbemeasuredintermsofcomplete treatments¨.
4Feasibilitywillbestudiedintwodifferentdimensions:inestablishing commonprotocolsforsurveydatacollectionindifferingcountries,and incollectinginformationindifferingpatientgroups.Forhealthrelated qualityoflifetwodifferentmeasuresEQ-5Dand15Dandforpatientsat- isfactionEORTC-IN-PATSAT32havebeenutilisedtogetherwithcollection ofrichbackgroundinformation.
Naonal discharge register
Naonal mortality register
Other naonal registers
Naonal EuroHOPE
database
Naonal EuroHOPE comparison
data
Anonymous individual level
data used for comparave
research Internaonal
EuroHOPE comparison
data
National research and benchmarking
EuroHOPE research and benchmarking Protocols
defined by disease experts
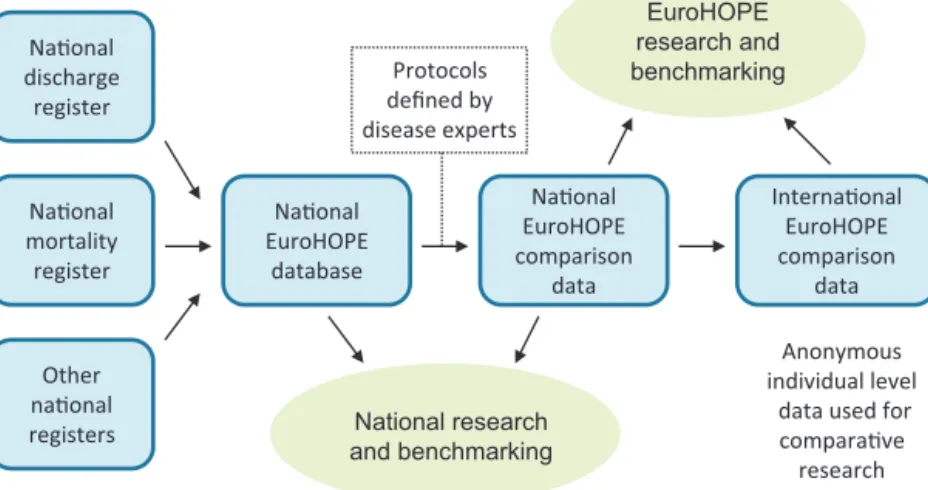
Fig.1. EuroHOPEdatabases.
exploited in performance analysisusing the bottom-up approach.
2. Methodologyanddata
Aperformancemeasuremustbecarefullyconstructed andbeappropriateforcomparisonsinordertobeuseful.
Therearemanyimportantandwell-documentedmethod- ologicalandpracticalquestionsthatneedtobeconsidered whenadministrativedataareusedforperformancemea- surement[6–9].Performanceindicatorswillvarydueto typeofhospital,regionalorindividuallevelvariationsor random variation. The focus of ourinterest is in varia- tion atthehospital,regional leveland countrylevel. In EuroHOPE,cross-countryheterogeneity(e.g.incomorbid- ityconditions)isreducedbyusingproperriskadjustment methodsforindividual-leveldata.
Implementing register-based performance evaluation requires–inadditiontotheavailabilityofcomprehensive data – methodological understandingand a multidisci- plinaryinvolvement.Healthsystemknowledgeisessential for deciding thescope and thespecific questions tobe addressed, and needsto be supplemented with under- standing of the possibilities and limitations of register information [10]. Clinical knowledge is needed when appraisingdetailsoftheindicationandmanagementofa disease,andeconomic,epidemiological,statisticalanddata miningexpertisearerequiredtoensurethatthemethod- ologyisappropriate.Finally,alltheaforementionedmust beintegratedduringtheentireprocess.InEuroHOPE,the performanceindicatorshave beendeveloped incollabo- rationwithclinicalexpertsforallthediseasesinfocusas wellaswithexpertsinhealtheconomics,epidemiologyand statistics.
ThefiveEuroHOPEdiseasegroupswerechosenbecause theyhavehighprevalence,healthimpactorhigheconomic burdeninalldevelopedcountries(AMI,ischemicstroke, hipfracture,breastcancer[11]),ortheyareveryresource intense(VLBWI).Differentpopulationsareinfocus,such astheelderly(AMI,ischemicstroke,hipfracture),middle aged(breastcancer)andnewborn(VLBWI)ortheriskfor
theconditionsdifferbysex(AMI,hipfractureandbreast cancer).Thediseasesdifferintheinvolvementofdifferent typesofspecialities, regarding eithersurgicaltreatment or outpatient pharmaceutical treatment, and also with respecttotechnologicalchange.Asa result, theimpact ofhealthsystemcharacteristics(financing,organization, technology,etc.)canbetestedacrossadiversesetofareas, creatinga stronger,morecomprehensiveevidencebase.
Thechoiceisalsobasedonapre-enquiryandtheassump- tionthatthesediseasesofferthebestpossibilitiestoaccess internationallycomparativedata,sinceinallofthediseases themainresponsibilityforpatienttreatmentfallstoacute hospitalcare.
Wedevelopedaninternationalcomparativedatabase thatallowsperformanceanalysis,researchanduseindi- catorscalculatedatnational,regionalandhospitallevels (Fig.1).Thedisease-basedapproachrequirespatient-level data covering the wholepopulationand thepossibility todeterministicallylinkrecordsindifferentnationalreg- isters. In the six included countries (Finland, Hungary, theNetherlands,5Norway,SwedenandScotland)included intheEuroHOPEprojectitwaspossibletolinknational hospital-dischargeregisterswithmortalityregistersand infivecountries(excludingScotland)alsowithregistersof prescribedmedicines(Table2).InItaly,similardatawere availablefortwogeographicalareas.Alldatabasespresent populationdatareflectingpatternsofcareandoutcomes oftheentirepopulationresidinginthedefinedterritories.
Foreachdisease,thebuildingofthedatabaseisbased onseveralstages:(i)definitionofthepatientpopulation, (ii)collectionoftheregistermaterialforthepatientpop- ulationathand,(iii)definitionofthestartandendofthe episode(bydefiningand usingtheindexadmissionand decidinghowreferralsshouldbetreated)forthepatients andfromthenecessaryvariablesconcerningthecaregiven, (iv)checkinghistoryandfollow-upoftheuseofhealthcare servicesinordertodefinestateandtimevariablesforthe
5 IntheNetherlandsthedataisavailableofabout85%ofthepatients, sincecollectionofnationaldischargedataisvoluntary.
Table2
RegistersusedinEuroHOPE.
Country Registername(yearsinceincludedinEuroHOPE) Sub-studiesinwhich
theregisterisused
Finland Hospitaldischargeregister 1–5
Causeofdeathregister 1–5
Drugprescriptionregister 1–5
Cancerregister 4
Medicalbirthregister 5
Datafileonsmallpreterminfants 5
Registerofcongenitalmalformations 5
Hungary Hospitaldischargeregister 1–5
Deathregister 1–5
Prescribedmedicineregister 1–5
Cancerregister 4
Childbirthregister 5
Italy Hospitaldischargeregister 1–5
Causesofdeathregister 1–5
RegisterofmedicineprescribedanddispensedbytheItalianNHS 1–5
Outpatientservicesinspecialistcareregister 1–5
Cancerregister(onlycityofTurin) 4
Medicalbirthregistry(onlyprovinceofRome) 5
The Netherlands
Hospitaldischargeregister 1–3,5
Causesofdeathregister 1–3,5
Prescribeddrugregister 1–3,5
TheNetherlandsperinatalregistry 5
Norway Norwegianpatientregister 1,3–5
Norwegianprescriptiondatabase 1,3–5
Nationalcancerregister 4
Causeofdeathregister 1,3–5
MedicalbirthregistryofNorway 5
TheNorwegianhipfractureregister 3
Scotland Scottishmorbidityrecord00–outpatientattendance 1–5
Scottishmorbidityrecord01–generalacuteinpatientanddaycase 1–5
NationalrecordsofScotlanddeathextract 1–5
Scottishopencancerregistrationandtumorenumerationsystem 4
NationalrecordsofScotlandbirthextract 5
Scottishbirthrecord 5
Scottishmorbidityrecord02–maternityinpatientanddaycase 5
Sweden Nationalpatientregister 1–5
Nationalcauseofdeathregister 1–5
Nationalprescribeddrugregister 1–5
Nationalcancerregister 4
Nationalmedicalbirthregister 5
Sub-studies:1AMI,2stroke,3hipfracture,4breastcancer,5verylowbirthweightandverypreterminfants.
patients,(v)constructionofthecomorbidityvariables,(vi) calculationofthedirecthealthcarecost,andfinally,(vii) combinationoftheinformationofthepreviousstagesin ordertogeneratethecomparisondatabase.
3. Thedevelopmentofperformancemeasurement 3.1. Episodeofcare
Theconceptofanepisodehasbeenusedtodistinguish betweendischargeandsingleintervention.Theideaofan episodeapproachisnotnew[12,13],buttheimplementa- tionofthisconcepthasbeenchallenginginpractice[14]
andhasnotbeendonebeforeinsuchalargescale.
Anepisodeofcarereferstotheentiretreatmentpattern fromthebeginningofthedisease(e.g.timeofdiagnosis) totheendofthetreatmentacrossorganizationalbound- ariestofacethehealthproblemathandinaspecifictime
frame.Thustheprotocolforanepisodeincludesthedefini- tionsofstartingandfinishingdates(follow-uptime)aswell asinclusionandexclusioncriteria,whichareusedwhen constructingacomparisondatasetforaspecificdisease group.
InEuroHOPE,thefollow-updatacoversatleastoneyear foreachpatient.Mainobservableeventsinregisterdata areprocessmeasuressuchasadmissions,procedures,and dischargesaswellasoutcomesmeasuressuchassurvival.
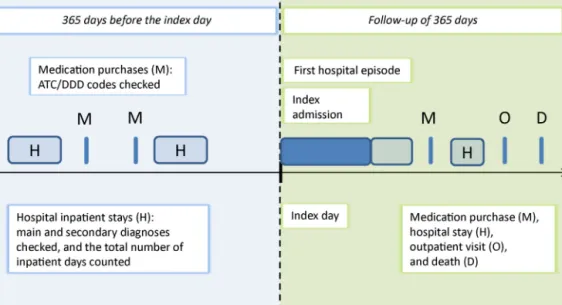
Secondaryobservableeventsareoutpatientvisitsandpre- scribedmedicationpurchases.Inadditiontothefollow-up data,wehavesimilarinformationonthehistoryofservice useofthepatients.Usingtheavailabledataitispossible toreconstructtreatmentpathwaysthatdescribewhathas happened(beforeand)aftere.g.anoperationonadaily basis[10](Fig.2).
Episodeofcareprovidesaframeworkthatcanbeopera- tionalizedin terms oflinkableregisterdata.In orderto
Fig.2.DiagramofdatautilizationinEuroHOPE.
modeltheepisodeofcareandcalculatethemeasuresof performance, thenatureofthediseaseand themedical history andcomorbiditiesofthepatientsmustbetaken intoaccount,allkeyfactorsaffectingtreatmentdecisions, deliveryofcare,andoutcomes.
TheepisodesforAMI,ischemicstroke,andhipfracture startwithanacutephase inthehospital,usuallyoccur- ringimmediatelyaftertheevent.InthecaseofVLBWIand breast cancertheepisode startswithbirth ora disease event,respectively,followedbyhospitaluse. Thehospi- taladmissionthatisthefirstintheepisodeofcareisin ourterminologydefinedastheindexadmission,andthe admissiondaytheindex day.The firsthospital episode startsontheindexdayandterminatesatthedayofthefirst dischargetohome,orbydeath,orafteraspecifiedtimeof continuousinpatientcare,dependingonthedisease.The firsthospitalepisodedescribestheacute-phaseoftreat- ment.Thefollow-upperiodendsoneyearaftertheindex dayoratdeath.Thetotalepisodeofcareincludesallthe healthserviceusedduringthefollow-upperiod(Fig.2).For AMI,ischemicstrokeandhipfracturepatients,theindex day(i.e.thebeginningofepisode)isdefinedbymeansofthe maindiagnosisofthehospitalstay(AMIICD-10-codesI21- I122,ischemicstrokeI63,hipfractureS72.0-S72.2)usingat leasttwoexclusions.First,weexcludeallpatientswhohave hadahospitaladmissionrelatedthediseaseinquestion duringtheprevious365daysbeforetheindexday.Second, weexcludenon-residentsandpatientswithanincomplete personalidentitynumber(PID).
3.2. Indicators
The benchmarking taskof the projectis carried out through basic reports (availableonthe internet) which include performance indicatorsat nationaland regional level.Theindicatorspresentedinthedisease-specificbasic reports can be roughly categorized into four different
groups:baselinestatistics,processindicators,costindica- tors,andoutcomeindicators.
Ineachdisease-specificanalysis,thebaselinestatistics ofthepatientpopulationineachcountryandregionare given.Theseinclude,e.g.thenumberofpatientsaffected bythedisease,meanandmedianageandproportionof malesandfemales.
3.2.1. Process
Theprocessindicatorsdescribehealthcareserviceuse duringtheepisodeofcare.Theindicatorsincludemeas- uressuchaslengthof stayinhospitals(infirsthospital episodeandduringthefollow-upperiod),proceduresand othertreatmentpractices,anduseofprescribedmedicines.
3.2.2. Costs
The cost indicators describe the cost of first hospi- talepisode and thetotal episode of care. Ideally, there would be detailed cost calculations for each individual patientavailableandstandardizedmethodofcostcalcu- lationsacrosscountries.Althoughmanyofthecountries areusingDiagnosticRelatedGroups(DRGs)ora similar systemtocalculateresourceuserelatedtostandardized patients,thereisnocommonmethodofgroupingpatients [15]andDRGtariffsmaynotaccuratelyreflectcosts.Since Geueetal.[16]showthatthecostingmethodmayhave animportant impactonhow theeffects of explanatory variablesoncostareassessed,itisimportanttofindmeas- uresthatareconsideredtobevalidandcomparable.Asa prerequisiteeachcountryshouldbecapableofproviding thenecessarydatainput.InEuroHOPE,thecostanduti- lizationmeasuresareingenerallimitedtohospitalcare (inpatientandoutpatient)andpharmaceuticalsdispensed outsidehospital.
Twoapproachesthataredesignedtocomplementeach otheraresetup.Inthefirstapproach,theessentialcom- ponentsofresourceuseduringthehospitaltreatmentare definedandextractedfromregisterdataattheindividual
Table3
DescriptionofregionsusedinEuroHOPEreporting.
Country Description Numberofregions Averagepopulationsize
Finland Hospitaldistrictsandhospitalregionsresponsiblefor providingspecializedhealthcare.Smallestdistricts combined.
19 280,000
Hungary 19countiesandBudapestareaproviding
self-governmentaladministrativeduties(nothealthcare).
20 500,000
Italy CityofTurinandprovinceofRome(dividedintotwo smallerunits:cityofRomeandoutsideofRome municipalities).
3 1,630,000
TheNetherlands Provincesresponsibleformattersofsubnationalor regionalimportance(nothealthcare).
12 1,380,000
Norway Hospitaltrustsresponsibleforprovidingspecialisthealth careintheirgeographicalareas.
20 250,000
Scotland Healthboardsresponsibleforhealthcare.Smallestboards combined.
14 370,000
Sweden Countiesresponsibleforprovidinghealthcare. 21 450,000
patientlevel.Thenaresourceweightisattachedtoeach component.Resourceweightsarebasedonpatientlevel costdatafromSweden[17].Thefirstcostcomponentis theprocedure/treatmentgivenduringthehospitalstay.For instance,forAMI,treatmentwithcoronaryarterybypass surgery(CABG)and percutaneouscoronaryintervention (PCI)areregisteredandresourceweightsareattachedto them.Anothercomponentisthenumberofhospitaldays, withacostweightattachedthatdescribesthebasiccost ofahospitalday.Inpatientstaysformaindiagnosesother thanAMIareassessedbyacostperdaycorrespondingto themeancostperdayforalladmissionsregisteredinthe costperpatientdatabase.Alloutpatientconsultationsare registeredandweightedbythemeancostofanoutpatient consultation.Eurostatpurchasingpowerparities(PPP)for hospitalservices[18]areusedtoconvertcoststothecost levelintheEU15.
Inthesecondapproach,eachcountrymakesuseoftheir bestavailabledatatocalculatehospitalcostsattheindi- vidualpatientlevel.Somecountriesmaytakeadvantageof costdataattheindividualpatientlevel,whileothersare usingclassificationsystems(e.g.,DRGs)andrelatedtariffs asproxiesofcosts.Resultsofapproachoneandapproach twoaresupposedtosupplementeachotherinthecompar- ativeanalysesofcostsacrosscountries.Inbothapproaches, thecostof pharmaceuticals dispensedoutside hospitals isrecordedatpharmacysellingpriceasregisteredinthe nationalpharmaceuticaldatabases.Then,thePPPforeach country’sGrossDomesticProduct(GDP)isusedtoadjust forcostlevelineachcountry.
3.3. Outcomes
IntheEuroHOPEprojectoutcomeindicatorsarecon- sideredthosemeasuresofhealththatareattributableto healthcare. Themostimportant outcomemeasuresare mortalityatthe30-day,90-dayandone-yearfollowup.In addition,weuseotheroutcomemeasurescalculatedfrom registerssuchasreadmissionandcomplications,sinceit
isgenerallyagreedthatthesehaveanimpactonpatient outcomes.
3.3.1. Regionalcomparison
We calculate indicators by countries and within countries by regions. The regional indicators are based onpatients’placeofresidence.Eachcountryhasdefined the partition of its regions to be suitable for bench- marking(Table3).InFinland,Italy,Norway,Scotlandand Swedentheregionsdescribelocalauthoritiesresponsible forhealthcare,whileinsocialhealthinsurancecountries (theNetherlandsandHungary)theregionsarebasedon regionalgovernmentalorsub-nationalgeographicaldivi- sion where publicauthorities have no (Netherlands) or limitedresponsibilityofhealthcare(Hungary).Inthelast mentioned countries,theaveragepopulationsizeofthe regionsismuchgreaterthanintheNordiccountriesand Scotland.However,inallcountriesthemetropolitanareas areconstructedsothattheyenableinternationalcompar- ison.
3.4. Riskadjustment
When comparing countries, regions, hospitals, and yearlypatientcohorts,patient-associatedfactorsmustbe accountedfor.EuroHOPEhasendeavoredtoensuremean- ingfulcomparisonsusingthreesteps.Firstly,thedisease groups havebeen definedsothattheyare ascompara- bleandhomogeneousaspossible.Secondly, information onriskfactorshasbeengatheredfromthepatients’medi- calhistory.Thirdly,statisticalmodelshavebeenappliedto adjusttheindicatorsandcalculatedtheir95%confidence intervals.
3.4.1. Riskadjustmentvariables
Oneofthemostcommonly-used,andclinicallyimpor- tant, riskadjustmentvariableiscomorbidity.Numerous measuresofcomorbidityareavailablewhenusingadmin- istrative data (for a review see e.g. [19–21], the most common being the Elixhauser method [22] and the
Table4
ComorbiddiseasesinEuroHOPEAMIstudy.
Comorbidity ICD-10 ICD-9 ATC/DDD
Hypertension I10*–I15* 40* C03*,C07*(withneithercoronaryartery
diseasenoratrialfibrillationindicates hypertension),C08*,C09*
Coronaryarterydisease I20*–I25* 410*–414* N/A
Atrialfibrillation I48* 4273* N/A
Cardiacinsufficiency I50* 428* N/A
Diabetesmellitus E10*–E14* 250* A10A*,A10B*
Atherosclerosis I70* 440* N/A
Cancer C00*–C99**,D00*–D09* 140*–208* L01*(exceptL01BA01)
COPDandasthma J44*–J46* 4912*,496*,496* R03*
Dementia F00*–F03*,G30* 290*,3310* N06D*
Depression F32*–F34* 2962*,2963* N06A*
Parkinson’sdisease G20* 332* N04B*
Mentaldisorders F20*–F31* 295*–298*except
2962*and2963*
N05A*(exceptN05AB01andN05AB04),andno dementia
Renalinsufficiency N18* 585* N/A
Alcoholism F10*–F19* 291*,304*,305* N/A
Stroke I60*,I61*,I63*,I64*,G45* 430*–438* N/A
*Indicatesthatallsubgroupsareincludedi.e.I63*=I63.0–I63.9.
Charlson ComorbidityIndex(CMI) [23]).Besidescomor- bidity chartings based on information about secondary diagnosesinthehospitaldischargedata,theAnatomical TherapeuticChemical(ATC)classificationsystemhasbeen usedtoidentifypharmaceuticaltreatmentsthatarecom- monforaselectionofrelevantcomorbiddiseases[24–26].
Usingthedataavailableandexperienceofthesemeasures, as wellas statisticaltesting, ourdisease-specific expert groupsseparatelytailoredasetofconditionsforeachdis- easethatwerepotentiallyusedforriskadjustment.Inthe finalriskadjustmentonlythoseconditionswhosepreva- lenceexceeded1%ineachoftheparticipatingcountries’
dataforthatparticulardiseasewereincluded.
Two different databases were used to identify for comorbidityinformationinpatients’records:thehospital dischargeregisterandtheregisterofprescribedmedicines.
Thetwosourcesoverlapintermsofthecontentofinforma- tion,i.e.apersonhospitalizedwithaspecificcomorbidity hasahighprobabilityofhavingpurchased aprescribed medicine for that illness.On theotherhand, theregis- terscomplementeachothersothattheinformationofthe comorbidities of patientsbecomesreliable. Thisis rele- vant,inparticularbecauseoftheexpectedundercodingof secondarydiagnosesindischargeregisters.Thediagnoses (main and secondary diagnoses separately) of patients’
inpatienthospitaltreatmentsinthepreviousyear(i.e.365 daysbeforetheindexadmission)arechecked.Theassump- tionmadeisthatifapersonhasbeenhospitalizedwith adiagnosisofacomorbidityconditionbeforethestartof theepisode,thepatienthashad thecomorbidityatthe timeoftheeventunderobservation(exceptamonglow birthweightinfants).Similarly,purchasesforprescribed medicines are checkedfor thelast 365days beforethe startoftheepisodeofcare(Fig.1).Hospitaldischargesand medicinepurchasesduringtheeventorafterwardsarenot checkedforcomorbidities.Inadditiontocheckingthediag- nosesofapatient,wehavecountedthenumberofhospital inpatientdaysintheyearprecedingtheindexadmission.
Ageandsexofthepatientarealsoconsideredintherisk adjustment.
Thecomorbiditiesavailablefor AMIpatientsarepre- sented in Table 4. For each indicator we perform risk adjustmentwiththreedifferentsets ofconfounders:(1) ageandsex(M1),(2)age,sex,hospitaldaysintheprevious year,andcomorbiddiseasesbasedonhospitaldischarge data(M2),and(3)age,sex,hospitaldaysintheprevious year,andcomorbiddiseasesbasedonbothmedicationand hospitaldischargedata(M3). Thecomorbiditiesusedin eachdiseasegroupvary;thetableprovidesabroadper- spectiveonthecomorbiditiesselectedinthestudyandin themarkingcriteria.
3.4.2. Riskadjustmentmodeling
Therearemanypossiblemethodsthatcouldbeused for risk adjustment, such as methods related both to observable confounders (standardization using different approaches, such as nonlinear regressions, propensity score,confidenceintervalsusingshrinkageestimatorsand otherBayesianmethods)and unobservableconfounders (instrumentalvariablemethodsandtwo-stagemethods) [8].In practice, theselection of appropriatemethods is basedonbalancingwhatcanbedoneonaroutinebasis with adequate methodological aspects. As the number of indicators in EuroHOPE is high, the development of refinedstatisticalmodelsforeachindicatorseparatelyis notfeasiblewhenitcomestoreportingandbenchmarking purposes.
Thus,wechosetocarryoutanindirectstandardization formeasuresof incidence,whileforallotherindicators a modeling strategy is adopted: logistic regression for dichotomicresponses(e.g.mortality), generalized linear modelingforcontinuousresponses(e.g.forcostslogit-link withgammadistribution),andnegativebinomialmodeling for discrete responses (e.g. lengthof stay). The simpli- fiedapproachchosenisjustifiedonthepracticalgrounds mentionedabove.In addition,ourmethodologyismore accessibletoawideraudiencethanarethemorecomplex alternatives,althoughwerecognize thatmoreadvanced methodsexistandthatthereportingmightbenefitfrom those.
1015202530%
Unadjusted Model 1 Model 2 Model 3
Fig.3. One-yearmortalityofAMIpatientsinSweden2007.Regionalunadjustedandrisk-adjustedsharesandtheir95%confidenceintervals.
Intheestimationoftheriskadjustmentmodelsacom- plicationarisesfromtheinvolvement ofmany different countries.Ideally,theindividual-leveldatafromallpar- ticipatingcountrieswouldbepooledbeforeestimatingthe riskadjustmentmodelsHowever,notallcountrieshave permissiontosharetheindividualleveldatawhichiswhy theriskadjustmentisbasedondatafromaroundhalfof theincludedcountries.
Ineachdisease,theparameterestimatesforthecon- foundingfactorsarefirstestimatedforeveryprocessor outcomemeasureusingthebroadestpossibledataforthe diseasein question[e.g.for AMItheinternationalEuro- HOPEcomparisondata,availablefromtheyear2007from Finland,Hungary,Sweden,Norway(dataof2009)andtwo regionsofItaly].Theestimationsaremadebyweightingthe datasothateachcountryhasthesameweight.Then,the coefficientsofeachmodelaremadeavailabletoallpart- nerswhothencalculateindividual-level-predictedvalues fortheindicators.Thepredictedvaluesarethensummed uptocountryandregionallevel.Theratiooftheobserved valueandtheexpectedvalueofthedependentvariablein thecomparableunit canbemultipliedwiththeaverage valueoftheindicatorinthepooleddatatoconstitutethe riskadjustedindicator.
3.4.3. Standardizationindataprocessingand calculations
Froma practicalpoint ofview,thewholeprocessof riskadjustmentandreportingoftheindicatorshasbeen automatizedasmuchaspossible.Eachpartnerwasindivid- uallyresponsibleforproducingitsownnationalEuroHOPE comparisondata,withtheprinciplesstatedinthedisease- specificstudyprotocols.6Afterthis,thepartnersexecuted afixedfileinacommonstatisticalprogram(Stata)which automaticallyprocessedthedata,foundthecoefficientsfor themodelsfromtheEuroHOPEserver,andcalculatedthe predictedvaluesandtheriskadjustedvaluesatalllevels.
6 The study protocols for each disease are available at http://www.eurohope.info.
Finally,thedescriptivestatisticsalongwiththecountry-, regional-andhospital-levelindicatorsandtheirconfidence intervals were automatically transferred to a reporting template.
In addition to all this, the common statistical pro- gramsalsoincludedmaterial(forexample,modelingwith thecountry-specificdata,graphingetc.)whichproduced additional material for the study. The automatization of the indicator production minimized the chances for humanprogrammingerrors,butmostimportantlyitsaved timeandresourcesofallpartners.Also,thisenabledthe use of individual-level data to the fullest extent in all countries.
4. Illustrativeexamples
TheresultsofanalysesforAMIpatientsareusedtoillus- tratethemethodsforriskadjustment.InFig.3,thethree alternativeriskadjustmentapproaches(M1,M2andM3) fortheone-yearmortalityarecomparedwithcrudemor- tality betweentheSwedish regions(counties).It seems thatthedifferentriskadjustmentmethodsgeneratesim- ilarcountyrankings:Thecorrelationcoefficientbetween theriskadjustedmeasuresvariedfrom0.99to0.96.The crudemortalitywaslessclearlyassociatedwiththerisk adjustedfigures(correlations0.90–0.80).
Fig. 4 describes regional variation in age- and sex- standardized one-year mortalityof AMI patientsin the sevencountries.Mortalityaswellasitsregionalvariation wasmuchhigherinFinland,HungaryandScotlandthanin thethreeothercountries.
5. Discussion
The disease-basedapproach isattractive forinterna- tional comparative performance comparison, because it producesvariousmeasuresnotonlyatcountrylevelbut alsoatregionalandhospitallevelacrosscountries.Itsuse- fulnessdepends,nevertheless,oncomprehensiveregister databeingavailableandthepossibilityoflinkingthehos- pitaldischargeregistertootherdatabases.TheEuroHOPE
0 5 10 15 20 25 30 35 40 45 50
FIN FIN FIN FIN FIN FIN FIN FIN FIN FIN HUN HUN HUN HUN HUN HUN HUN HUN HUN HUN ITA NET NET NET NET NET NET NOR NOR NOR NOR NOR NOR NOR NOR NOR NOR SCO SCO SCO SCO SCO SCO SWE SWE SWE SWE SWE SWE SWE SWE SWE SWE
%
Fig.4.One-yearmortalityofAMIpatientsperregionbycountry,adjustedforageandsex,withconfidenceintervals.
projectisoneofthefirstinternationalprojectstodiscover thepossibilitiesof theapproachatthis scale,aimingto linkthedata-sourcesusing entirelystandardized proce- duresacrosscountries.Thebenefitsarealreadyapparent fromthepreliminaryresults,whichindicateclearlythat theapproachgivesnewpossibilitiesforperformancecom- parisonofcertainpatientgroups.Avarietyofindicators couldbeusedforbenchmarkinganddatawereprovidedat variousrelevantlevels,thatis,atthelevelswheremost of the actions in policy making are taken. Comparison withothernationalandinternationalqualitydatabases– suchasthoseoftheOECDHealthCareQualityIndicator Project(HCQI)andtheAgencyforHealthcare Resources andQuality(AHRQ)–revealsthattheEuroHOPEproject hasgraspedsubtleandricherinformationontheselected diseasesincludingbothlong-termoutcomesandcosts.In addition,the follow-up ofpatientsextends throughthe wholeclinicalpathway.
Therearestillchallengestobemet.Forsomeofthose participatingcountries,theformalandtechnicalprocesses ofhavingaccesstodataaretooslowandcumbersome.In thesecountries,publicauthoritiesneedtoberemindedby researchersthatdomesticandinternationalcomparisons requireaccesstodetailedpatient-leveldata.Ashighlighted bytheHospitalDataProject[27]therearedifferencesin codingpracticesacrosscountriesandthequalityofdata isnotalwayscomparable.Forexample,theincidenceof AMI(newAMIpatients/population)wasclearlyhigherin Swedenand NorwaycomparedtoFinlandand Hungary.
Atthisstage,itisnotclearwhetherthisreflectstruedif- ferencesin theuseofacute hospitalcareofthepatient grouporcodingdifferencesofthemaindiagnosis.Another potentialbiasisrelatedtothefactthatpatientsareiden- tifiedfromthehospitaldischargeregister.Somepatients maydie(orrecover)beforetheyarediagnosedinahos- pital.If theproportion ofthesepatientsvariesbetween countries, there is a potential bias in theoutcome and incidencecomparison.Inaddition,organizationalstructure aswellastheavailability oflinkabledataonlong-term
and rehabilitation care varies between countries. How- ever,sinceweareutilizingindividual-level datawe can performasensitivityanalysistovalidateourmainfind- ings.Forexample,wecancalculatethelengthofstayas wellascostboth includingandexcluding rehabilitation andlongtermcare.Inaddition,themergedinternational EuroHOPEcomparisondataenablesustousemoresophis- ticatedmethods (suchaspropensity scorematching)to increasethecomparabilityofperformancemeasurement [28].
The EuroHOPE projectutilized mainly available reg- ister data in which outcome can be evaluated using various mortality measures or intermediate indicators suchascomplications,readmissionsetc.Thesemeasures arecrude and donot cover alldimensionsof outcomes such as the effects of care on quality of life or func- tional status. For these measures patientsare theonly validsourceofinformation.Gatheringdatadirectlyfrom patients includes considerable expenses and feasibility challenges.Thus, thepilotstudiesfor strokeand breast cancer patients evaluate the feasibility of establishing international comparisons on measuring health related qualityoflifeandpatientsatisfactionindemandingpatient environment.
TheEuroHOPEprojectisbasedondatagatheredfrom seven countries. The aim of the project is to develop methodsforperformanceassessmentthatcanbeusedfor routineevaluation.Documentationwiththepubliclyavail- ablestudyprotocols,programmingandreportingmaterial make entry into the EuroHOPE group potentially easy.
Newcountriesmustfirstdevelopandadjusttheirinfor- mationsystems while laws that might hinder available data linkages may need to be addressed. For example, an electronic record system (including all health care activities) isunder developmentinmany countriesand willgivenew,path-breaking possibilities forthe devel- opmentofthedisease-basedapproach.Thisrequiresthat data using standardized and internationally compara- bledefinitions ofactivitiesand classificationsdescribing
the treatments (i.e. diagnosis, procedures) are nation- allyavailableforresearchandthusenableevaluationof the performance across countries, regions and produc- ers.
Acknowledgements
ThisprojectwasundertakenwithintheEuropeanUnion 7th FrameworkProgramme European Health CareOut- comes,PerformanceandEfficiency(EuroHOPE),Contract no.241721
References
[1]HäkkinenU,JoumardI.Cross-countryanalysisofefficiencyinOECD healthcaresector:optionsforresearch.OECD,EconomicsDepart- mentWorkingPapers,No.554;2007.
[2]HäkkinenU.ThePERFECT-project:measuringperformanceofhealth careepisodes.AnnalsofMedicine2011;43(Suppl.1):S1–3.
[3]SmithPC,HäkkinenU.Informationstrategiesfordecentralization.In:
SaltmanR,BankauskaiteV,VrangbaeckK,editors.Decentralization inhealthcare.Berkshire:OpenUniversityPress;2007.p.206–24.
[4]StreetA,HäkkinenU.Healthsystemproductivityandefficiency.In:
SmithPC,MossialosE,PapanicolasI,LeathermanS,editors.Perfor- mancemeasurementforhealthsystemimprovement.Experiences, challengesandprospects.Cambridge:CambridgeUniversityPress;
2009.p.222–48.
[5]BusseR.Dodiagnosis-relatedgroupsexplainvariationsinhospital costandlengthofstay?AnalysesfromtheEuroDRGprojectfor10 episodesofcareacross10Europeancountries.HealthEconomics 2012;21(Suppl.2):1–5.
[6]Wray NP, Ashton CM,Kuykendall DH, HollingsworthJC. Using administrativedatabasestoevaluatethequalityofmedicalcare:a conceptualframework.SocialScience&Medicine1995;40:1707–15.
[7]dePouvourvilleG,MinvielleÉ.Measuringthequalityofhospitalcare:
thestateoftheart.Whatinformationshouldbemadeavailabletothe public?In:Measuringup:improvinghealthsystemperformancein OECDcountries.Paris:OrganisationforEconomicCo-operationand Development;2002.p.251–75.
[8]IezzoniLI,editor.Riskadjustmentformeasuringhealthcareout- comes.Chicago:HealthAdministrationPress;2003.
[9]TerrisDD,AronDC.Attributionandcausalityinhealth-careper- formancemeasurement.In:SmithPC,MossialosE,PapanicolasI, LeathermanS,editors.Performancemeasurementforhealthsystem improvement:experiences,challenges,andprospects.Cambridge:
CambridgeUniversityPress;2009.p.311–38.
[10]SundR.Utilisationofadministrativeregistersusingscientificknowl- edgediscovery.IntelligentDataAnalysis2003;7:501–19.
[11]HeijinkR,KoopmanschapMA,PolderJJ.Internationalcomparisonof costofillness.RIVMreports;2006.
[12]SolonJA,FeeneyJJ,JonesSH,RiggRD,ShepsCG.Delineatingepisodes ofmedicalcare.AmericanJournalofPublicHealth1967;57:401–8.
[13]HornbrookM,HurtadoA,JohnsonR.Healthcareepisodes:definition, measurementanduse.MedicalCareReview1985;42:163–218.
[14]RosenAK,Mayer-OakesA.Episodesofcare:theoreticalframeworks versuscurrentoperationalrealities.TheJointCommissionJournalon QualityImprovement1999;25:111–28.
[15]KobelC,ThuilliezJ,BellangerM,PreifferK.DRGsystemsandsim- ilarpatientclassificationsystemsinEurope.In:BusseR,Quentin W,WileyM,editors.Diagnosis-relatedgroupsinEurope.Moving towardstransparency,efficiencyandqualityinhospitals.Berkshire, UK:OpenUniversityPress;2011.p.37–58.
[16]GeueC,LewseyJ,LorgellyP,GovanL,HartC,BriggsA.Spoiltfor choice:implicationsofusingalternativemethodsofcostinghospital episodestatistics.HealthEconomics2012;21:1201–16.
[17]Cost per patient (KKP – Kostnad per patient) project. See http://www.skl.se/kpp
[18]Eurostat,OECD.Methodologicalmanualonpurchasingpowerpari- ties.Luxembourg:EuropeanCommunities.OECD;2006.
[19]deGrootV,BeckermanH,LankhorstGJ,BouterLM.Howtomeasure comorbidity:acriticalreviewofavailablemethods.JournalofClinical Epidemiology2003;56:221–9.
[20]QuanH,SundararajanV,HalfonP,FongA,BurnandB,LuthiJ,etal.
CodingalgorithmsfordefiningcomorbiditiesinICD-9-CMandICD- 10administrativedata.MedicalCare2005;43:1130.
[21]HolmanC,PreenD,BaynhamN,InnJ,SemmensJ.Amultipurpose comorbidityscoring systemperformedbetterthantheCharlson index.JournalofClinicalEpidemiology2005;58:1006–14.
[22]ElixhauserA,SteinerC,HarrisR,CoffeyR.Comorbiditymeasuresfor usewithadministrativedata.MedicalCare1998;36:8–27.
[23]CharlsonME,PompeiP,AlesKL,MacKenzieCR.Anewmethodofclas- sifyingprognosticcomorbidityinlongitudinalstudies:development andvalidation.JournalofChronicDiseases1987;40:373–83.
[24]MaioV,YuenE,RabinowitzC,LouisD,JimboM,DonatiniA,etal.
Usingpharmacydatatoidentifythosewithchronicconditionsin EmiliaRomagna,Italy.JournalofHealthServicesResearch&Policy 2005;10:232–8.
[25]LamersL,vanVlietR.Thepharmacy-basedcostgroupmodel:val- idatingandadjustingtheclassificationofmedicationsforchronic conditionstotheDutchsituation.HealthPolicy2004;68:113–21.
[26]NaughtonC,BennettK,FeelyJ.Prevalenceofchronicdiseaseinthe elderlybasedonanationalpharmacyclaimsdatabase.AgeandAge- ing2006;35:633–6.
[27]HospitalDataProject.Phase2.Finalreport;2008.
[28]SchreyöggJ,StargardtT,TiemannO.Costsandqualityofhospitalsin differenthealthcaresystems:amultilevelapproachwithpropensity scorematching.HealthEconomics2011;20:85–100.
[29]Medin E, Häkkinen U, Linna M, Anthun KS, Kittelsen S, Rehnberg C. International hospital productivity comparison: nordic experience. Health Policy 2013, http://dx.doi.org/10.1016/j.healthpol.2013.02.004.
[30]Eurostat.Handbook onprice and volumemeasures innational account.Luxemburg:EuropeanCommunities;2001.