DOI: 10.1556/606.2018.13.2.7 Vol. 13, No. 2, pp. 67–76 (2018) www.akademiai.com
APPLICATION OF AHP FOR EVALUATING PASSENGER DEMAND FOR PUBLIC TRANSPORT
IMPROVEMENTS IN MERSIN, TURKEY
1 Sarbast MOSLEM, 2 Szabolcs DULEBA
1,2 Department of Transport Technology and Economics, Faculty of Transportation and Vehicle Engineering, Budapest University of Technology and Economics, Műegyetem rkp. 3
H-1111 Budapest. Hungary
e-mail: 1moslem.sarbast@mail.bme.hu, 2duleba.szabolcs@mail.bme.hu Received 25 November 2017; accepted 19 February 2018
Abstract: The supply quality of a public transport system can be characterized by a few frequently alluded factors. These factors are often not fully considered in emerging countries by decision makers, generally, the decisions are made through a top-down process, while preferences of the demand side would also be essential. This paper suggests an approach aiming to get an overview of passenger’s demands in Mersin city ‘Turkey’. As methodology, analytic hierarchy process has been applied based on created questionnaires that has been used regarding the hierarchy of quality factors, and as evaluators, the public and governmental decision makers have been involved in the survey. The degree of public satisfaction about public transport has been decided by analyzing collected data.
Keywords: Public transport, Analytic hierarchy process, Passenger demand, Multiple-criteria decision-making
1. Introduction
Public transportation development issues are generally decided by decision makers, who do not have full information about the passenger’s opinion, so the difference on the necessary development implications is significant between passenger side and company manager’s side. There is a transparent need for gathering information from public side related to the current condition of transport supply quality. For example: in the US, a law has been issued about transportation development, which declares that decision makers must consider passenger opinion before taking any development decisions, for
more information, see Safe, Accountable, Flexible, Efficient Transportation Equity Act a Legacy for Users (SAFETEA-LU) [1].
In the European Union (EU) passenger participation is highly recommended in transport policy thus making a survey, introduced in this paper could be a part of a Sustainable Urban Mobility Plan (SUMP), moreover it might help in applying for EU funds to involve passengers in the creation process of a SUMP.
This problem is relevant all over the world, but can be even more important in developing cities and for emerging countries like Turkey in which the demand side is often drastically neglected. The only way to increase the use of public transportation is to raise the utilization level of the system. By evaluating the answers of passengers and the government side and making transport improvement policy based on this, it is possible to reach higher satisfaction of the passengers, and encourage the non- passengers to start using public transportation [2], [3]. In order to get an overall view on preferences of public and government groups, Multiple-Criteria Decision-Making (MCDM) techniques are relevant to use [3].
2. Methodology
The popular technique for MCDM utilized by many analysts around the world [4]-[11]. To improve supply quality of public transport MCDM methods has been used by authors, because of their wide spread popularity in gathering stack holder’s opinions over the last 30 years, especially in service quality improvements [2], [11]. The following MCDM methods are available, many of which are implemented by specialized decision-making software.
Advantages and disadvantages for most applied MCDM methods in transportation projects can be summarized in the follows.
The analytic hierarchy process
The advantages of the Analytic Hierarchy Process (AHP) are:
‒ Mathematically proven, eigenvector method, methodology correct;
‒ Consistency in evaluation.
The disadvantages of the AHP are:
‒ Hierarchy is not always strict as should to be;
‒ Interrelations between factors not flexible.
The analytic network process
The advantages of the Analytic Network Process (ANP) are:
‒ Mathematically proven, eigenvector method, methodology correct;
‒ Interrelations between factors flexible;
‒ Enables the existence of interdependences among criteria;
‒ Interdependency and feedbacks of different levels of the network.
The disadvantages of the ANP are:
‒ It is hard to fill up the super matrix by the public;
‒ When the decision structure is basically hierarchal, then AHP from mathematical point of view is more effective.
The technique for order of preference by similarity to ideal solution
The advantages of the Technique for Order of Preference by Similarity to Ideal Solution (TOPSIS) are:
‒ Mathematically proven;
‒ Full use of attribute information provides a cardinal ranking of options.
The disadvantages of the (TOPSIS) are:
‒ Ranking reversal;
‒ Correlations between criteria;
‒ Uncertainty in obtaining the weights only by objective methods or subjective methods.
Preference ranking organization method for enrichment evaluation
The advantages of Preference Ranking Organization METHod for Enrichment Evaluation (PROMETHEE) are:
‒ Mathematically proven.
The disadvantages of the (PROMETHEE) are:
‒ Non flexibility of the software package.
Elimination and choice expressing reality
‘ELECTRE’, is a French word, in English it means: elimination and choice expressing reality.
The advantages of ‘ELECTRE’ are:
‒ Has a clearer view of alternatives by eliminating less favorable ones.
The disadvantages of the ‘ELECTRE’ are:
‒ It only produces a core of leading alternatives.
In this study the analytic hierarchy process has been applied by using Saaty’s scale (Table I, Table II) for pairwise comparison [6], [12]:
• The problem is more hierarchy structured and dynamic analysis could be considered [6];
• Consistency check is required (passengers are evaluators);
• Ranking of factors are both ordinal and cardinal;
• In the final decision not ranking itself is purely important but the scores attained to the factors.
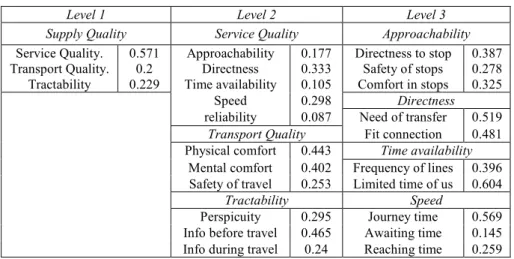
Table I
The hierarchical structure of public bus transport [3]
Level 1 Level 2 Level 3
Supply Quality Service Quality Approachability
Service Quality Transport Quality
Tractability
Approachability Directness Time availability
Speed reliability
Directness to stop Safety of stops Comfort in stops
Directness Need of transfer
Fit connection Transport Quality
Physical comfort Mental comfort Safety of travel
Time availability Frequency of lines Limited time of us
Tractability Speed
Perspicuity Info before travel Info during travel
Journey time Awaiting time Reaching time Table II
Judgment scale of relative importance for pairwise comparison (Saaty’s 1-9 scale) [12]
Numerical
values Verbal scale Explanation
1 Equal importance of both
elements Two elements contribute equally
3 Moderate importance of one element over another
Experience and judgment favor one element over another
5 Strong importance of one
element over another An element is strongly favored 7 Very strong importance of one
element over another An element is very strongly dominant 9 Extreme importance of one
element over another
An element is favored by at least an order of magnitude
2,4,6,8 Intermediate values Used to compromise between two judgments
The hierarchical structure has been used of public bus transport that developed by Duleba [3], and structured by authors, in this hierarchical first level is a fairly general one, the second level is more specific and the third is more specific, so the data could be increased essential on a wide range of components in an entirely intelligent manner,
Fix cost is expected, so just supply quality issues are investigated. Another point in AHP approach is isolating the different members of open transport: government as a maintainer, organization as the administrator and travelers as clients. The conflict of their distinctive picture on key-purposes of a specific framework can be the reason for settling on wrong choices on transport advancement [12]. Thus evaluator groups had to be created, because of the different point of view of passenger and governmental evaluators.
Pairwise comparisons had to be made by the evaluators for all the elements of the model, considering the hierarchy levels.
For the 1st level the following questions were asked: ‘Compare the importance of improvement for the service quality and transport quality element. Compare the importance of improvement for the service quality and tractability elements. Compare the importance of improvement for the transport quality and tractability elements.’ For the 2nd, and 3rd level the same structure was constructed.
During the AHP process the consistency of answers has been examined by Saaty’s Consistency Index (CI) and Consistency Ratio (CR) < 0.1, [6], [7], [12], because the experiential matrices most of the time is not consistent:
1 max
−
= − n CI λ n
, (1)
where CI is the consistency index, λmax is the maximum eigenvalue and n is the number of rows in the matrix. CR can be determined by:
RI
CR=CI, (2)
where RI is the random consistency index If A is a consistency matrix, A⋅X=λmaxX. Then eigenvector X can be calculated as
(
A−λmaxI)
X=0, where λmax is the maximum eigenvalue of the matrix A. λmaxis the principal eigenvalue of the matrix A.For determining the eigenvectors of the aggregate matrices the following method was applied:
n ij k
ik j n
k ik ij
j k
w w w w w w w i w
∑
=
∑
=
=
=1 1
1
A , (3)
where j=1,L,m and wj > 0 (j=1,L,m) represents the related weight coordinate from the previous level; wij >0 (i=1,L,n) is the eigenvector computed from the matrix in
the current level, wAi (i=1,L,n) is the calculated weight score of current level’s elements.
The consistency ratio (CR) was acceptable to complete the AHP analysis [12].
Sensitivity analysis has been performed to test the stability of the rank and it was stable.
Table III and Table IV summarize the results of the methods for criteria.
Table III
Results of the passenger evaluator groups
Level 1 Level 2 Level 3
Supply Quality Service Quality Approachability
Service Quality. 0.571 Approachability 0.177 Directness to stop 0.387 Transport Quality. 0.2 Directness 0.333 Safety of stops 0.278 Tractability 0.229 Time availability 0.105 Comfort in stops 0.325
Speed 0.298 Directness
reliability 0.087 Need of transfer 0.519 Transport Quality Fit connection 0.481 Physical comfort 0.443 Time availability
Mental comfort 0.402 Frequency of lines 0.396 Safety of travel 0.253 Limited time of us 0.604
Tractability Speed
Perspicuity 0.295 Journey time 0.569 Info before travel 0.465 Awaiting time 0.145 Info during travel 0.24 Reaching time 0.259
Table IV
Results of the government evaluator groups
Level 1 Level 2 Level 3
Supply Quality Service Quality Approachability
Service Quality. 0.137 Approachability 0.136 Directness to stop 0.176 Transport Quality. 0.277 Directness 0.252 Safety of stops 0.262 Tractability 0.584 Time availability 0.245 Comfort in stops 0.563
Speed 0.279 Directness
reliability 0.088 Need of transfer 0.581 Transport Quality Fit connection 0.419 Physical comfort 0.493 Time availability
Mental comfort 0.418 Frequency of lines 0.226 Safety of travel 0.089 Limited time of us 0.774
Tractability Speed
Perspicuity 0.342 Journey time 0.389 Info before travel 0.333 Awaiting time 0.238 Info during travel 0.325 Reaching time 0.343
3. Results
The study has been made to evaluate the situation of Mersin’s public transport. The two different groups of participants have made the results of study comparable [3], [11].
The characteristics of the conducted survey based on the hierarchical model were the followings:
• 89 evaluators (2 managers ‘in the relevant field’ + 15 government officials ‘in the relevant field’ + 72 public passengers) were asked out of the total population of 1.773.852. The number of participants evidently not statically representative however the MCDM provides a deeper insight based on pairwise comparisons than simple statistical survey [6];
• The survey was made in July and August 2017, and analyzed in September 2017. Passengers and decision makers were asked.
In case of some factors significant conflict could be detected between the passenger and the governmental evaluators. Considering the separation of the two different sides of public transportation and firstly ignoring the weights of the previous level, the calculated normalized matrix eigenvectors are presented. AHP is a ranking method itself, also there are other ranking methods exist [13]. The factor preferences by passengers make improving public transportation system feasible and sustainable [14], [15]. The scores of the proper eigenvectors provide the opportunity to set up a rank order of preferences among the participants of public transport on the issues of the system considering the weights of the previous levels as well. Priority order of different elements in public bus transportation systems in terms of their development is presented in Table V-Table VII.
For first level, Table V all main passenger participants of the analyzed public transportation system indicated the development of service quality as the most essential related issue, and for decision maker participants of the analyzed public transportation system indicated the development of tractability as the most essential related issue.
Table V
Different ranking of elements by evaluator groups for Level 1 For the passenger side For the governmental side
Level 1 Level 1
1 Service Quality 0.571 1 Tractability 0.585
2 Tractability 0.229 2 Transport Quality 0.278
3 Transport Quality 0.2 3 Service Quality 0.137
In level 2, Table VI for the passenger side the development of directness was the most essential related issue, but for decision makers the development of perspicuity was the most essential related issue. The utility of vehicles is high, and most of the time the empty seats cannot be found easily, so improving physical comfort is necessary. The development of safety of travel, reliability, time availability and physical comfort had the same importance for both side.
Table VI
Different ranking of elements by evaluator groups for Level 2 For the passenger side For the governmental side
Level 2 Level 2
1 Directness 0.19 1 Perspicuity 0.199
2 Speed 0.169 2 Info before 0.194
3 Info before 0.107 3 Info during 0.189
4 Approachability 0.101 4 Physical comfort 0.148
5 Physical comfort 0.089 5 Mental comfort 0.116
6 Perspicuity 0.068 6 Speed 0.039
7 Mental comfort 0.062 7 Directness 0.036
8 Time availability 0.059 8 Time availability 0.035
9 Info during 0.055 9 Safety of travel 0.024
10 Safety of travel 0.051 10 Reliability 0.015
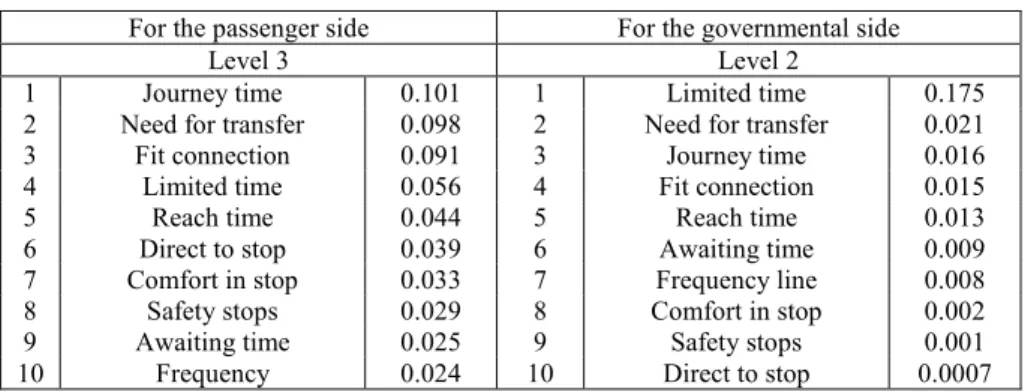
11 Reliability 0.049 11 Approachability 0.005
For the last level in Table VII for the passenger side decreasing travel time was the most essential, but for decision makers the development of safety and comfort in stops was the last important issue for both side. The development of fit connection, Time to reach stops and need for transfer had the same importance for both side.
Table VII
Different ranking of elements by evaluator groups for Level 3 For the passenger side For the governmental side
Level 3 Level 2
1 Journey time 0.101 1 Limited time 0.175
2 Need for transfer 0.098 2 Need for transfer 0.021
3 Fit connection 0.091 3 Journey time 0.016
4 Limited time 0.056 4 Fit connection 0.015
5 Reach time 0.044 5 Reach time 0.013
6 Direct to stop 0.039 6 Awaiting time 0.009
7 Comfort in stop 0.033 7 Frequency line 0.008
8 Safety stops 0.029 8 Comfort in stop 0.002
9 Awaiting time 0.025 9 Safety stops 0.001
10 Frequency 0.024 10 Direct to stop 0.0007
4. Conclusion
Depending on the gained results by applying AHP a significant gap between passengers point of view and decision makers has been found, so the decision makers in Mersin Municipality Transportation Department have to adjust totally to the passenger side evaluations because the users of the public transport system neglecting technical and economic factors. Depending on the gained results, future transportation strategic plan and improve service quality, approachability and directness factors have to be
improved in future plans more than tractability, information during travel and perspicuity to attract non passengers and increase satisfaction for passengers.
Applying a three-level-hierarchy, the preference order of the issues will probably be very sensitive to the calculated weight scores (eigenvector coordinates) of the respective previous level. Sensitivity analysis showed our stability ranking of factors.
The two different groups showed the different views of development between decision makers and the public; this might be due to many factors like costs and political situation in the area that make public bus transportation development plans logical.
The interrelationships between the factors have to considered, the analytic network process will be applied to improve the supply quality in the further study.
Acknowledgements
This work has been undertaken as a part of the PhD studies by the Authors (PhD student and the supervisor) at the Department of Transport Technology and Economics, Faculty of Transportation Engineering and Vehicle Engineering, Budapest University of Technology and Economics.
References
[1] Safe, accountable, flexible, efficient transportation equity act: A legacy for users, US Department of Transportation, Federal Highway Administration, 2005.
[2] Perez J. Some comments on Saaty’s analytic hierarchy process, Management Science, Vol. 41, No. 6, 1995, pp. 1091‒1095.
[3] Duleba, S.; Mishina, T.; Shimazaki, Y. A dynamic analysis on public bus transport’s supply quality by using AHP, Transport, Vol. 27, No. 3, 2012, pp. 268–275.
[4] Dyer J. S. Remarks on the analytic hierarchy process, Management Science, Vol. 36, No. 3, 1990, pp. 249–258.
[5] Abbaspour M., Karimi E., Nassiri P., Monazzam M. R., Taghavi L. Hierarchal assessment of noise pollution in urban areas, A case study, Transportation Research, Part D, Vol. 34, 2015, pp. 95–103.
[6] Saaty T. L. How to make decision: The analytic hierarchy process, Interfaces, Vol. 24, No. 6, 1994, pp. 19‒43.
[7] Zahedi F. The analytic hierarchy process: A survey of the method and its applications, Interfaces, Vol. 16, No. 4, 1986, pp. 96‒108.
[8] Alireza S., Hossein H., Ghodrat E, Applying AHP clustering approaches for public transportation decision making: a case study of Isfahan city, Journal of Public Transportation, Vol. 19, No. 4, 2016, pp. 38-55.
[9] Portschy S. Community participation in sustainable urban growth, case study of Almere, The Netherlands, Pollack Periodica, Vol. 11, No. 1, 2016. pp. 145–155.
[10] Nassereddine M., Eskandari H. An integrated MCDM approach to evaluate public transportation system in Tehran, Transportation Research, Part A, Polici and Practice, Vol.
106, 2017, pp. 427‒439.
[11] Mardani A., Zavadskas E. K., Khalifah Z., Jusoh A., Nor K. M. Application of multiple- criteria decision-making techniques and approaches to evaluating of service quality: a
systematic review of the literature, Journal of Business Eeconomics and Management, Vol. 16, No. 5, 2015, pp. 1034‒1068.
[12] Saaty T. L. A scaling method for priorities in hierarchical structures, Journal of Mathematical Psychology, Vol. 15, No. 3, 1977, pp. 234–281.
[13] Oláh J., Nestler S., Nobel T., Popp J. Ranking of dry ports in Europe - Benchmarking, Periodica Polytechnica, Transportation Engineering, doi.org/[10.3311/PPtr.11414, 2017.
[14] Torok A. Sustainable and efficient interurban public road transport in Hungary, Pollack Periodica, Vol. 7, No. 1, 2012, pp. 75–82.
[15] Winkler A. Collecting public transport passenger preference data online, Pollack Periodica, Vol. 5, No. 2, 2010, pp. 119–126.