THE WESTERN BALKANS: WEAK PERFORMANCE SINCE THE CRISIS*
Marek DABROWSKI – Yana MYACHENKOVA
In the early and mid-2000s, the prospect of EU accession and the global boom facilitated rapid economic recovery and boosted economic and institutional reforms in the Western Balkan region.
The global fi nancial crisis of 2007–2009 and the European crisis of 2010–2013 slowed the pace of economic growth and amplifi ed high unemployment in the region. In addition, various unresolved legacies from past confl icts slowed the pace of reform and progress towards EU accession.
The European Commission’s February 2018 communication sets an indicative deadline (2025) for the two most advanced candidates – Serbia’s and Montenegro’s admission to the EU. This could incentivise all Western Balkan countries, including those candidates that have not yet started mem- bership negotiations (Macedonia and Albania) and those waiting for candidate status (Bosnia and Herzegovina and Kosovo), to remove domestic political obstacles to EU accession, solve confl icts with neighbours, speed up reforms and accelerate economic growth.
Keywords: Western Balkans, global fi nancial crisis, European Union, EU accession, economic integration, economic reforms, institutional reforms
JEL classifi cation indices: E42, F15, F16, F21, F24, F32, F35, F51, H62, H63, I32, J64
* This is a substantially expanded, revised and updated version of our paper published in the Bruegel Policy Contribution in 2018. The authors would like to thank Alexander Lehmann, J. Scott Marcus, André Sapir, Ben Slay, Alessio Terzi, Nicolas Véron, Guntram Wolff and Georg Zachmann for their comments on an earlier version of this paper. However, authors as- sume the full responsibility for its content. Opinions presented in this paper can be attributed solely to authors and not necessarily to institutions, which they are affiliated to.
Marek Dabrowski, corresponding author. Fellow at Bruegel, Brussels; Professor at the Higher School of Economics, Moscow; Co-founder and Fellow at CASE – Center for Social and Economic Research, Warsaw. E-mail: Marek.Dabrowski@case-research.eu
Yana Myachenkova, Research Assistant at Bruegel, Brussels.
E-mail: yanamyachenkova@ gmail.com
1. INTRODUCTION
The Western Balkans is a geopolitical term coined by the governing bodies of the European Union (EU) in the early 2000s and referring to those countries in south-eastern Europe that were not EU members or candidates at the time but could aspire to join the bloc. Originally, the Western Balkan region consisted of seven countries – Albania, Bosnia and Herzegovina, Croatia, Kosovo, Macedo- nia1, Montenegro and Serbia – but Croatia has already joined the EU.
In the 1990s, the region suffered from severe conflicts that had negative po- litical and economic consequences that continue to be felt. In the early and mid- 2000s, the prospect of EU accession and the global boom facilitated rapid eco- nomic recovery and boosted economic and institutional reforms in the region.
However, the global financial crisis of 2007–2009 and the subsequent European financial crisis of 2010–2013 (that affected in particular the southern flank of the EU) slowed down the pace of economic growth in the region and amplified high unemployment, especially among young people. In addition, various unresolved legacies from past conflicts slowed the pace of reform and progress towards EU accession in Western Balkan counties and intensified nationalist sentiments across the region.
Given its geographical location, the region is important to the EU in terms of security, stability, trade and transit routes. Therefore, the Western Balkan coun- tries’ economic and political prospects and their future within a European frame- work should remain one of the top priorities for the EU.
This paper concentrates on economic and social development in the region be- fore, during and after the global financial crisis. Naturally, we also take political and geopolitical factors into consideration but as the background rather than cen- tral theme of our analysis. We conclude with broad recommendations pertinent to the EU accession of Western Balkan countries. Our paper consists of seven sections. Section 2 presents historical, geographical and geopolitical background of our analysis. Section 3 is devoted to macroeconomic and social performance since the beginning of the current century. In Section 4, we analyse trade, invest- ment, migration and official aid flows with special attention given to the role of the EU. Section 5 discusses major institutional and governance challenges faced by the Western Balkan countries. In Section 6, we present the updated overview of the EU accession process. Finally, Section 7 contains policy conclusions and
1 Because of the conflict with Greece over the country’s official name (see sections 2 and 6), international organisations and the EU use the temporary name ‘the Former Yugoslav Repub- lic of Macedonia’ (FYROM) – see Section 2. However, for the sake of editorial simplicity, we use the short name ‘Macedonia’.
recommendations. The dominant analytical framework and methodology consist of an analytic narrative supported by a cross-country statistical comparison based on the available statistical databases of the IMF, WB, UNCTAD, UNECE, EBRD and those presented in other publications cited in this paper. Unfortunately, data for Kosovo remains incomplete.
2. CONFLICT LEGACIES AND GEOPOLITICS
Between 1918 and 1991, all Western Balkan countries except Albania were part of Yugoslavia. After World War II, similarly to most of their Central and Eastern European neighbours, the countries were under communist rule. However, in 1948 Yugoslavia split with the Soviet Union and remained independent from ma- jor geopolitical and military blocs in Europe, becoming one of the founders of the Non-Aligned Movement. After 1950, Yugoslavia developed a unique decentral- ised market socialism model based on employee-managed firms. Although this did not protect the country from macroeconomic disequilibria (repeated episodes of high inflation and hyperinflation, large external debt and high unemployment), it allowed the creation of quasi-market institutions and market-oriented micro- economic behaviour. Unlike countries of the Soviet bloc, Yugoslavia remained relatively open to the world in terms of trade and its citizens’ freedom to travel.
By contrast, Albania, which also split with the Soviet Union in 1962, chose an or- thodox model of a centrally planned economy based on national self-sufficiency and closed to the outside world.
When Yugoslavia began to collapse in 1991, most of its successor states suf- fered from violent ethnic conflicts, which negatively affected the entire region in terms of war damage, human suffering, disrupted trade links, refugee flows, sanctions, organised crime and so on. In the 1991–2001 decade, the conflicts resulted in the death of an estimated 130-140 thousand people. The bloodiest wars in Croatia, Bosnia and Herzegovina and Kosovo produced almost 4 million displaced persons (ICTJ 2009). This series of civil wars was stopped only by the intervention of United Nations and NATO forces and the EU’s generous promise to allow countries in the region to apply for EU membership once they re-estab- lish peace and meet the accession criteria. However, the legacies of past conflicts continue to overshadow the regional and pan-European politics until today:
Serbia, five EU member states (Cyprus, Greece, Romania, Slovakia and Spain) and several other countries2 do not recognise Kosovo as an independent state.
2 Including Argentina, Brazil, Chile, China, India, Indonesia, Iran, Israel, Nigeria, Russia, South Africa, Ukraine and most countries of the former Soviet Union.
Internally, tensions between various ethnic groups in Kosovo (Albanian, Ser- bian, Roma and Turks) have not been resolved and occasionally they even intensify (see RFE/RL 2018) following, among others, turbulences in relations between Serbia and Kosovo3. Domestic stability of Kosovo continues to rely on international peacekeeping forces and supervision of the United Nations Interim Administrative Mission in Kosovo (UNMIK).
Bosnia and Herzegovina, where the civil war was brought to an end by the Dayton Agreement in 1995, is a very loose two-tier confederation of three ethnic communities that is hardly manageable at the central level (ICG 2012;
Suljagic 2018). Politics in these entities continues to be dominated by nation- alist sentiments. As a result, the international community must continue its peacekeeping mission and state-building support more than 20 years after the end of the war.
Greece disputes Macedonia’s country name4 and this conflict has frozen the country’s EU and NATO accession process for more than a decade. The agree- ment of 17 June 2018 between Greece and Macedonia, according to which the latter accepted the new name of the Republic of North Macedonia, opened a way to unblock both accessions. But both countries now face a lengthy and po- litically complicated ratification process, including adoption of the respective changes into the Macedonian constitution (Fouere 2018). Internally, Macedonia has suffered periodically from ethnic tensions between its own majority and the Albanian minority. Furthermore, the 10-year term of former Prime Minister Nikola Gruevski (1996–2006) was marred by numerous violations of the rule of law and political and civil liberties.
Apart from Macedonia, some authoritarian backsliding has been noted since 2015 in Serbia, Montenegro and Bosnia and Herzegovina (Bechev 2018). This is seen, among others, in their deteriorating Freedom House’s ratings5. In the 2018 Freedom in the World surveys, all Western Balkan countries except Serbia were rated as “partly free”. Though Serbia retained a “free” status, it is on the verge of downgrading to “partly free” category. Similarly, The Economist In- telligence Unit’s 2017 Democracy Index ranks Serbia 66th out of 167 countries and territories as the “flawed democracy”. Other Western Balkan Countries are rated as “hybrid regimes” – Albania on 77th position, Montenegro – 83rd, Macedonia – 88th and Bosnia and Herzegovina – 101st (EIU 2018, chapter 3).
3 Overall, tensions between Serbia and Kosovo have been partly mitigated in recent years thanks to active EU diplomacy and incentives created by the prospect of EU membership.
4 Macedonia is the name of Greece’s northern region. Greece also questions the right of Mac- edonia to refer to the historical memory of Alexander the Great (Gligorov 2018).
5 https://freedomhouse.org/sites/default/files/Country%20and%20Territory%20Ratings%20 and%20Statuses%20FIW1973-2018.xlsx
All countries in the region face problems with corruption (see Section 5) and organised crime. The roots of the latter can be tracked back, at least partly, to the conflictsof 1990s and the resulting UN sanctions.
All the above-mentioned legacies of past conflicts and problems with build- ing stable democracies contribute to the slow pace ofthe EU accession process in the region. In addition, EU members’ appetites for further enlargement have been reduced by the financial crisis years (2007–2013) and associated social and political tensions, the wave of Euro-scepticism and nationalism and also Brexit.
However, there are signs of a changing atmosphere. (i) In his State of the Union address on 13 September 20176, European Commission (EC) President Jean-Claude Juncker recognised the strategic importance of further enlargement once the candidate countries meet the accession criteria. (ii) The new enhanced Western Balkan strategy elaborated by the EC (2018a) sets 2025 as a possible time horizon for Montenegrin and Serbian accession. (iii) The EU – Western Bal- kans Summit in Sofia on 17 May 2018 confirmed the EU’s “unequivocal sup- port” for the European perspectives of the region and outlined priorities of the EU accession process and intra-regional cooperation. They include, among others, acceleration of judicial reforms, extending rule of law advisory and peer-review missions, expanding the Western Balkans Investment Framework and EU Energy Union, building regional electricity market, digital infrastructure, etc. (European Council 2018).
These are good news, because the slow pace of the accession process and the lack of enthusiasm among current EU members to accept new entrants might weaken incentives for further reforms in the Western Balkan countries, reverse those already in place and derail the enlargement process, as already happened partly with Turkey. In turn, this could mean a serious risk of a new round of intra-regional conflicts and geopolitical destabilisation in the EU’s closest neighbourhood .
Faced by such risks, the EU and its member states must not overlook the stra- tegic importance of the Western Balkan region. Geographically, the Western Bal- kan countries form a land bridge and the shortest transit route between the south- east flank of the EU (Greece, Bulgaria and Romania) and its central European
‘core’ (Hungary, Croatia, Slovenia and Austria). The importance of this transit area was demonstrated during the 2015–2016 refugee crisis. The close coopera- tion between the Western Balkan governments and the EU played a major role in closing the Balkan route to refugee flows. Because of its geographical loca- tion and long and complicated land borders with its Western Balkan neighbours,
6 http://europa.eu/rapid/press-release_SPEECH-17-3165_en.pdf.
Croatia could be the major beneficiary of further enlargement7. Economically, the EU is the largest partner of the Western Balkan countries (Section 4).
The geopolitical vacuum created by the delayed prospect of EU membership and decreasing EU’s interest in the region could also encourage other players, such as Russia and China (Fouere 2017) to become more active. To a limited extent, this has already happened. China finances an increasing number of infrastructure projects throughout Central and Eastern Europe, including Western Balkans (Kynge – Peel 2017; Byrne – Mitchell 2017). Russia’s engagement in the region concentrates on geopolitical goals. In particular, Russia wants to discourage the Western Balkan countries from joining NATO8 and is not enthusiastic about their EU member- ship bids. Serbia is a major target for Russian efforts because of the historical and cultural links between the two countries (Hartwell – Sidlo 2017). However, Serbia has been reluctant to take any step that would damage its EU accession prospects and openly distance it from the mainstream EU foreign policy. The exception in this respect is its refusal to join EU sanctions against Russia (in retaliation for the annexation of Crimea and Russia’s involvement in the Donbass conflict). Beyond Serbia, there was some evidence of Russia’s involvement in the failed coup plot in Montenegro in October 2016, which was seen by the ruling Democratic Party of Socialists as an attempt to stop Montenegro’s accession to NATO (Hopkins 2017).
Turkey, another historical player in the region, is active in the economic and cul- tural sphere, especially in Albania, Kosovo and Bosnia and Herzegovina. It also has the ambition to play an active peace-building role in the region (Bechev 2012).
3. MACROECONOMIC AND SOCIAL PERFORMANCE
This section presents an analysis of the macroeconomic and social performance of the Western Balkan region, paying particular attention to the pace of its catch- ing up with the German and the EU’s average income levels.
3.1. Income per capita
In 2016, all Western Balkan countries except Kosovo were classified as upper middle-income countries according to the World Bank Atlas method. This cat-
7 For example, the only road connection between its southern and central parts (the Adriat- ic highway) goes through the territory of Bosnia and Herzegovina, which is an obstacle to Croatia joining the Schengen area.
8 So far two countries of the region joined the NATO: Albania (2009) and Montenegro (2017).
egory includes countries with gross national income (GNI) per capita between
$3,956 and $12,235. However, most Western Balkan countries are towards the bottom of this income group – between $4,180 in Albania and $5,310 in Serbia.
Even Montenegro with the region’s highest GNI per capita ($7,120) recorded approximately only one sixth of German and one fifth of EU’s average GNI per capita. Kosovo, the region’s poorest country with GNI per capita of $3,850, be- longs to a lower middle-income economy group.
Nevertheless, since 2000 the Western Balkan region has seen income per-cap- ita convergence towards Western European levels, represented in our analysis by Germany9 (Figure 1).
The income convergence process was particularly strong between 2000 and 2009, on the background of rapid economic growth in the region (Figure 2) and
9 We chose Germany as a benchmark because of its roles as the largest EU national economy and as a major economic and trade partner of Western Balkan economies. Germany also had a largely positive but rather modest rate of growth in the 2000s and 2010s.
Figure 1. GDP per capita in current international $, PPP adjusted, Germany = 100%, 2000–2017 Source: World Economic Outlook database, April 2018.
Note: IMF staff estimates for Kosovo (the entire period), Albania (2012–2017) and all countries except Ger- many (2017).
12 16 20 24 28 32 36
2000 2001 2002 2003 2004 2005 2006 2007 2008 2009 2010 2011 2012 2013 2014 2015 2016 2017
Albania Bosnia and Herzegovina Kosovo
Macedonia Montenegro Serbia
the global economic boom. The gap in income per-capita levels in purchasing power parity (PPP) between Serbia and Germany narrowed by 9.9 percentage points and between Albania and Germany by 9.1 percentage points. Other coun- tries converged at a slower pace – Montenegro by 6.9 percentage points, Bosnia and Herzegovina by 6.4 percentage points, Macedonia by 4.7 percentage points and Kosovo by only 3.1 percentage points. After 2010, the convergence process slowed down due to the spillover effects of the global and European financial cri- ses. The 2010–2012 period brought even de-convergence, compared to the rela- tive income per capita level of 2009. Since 2012–2013, convergence has restarted but at a slower pace than in the 2000s. By 2017, Serbia had still not managed to regain its relative income per capita level (as compared to Germany) of 2009.
Overall, between 2000 and 2017 Albania saw the biggest progress in in- come per capita convergence (by 10.9 percentage points) followed by Serbia (9.0 percentage points), Montenegro (8.3 percentage points), Bosnia and Herze- govina (7.9 percentage points), Macedonia (5.7 percentage points) and Kosovo (4.5 percentage points). The political and geopolitical factors discussed in section 2 have had at least partial impacts on the observed differences in the pace of convergence .
Figure 2. Real GDP growth, annual per cent change, 2000–2017
Source: World Economic Outlook database, April 2018.
-6,0 -4,0 -2,0 0,0 2,0 4,0 6,0 8,0 10,0 12,0
2000 2001 2002 2003 2004 2005 2006 2007 2008 2009 2010 2011 2012 2013 2014 2015 2016 2017
Albania Bosnia and Herzegovina
Kosovo Macedonia
Montenegro Serbia
3.2. Social challenges
Despite progress in income convergence, the Western Balkan region continues to face social risks associated with poverty, income inequality, unemployment, especially among young people, and other forms of social exclusion.
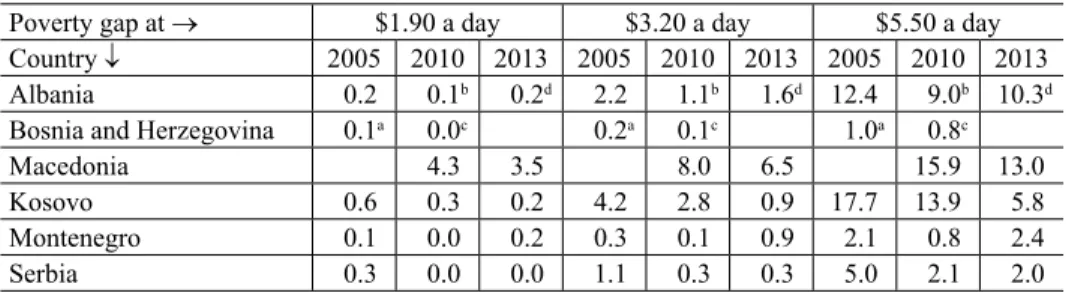
Table 1 shows that there has been some progress in the Western Balkans in re- ducing poverty gaps10 at $1.90, $3.20 and $5.50 a day (in 2011 PPP) since 2001.
For Macedonia, the proportion of people living below the thresholds of $1.90 and
$3.20 almost halved after 2010. Substantial reductions in the percentage of peo- ple living below the thresholds of $3.20 and $5.50 a day were also accomplished in Kosovo (2013 compared to 2005). In Serbia, the percentage of people living below all three thresholds was largely unchanged between 2002 and 2013. In Montenegro, there was even some deterioration for the highest threshold, prob- ably as a result of the global and European financial crises. However, in both Serbia and Montenegro, poverty figures remain low compared to their Western Balkan neighbours.
Table 1. Poverty gap at $1.90, $3.20 and $5.50 a day (2011 PPP), %
Poverty gap at $1.90 a day $3.20 a day $5.50 a day
Country 2005 2010 2013 2005 2010 2013 2005 2010 2013
Albania 0.2 0.1b 0.2d 2.2 1.1b 1.6d 12.4 9.0b 10.3d
Bosnia and Herzegovina 0.1a 0.0c 0.2a 0.1c 1.0a 0.8c
Macedonia 4.3 3.5 8.0 6.5 15.9 13.0
Kosovo 0.6 0.3 0.2 4.2 2.8 0.9 17.7 13.9 5.8
Montenegro 0.1 0.0 0.2 0.3 0.1 0.9 2.1 0.8 2.4
Serbia 0.3 0.0 0.0 1.1 0.3 0.3 5.0 2.1 2.0
Source: World Bank’s World Development Indicators.
Notes: a = 2004, b = 2008, c = 2011, d = 2012. See footnote 10 for poverty gap definition.
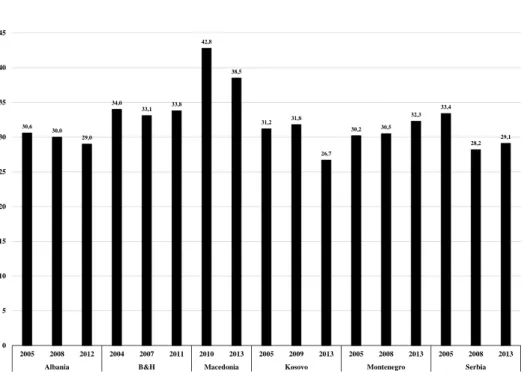
In terms of income inequality, the region does not differ from the rest of Eu- rope, i.e. its Gini index represents a moderate level. The exception was Mac- edonia in 2010, where a high Gini index of 42.8 was recorded (Figure 3), but it declined to 28.5 in 2013. Changes in the Gini index in the region have not fol- lowed a single trend: it has remained broadly stable in Albania and Bosnia and Herzegovina, but has fluctuated somewhat in other countries. World Bank (2017) attributes these trends to problems with job creation prior to 2009, combined with
10 Poverty gap is defined as the mean shortfall in income or consumption from the respective poverty line (counting the non-poor as having a zero shortfall), expressed as a percentage of that poverty line.
low productivity in most sectors. This points to the inefficiency of labour market institutions, one of the legacies of employee self-management in the former Yu- goslavia (Roaf et al. 2014). As a result the region has been always characterised by very high unemployment rates, even before the transition started.
Figure 4 shows that in 2001, the unemployment rate in Kosovo approached 60% of the labour force. Since then, Kosovo’s labour market had improved: its unemployment rate in 2016 was only half the 2001 level, but still close to 30%.
Macedonia has been the second-highest unemployment country in the Western Balkan region, with the unemployment rate exceeding 30% of labour force dur- ing most of the examined period and decreasing only recently. Bosnia and Herze- govina has seen very slow improvements in its unemployment rate since 2006 and had a similar level of unemployment as Kosovo and Macedonia in 2016.
Albania has been the best performing country in this respect (perhaps thanks to the absence of the legacy of the Yugoslav employee self-management model), with an average unemployment rate equal to approximately 15% of the labour force. One might argue that high unemployment results from the informal labour market, which is in turn driven by high taxes and regulatory barriers (Section 5).
Based on Business Environment and Enterprise Performance Survey data, sev-
Figure 3. Western Balkans, Gini indices, 2004–2013 Source: World Bank World Development Indicators.
30,6 30,0
29,0 34,0
33,1 33,8
42,8
38,5
31,2 31,8
26,7
30,2 30,5
32,3 33,4
28,2 29,1
0 5 10 15 20 25 30 35 40 45
2005 2008 2012 2004 2007 2011 2010 2013 2005 2009 2013 2005 2008 2013 2005 2008 2013
Albania B&H Macedonia Kosovo Montenegro Serbia
eral studies (e.g. Koettl-Brodmann et al. 2017) conclude that barriers to entry for new firms and other regulatory impediments contribute to high unemployment in the region.
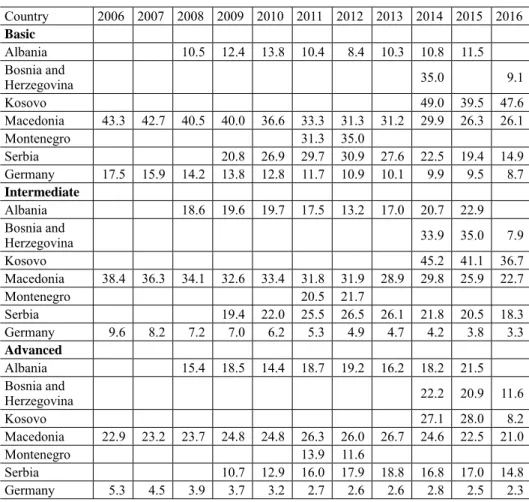
Table 2 shows unemployment rates per educational level. It is notable that bet- ter education has not increased the likelihood of being employed in the Western Balkans (unlike in Germany, which serves as a benchmark) except for the very recent period (2016), when the unemployment rate for people with advanced edu- cation markedly declined in Bosnia and Herzegovina and Kosovo. In Albania, the unemployment rate of people with basic education is systematically lower than the rate for those with intermediate and advanced education levels. These find- ings might suggest a substantial role of the informal labour market (regardless of education level) and a mismatch between education profile and quality and actual demand for labour.
The region also suffers from very high youth unemployment rates (Figure 5), which significantly exceed the overall unemployment rates (Figure 4). The high- est youth unemployment rates are recorded in Kosovo and Bosnia and Herze- govina, while Montenegro and Serbia have the lowest. However, even the Ser- bian and Montenegrin rates (the lowest in the region in 2016) are about five times
Figure 4. Unemployment, % of total labour force, 2000–2017 Source: World Bank World Development Indicators.
Note: Estimates.
10 20 30 40 50 60
2000 2001 2002 2003 2004 2005 2006 2007 2008 2009 2010 2011 2012 2013 2014 2015 2016
Albania B&H Macedonia
Kosovo Montenegro Serbia
and twice as high as in Germany and the EU, respectively. Lack of employment opportunities for young people creates incentives for them to emigrate to more developed countries with better functioning labour markets and more job oppor- tunities.
Emigration adds to the already unfavourable demographic trends in the region (see Section 4). The Western Balkan population is shrinking and aging. The me- dian age of the Western Balkans region is 8.7 years above the world average and is expected to increase in the future (World Bank 2017).
Figure 6 shows that the birth rate has decreased by approximately three births per 1000 people on average in the region from 2000 to 2015. The largest decreases in the numbers of births have been recorded in Kosovo, Albania and Montenegro .
Table 2. Unemployment rates for people with basic, intermediate and advanced education (% of total labour force in respective education group)
Country 2006 2007 2008 2009 2010 2011 2012 2013 2014 2015 2016 Basic
Albania 10.5 12.4 13.8 10.4 8.4 10.3 10.8 11.5
Bosnia and
Herzegovina 35.0 9.1
Kosovo 49.0 39.5 47.6
Macedonia 43.3 42.7 40.5 40.0 36.6 33.3 31.3 31.2 29.9 26.3 26.1
Montenegro 31.3 35.0
Serbia 20.8 26.9 29.7 30.9 27.6 22.5 19.4 14.9
Germany 17.5 15.9 14.2 13.8 12.8 11.7 10.9 10.1 9.9 9.5 8.7 Intermediate
Albania 18.6 19.6 19.7 17.5 13.2 17.0 20.7 22.9
Bosnia and
Herzegovina 33.9 35.0 7.9
Kosovo 45.2 41.1 36.7
Macedonia 38.4 36.3 34.1 32.6 33.4 31.8 31.9 28.9 29.8 25.9 22.7
Montenegro 20.5 21.7
Serbia 19.4 22.0 25.5 26.5 26.1 21.8 20.5 18.3
Germany 9.6 8.2 7.2 7.0 6.2 5.3 4.9 4.7 4.2 3.8 3.3
Advanced
Albania 15.4 18.5 14.4 18.7 19.2 16.2 18.2 21.5
Bosnia and
Herzegovina 22.2 20.9 11.6
Kosovo 27.1 28.0 8.2
Macedonia 22.9 23.2 23.7 24.8 24.8 26.3 26.0 26.7 24.6 22.5 21.0
Montenegro 13.9 11.6
Serbia 10.7 12.9 16.0 17.9 18.8 16.8 17.0 14.8
Germany 5.3 4.5 3.9 3.7 3.2 2.7 2.6 2.6 2.8 2.5 2.3
Source: World Bank World Development Indicators.
Figure 5. Youth unemployment, % of labour force aged 15–24, 2015 Source: World Bank World Development Indicators.
Note: Estimates.
Figure 6. Birth rate, crude (per 1,000 people), 2000–2015 Source: World Bank World Development Indicators.
Note: Crude birth rate indicates the number of live births during the year, per 1,000 people, estimated at mid-year.
39,8
62,3
47,3
57,7
37,7
43,3
22,7
7,2
0 10 20 30 40 50 60 70
Albania B&H Macedonia Kosovo Montenegro Serbia EU Germany
0 6 12 18 24
Albania B&H Macedonia Kosovo Montenegro Serbia Germany
2000 2005 2010 2015
However, Kosovo and Albania continue to have the highest birth rates. In the face of these unfavourable demographic trends, labour productivity would need to increase significantly to offset the future deficit in the working age population.
Pension, healthcare and long-term care systems must be also adjusted to the new demographic reality.
3.3. Monetary policy regimes and infl ation
Four Western Balkan countries do not conduct sovereign monetary policy. Kos- ovo and Montenegro use the euro as their currency, Bosnia and Herzegovina has a euro-denominated currency board, and Macedonia pegs to euro (in a relatively narrow horizontal band)11. The exchange rate regimes in Albania and Serbia can be characterised as managed float and both countries declare inflation targeting frameworks.
In the second half of the 1990s and the early 2000s, pegs to the German Mark and then to the euro helped Croatia, Macedonia, Bosnia and Herzegovina, Mon- tenegro and Kosovo to disinflate quickly, given their legacies of high inflation/
hyperinflation in the early 1990s12. However, during 2003–2017 (Figure 7) the choice of monetary regime seemed to be less important from this point of view.
Despite its inflation targeting framework, Serbia was the worst performer (at least until 2013), but Albania with the same regime recorded the lowest and most stable inflation in the region. Kosovo, Montenegro and Bosnia and Herzegovina experienced significant volatility and also Macedonia to a lesser degree. This means that small open economies, which have given up their monetary sover- eignty, experience more volatile inflation because of its exogenous character driven by real and financial shocks in external markets and changes in exchange rates between major currencies. However, it is fair to say that in 2014–2017, all Western Balkan countries converged to low and relatively stable inflation rates.
The choice of monetary regime did not matter for resilience to crisis-related shocks. Figure 2 shows that the growth rates of Albania (flexible exchange rate) and Kosovo (unilateral euroisation) were the least affected by the global financial crisis, while Montenegro (unilateral euroisation) and Serbia (flexible exchange rate) were the most seriously affected. That is, nominal depreciation of national
11 IMF (2016, Table 2) classifies the exchange rate regime of Macedonia as the “stabilised ar- rangement” anchored to the euro.
12 Serbia and Montenegro, which formed (for a certain time) a new Yugoslav federation in 1992, suffered from the second fastest hyperinflation in world history. Over 25 months be- tween January 1992 and February 1994, its consumer price index increased by a factor of 78,000,000,000,000,000,000,000! (Koen – De Masi 1997).
currency was not necessarily a better adjustment tool in comparison with the so- called internal devaluation (decreasing nominal wages and prices) that countries using euro, having currency board or stable peg had to rely on.
Monetary regimes can really matter for financial stability. All Western Balkan countries, regardless their declared and actual monetary regimes, are heavily eu- roized (Table 3; note this data does not include Euro or Dollar cash holdings). This is not a problem in Kosovo and Montenegro, where the euro has been adopted as the official national currency, but it is a serious vulnerability in other countries.
Furthermore, despite successful disinflation and repeated recommendations from the IMF (see, for example, IMF 2017a, b, c) there has been no visible progress in reducing euroization (Table 3) in favour of assets and liabilities in national currencies. From that perspective a hard peg (unilateral euroization or a credible currency board) can be seen as the factor that increases financial stabil- ity (thanks to the elimination of currency depreciation risk) and recognises high exposure of the region to euro-denominated transactions in trade, tourist services and remittance flows, among others.
-4 0 4 8 12 16
2003 2004 2005 2006 2007 2008 2009 2010 2011 2012 2013 2014 2015 2016 2017
Albania B&H Kosovo
Macedonia Montenegro Serbia
Figure 7. Inflation, end-of-period consumer prices, 2003–2017, % Source: IMF World Economic Outlook database, April 2018.
3.4. Fiscal accounts
Most Western Balkan countries reported fiscal surpluses or positions close to fiscal balance during the pre-crisis period of the early and mid-2000s, with the exception of Albania, which ran continuous high general government deficits un- til 2015 (Table 4).
Table 4. General government net lending/borrowing, 2003–2017, % of GDP
Country 2003 2004 2005 2006 2007 2008 2009 2010 2011 2012 2013 2014 2015 2016 2017 Albania –5.0 –5.2 –3.5 –3.3 –3.2 –4.9 –6.6 –3.5 –3.5 –3.4 –5.2 –5.5 –4.1 –1.8 –1.4a Bosnia and
Herzegovina –0.4 –0.2 0.8 2.1 0.2 –3.9 –5.3 –4.1 –2.7 –2.7 –1.8 –2.9 –0.2 0.3 1.9a Kosovo 1.6 –4.6 –3.1 2.7 7.0 –0.2 –0.6 –2.2 –1.8 –2.6 –3.1 –2.4 –1.8 –1.2 –1.2a Macedonia –0.1 0.4 0.2 –0.5 0.6 –0.9 –2.6 –2.4 –2.5 –3.8 –3.8 –4.2 –3.5 –2.7 –2.7 Montenegro –4.1 –2.5 –1.4 4.3 8.4 –2.3 –6.7 –4.9 –6.7 –5.8 –4.5 –0.7 –6.2 –6.2 –7.1a Serbia –2.7 0.1 1.1 –1.0 –0.9 –1.9 –3.6 –3.7 –4.1 –6.8 –5.3 –6.2 –3.6 –1.2 1.2a Source: IMF World Economic Outlook database, April 2018.
Note: a IMF staff estimates.
However, since 2008, the situation has deteriorated everywhere, though Bos- nia and Herzegovina has suffered less than others. There was some improvement in Albania, Bosnia and Herzegovina and Serbia in 2016–2017.
The changes in fiscal balances have had an impact on the level of general government gross debt to GDP (Figure 8). In particular, the global financial crisis of 2008-09 reversed the previous trend of decreasing debt-to-GDP ratios. As a result, in 2017, general government gross debt exceeded 70% of GDP in Albania and was close to that level in Montenegro, posing a serious risk to their fiscal sus- tainability. In Serbia, it still exceeded the level of 60% of GDP despite its decline
Table 3. Share of foreign-exchange denominated liabilities and loans in total liabilities in loans, 2006–2016, %
Country
Foreign-exchange denominated
liabilities Foreign-exchange denominated loans
2006 2010 2013 2016 2006 2010 2013 2016
Albania n.a. 50.5 50.0 52.1 n.a. 68.6 61.9 57.8
Bosnia and
Herzegovina 62.8 67.0 63.8 57.4 71.0 70.0 68.8 62.6
Kosovo n.a. 4.6 4.6 n.a. n.a. 0.2 0.1
Macedonia 56.9 57.6 50.2 46.3 52.7 58.8 52.7 44.9
Serbia n.a. n.a. 76.7 71.1 n.a. n.a. 71.6 69.4
Source: IMF Financial Soundness Indicators for Albania, Bosnia and Herzegovina, Kosovo and Macedonia, IMF (2017c, Table 8) for Serbia.
Note: Data for Montenegro is not available.
in 2016–2017 by more than 14 percentage points of GDP. This country recorded a very high level of public debt in the early 2000s (225% of GDP in 2000) – a legacy of the 1990s with its economic and political turmoil, UN sanctions and engagement in violent regional conflicts. It managed to bring it down to the mod- est 32.4% of GDP in 2008 but allowed its increase again due to the 2008–2009 financial crisis.
4. EXTERNAL ECONOMIC RELATIONS AND THE ROLE OF THE EU In this section, we analyse trade flows of the Western Balkan countries, outward migration and labour remittances, incoming FDI and official development assist- ance (ODA) to the region.
4.1. Trade
Trade and economic integration with the EU have been major growth factors in transition economies since the beginning of the 1990s (Roaf et al. 2014). This was also the case for the Western Balkan region after the end of the 1990s politi-
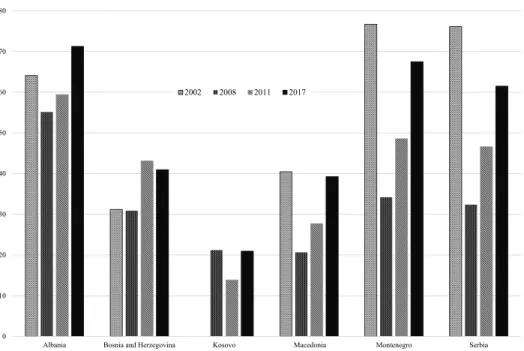
0 10 20 30 40 50 60 70 80
Albania Bosnia and Herzegovina Kosovo Macedonia Montenegro Serbia
2002 2008 2011 2017
Figure 8. General government gross debt, % of GDP, 2000–2017 Source: IMF World Economic Outlook database, April 2018.
cal and economic turmoil. At first glance, the Western Balkan countries’ imports and exports seem to represent high shares of GDP (Figures 9 and 10). However, such an observation might not tell us the entire story.
(i) High shares of exports and imports relative to GDP are a natural phenom- enon in small economies. When compared to three small economies that joined the EU in 2004 and have since introduced the euro (Slovenia, Slovakia and Es- tonia), the differences, especially on the export side, are visible. Even if the gap has been reduced since 2000 (Figures 9 and 10), there is still a long way to go to catch up with the benchmark countries, especially for Kosovo, Albania and Bosnia and Herzegovina.
(ii) In some cases (Montenegro, Macedonia, Albania) imports and exports relative to GDP have been volatile, not only during the global financial crisis (2008–2009), which affected negatively almost all the analysed countries.
(iii) The comparison of import and export shares relative to GDP (Figures 9 and 10) makes it clear that all countries have large trade deficits, which are part- ly compensated by the positive factor income balances, mainly flows of labour remittances (Section 4.2 and Table 6). The large current account imbalances
Figure 9. Imports of goods and services, % of GDP, 2000–2016 Source: World Bank World Development Indicators.
60 70 80 90 100
Kosovo Albania B&H
Macedonia Montenegro Serbia
Estonia Slovenia Slovakia
0 10 20 30 40 50
2000 2004 2007 2009 2012 2016
Figure 10. Exports of goods and services, % of GDP, 2000–2016 Source: World Bank World Development Indicators.
Figure 11. Value of imports and exports, 2000–2016, 2000=100 Source: World Bank World Development Indicators.
100
90 100
Kosovo Albania B&H
Macedonia Montenegro Serbia
70
80 Estonia Slovenia Slovakia
60 70
40 50
30 40
10 20
0 10
2000 2004 2007 2009 2012 2016
0,0 100,0 200,0 300,0 400,0 500,0 600,0 700,0 800,0 900,0 1000,0
2000 2001 2002 2003 2004 2005 2006 2007 2008 2009 2010 2011 2012 2013 2014 2015 2016
Albania-imports B&H-imports
Macedonia-imports Serbia-imports
Albania-exports B&H-exports
Macedonia-exports Serbia-exports
(Figure 12), especially in Montenegro, have been historically financed by inflows of FDI (section 4.3 and Table 7) and ODA (Section 4.4 and Figure 16). However, the volume of ODA has been diminishing over time and the net private capital inflows also went down after the global financial crisis of 2008–2009. There- fore, the current account and trade balances have had to adjust and this has been achieved by faster growth of exports than of imports (Figure 11). Nevertheless, Montenegro’s current account deficits continued to be very high by international comparison, even after the 2008–2009 crisis. They increased again in 2015–2017 once the economic recovery had been started.
According to the World Bank (2017), services account for more than two thirds of the total exports of goods and services, with an overall low export sophisti- cation. In 2013, according to the UNCTAD trade database, travel and tourism played a major role in service exports from Albania, Bosnia and Herzegovina and Montenegro, while other services dominated exports from Macedonia and Serbia (data for Kosovo was missing). Other services were also the largest item in the structure of service imports in all countries except Albania, where travel and tourism services dominated the import side. In most cases, exports of goods
Figure 12. Current account balances, % of GDP, 2001–2017 Source: IMF World Economic Outlook database, April 2018.
Note: 2017 data for all countries except Macedonia contains IMF staff estimates.
-50 -40 -30 -20 -10 0 10
2001 2002 2003 2004 2005 2006 2007 2008 2009 2010 2011 2012 2013 2014 2015 2016 2017
Albania B&H Kosovo
Macedonia Montenegro Serbia
were dominated by metals, minerals, agriculture and food products, textiles and footwear and chemical products. Only Serbia and Macedonia represented a more diversified export structure (Koloyanchev et al. 2018).
Figures 13 and 14 show that the EU and Western Balkan neighbours are the dominant trade partners of each Western Balkan country, accounting to at least 70% of their total trade together. For Western Balkan countries’ exports, this dominance is even stronger. That is, the region is already closely integrated with the EU in terms of trade links, even if the EU’s share has declined slightly compared to 2006. Nevertheless, the potential of intra-regional trade remains un- tapped due to continuous non-tariff barriers and poor transportation infrastructure (Koloyanchev et al. 2018).
Among other partners, Russia has played some role in supplying the region, especially Serbia, Macedonia and Bosnia and Herzegovina with energy resources (oil and gas) but Russia’s role has gradually diminished over time (despite Rus- sia’s interest in the Western Balkans energy sector and the Druzhba and Adrian pipelines). Russia is also one of the destinations for Serbian exports, but not ex-
62,5 60,6 51,2 47,3
62,0
8,8 6,8 6,2 9,0
8,3
4,4 7,9
7,9 4,3 5,2
3,3
3,5
6,6 12,6 9,8
30,5 3,9
12,4 11,4 25,4
9,8 14,5
0% 10% 20% 30% 40% 50% 60% 70% 80% 90% 100%
Albania B & H Macedonia Montenegro Serbia
EU China Russia Turkey Western Balkans Rest of the world
Figure 13. Geographical structure of imports, % of total, 2016 Source: International Trade Center (Trade Map).
Note: Kosovo is omitted because of missing data.
ceeding a few per cent of the total. The shares of China and Turkey are also lim- ited and concentrated on the import side. However, the growth in imports from both countries is very high, so their shares might increase in future.
4.2. Outward migration and remittances
Not surprisingly, a large proportion of the Western Balkan population has emi- grated to more developed countries (in particular to Western and Northern Eu- rope), as a result of the violent conflicts of the 1990s, lower income per capita and chronic high unemployment, especially among young people (see Section 3). Mass emigration started in 1960s from the former Yugoslavia and in the early 1990s from Albania. Albania and Bosnia and Herzegovina had the largest number and shares of their nationals living abroad in 201513 (Table 5).
13 The numbers do not include short-term (seasonal) labour migrants.
Figure 14. Geographical structure of exports, % of total, 2016 Source: International Trade Center (Trade Map).
Note: Kosovo is omitted because of missing data.
77,7 70,8
78,7 35,6
64,4
3,1 5,9
5,3
4,2
13,6 13,1
12,5 39,8
17,8
4,5 10,5
5,3 16,5
10,5
0% 10% 20% 30% 40% 50% 60% 70% 80% 90% 100%
Albania B & H Macedonia Montenegro Serbia
EU China Russia Turkey Western Balkans Rest of the world
Personal remittances play an important economic and social role in all Western Balkan countries except Macedonia (Table 6). In Kosovo and Bosnia and Herze- govina their share of GDP exceeds 10%; in Albania, Montenegro and Serbia they amount to slightly less than 10%. Since 2000, their relative importance has grad- ually decreased in Bosnia and Herzegovina, Kosovo, Albania and Macedonia, while it has increased in Montenegro and remained broadly stable in Serbia.
4.3. Foreign direct investment (FDI)
The Western Balkans’ deep economic integration with the EU is seen not only in terms of trade and migration (sections 4.2-4.3), but also in investment. Most FDI in the Western Balkan countries, except Kosovo, originates from the EU (Figure 15).
Progress in EU accession might bring even more European FDI (Stehrer – Holzner 2018). Other major sources of FDI in the Western Balkans include Switzerland (entire region), Canada (Albania), Serbia (Bosnia and Herzegovina, Montenegro), Russia (Montenegro, Bosnia and Herzegovina, Serbia), Turkey (Albania, Kosovo, Macedonia) and Norway (Serbia) (Hunya – Schwarzhappel 2016).
Table 5. Total migrant stock, number of people and % of population, 2015 Country of origin Albania Bosnia and
Herzegovina Montenegro Serbia Macedonia Migrants stock
worldwide 1,122,910 1,650,772 138,356 964,585 516,024
% of population 38.4 46.7 22.0 10.9 24.8
Source: United Nations, Department of Economic and Social Affairs, Population Division (2015, 2017). Trends in International Migrant Stock: Migrants by Destination and Origin (United Nations database, POP/DB/MIG/
Stock/Rev.2015); World Population Prospects: The 2017 Revision, DVD Edition and authors’ calculations.
http://www.un.org/en/development/desa/population/migration/data/estimates2/estimates15.shtml.
Note: Estimates refer to the total number of international migrants by country of origin and refer to 1 July of the reference year (2015). In estimating the international migrant stock, international migrants have been equated with the foreign-born population whenever this information is available.
Table 6. Personal remittances, received, % of GDP
Country 2000 2001 2002 2003 2004 2005 2006 2007 2008 2009 2010 2011 2012 2013 2014 2015 2016 Albania 16.4 17.2 16.5 15.5 15.9 15.8 15.1 13.7 14.5 14.3 13.4 12 11.5 8.6 8.6 9.2 8.9 Bosnia and
Herzegovina
28.7 26.1 22.5 20.8 20.5 18.2 16.7 17 14.2 12.1 10.6 10.5 10.7 10.7 11.4 11.1 10.9 Kosovo 17.1 18.8 18.9 19 18.3 18.7 17.3 14.9 14.6 14 14.9 15.1 14.8
Montenegro 5.4 6.6 7.3 8.1 8.8 9.7 9.5 9.4 9.4 9.1
Macedonia 2.1 2 2.6 3.5 3.7 3.6 3.9 4.1 4.1 4.1 4.1 4.1 4 3.5 3.2 3.1 2.7
Serbia 9.3 7.2 10.9 10.4 8.5 8.7 8.8 8.4 9.1 8.4
Source: World Bank’s World Development Indicators.
Note: Personal remittances comprise personal transfers and compensation of employees.
Despite the lost decade of the 1990s, FDI inflows into the Western Balkan countries accelerated in the 2000s and 2010s, including the period following the 2008–2009 global financial crisis (Table 7)14. As a result, the cumulative stock of inward FDI relative to GDP exceeds the average in transition economies (Figure 16). Montenegro is the absolute leader with the stock of FDI in 2016 equal to 113.0% of GDP.
FDI has mainly been directed to the financial sector, telecommunications, the energy sector, wholesale and retail, construction, real estate and manufacturing (Estrin – Uvalic 2016; Hunya – Schwarzhappel 2016). For example, the region’s banking sector is owned largely by foreign investors, predominantly from the EU. Many banks in the Western Balkan countries are part of the pan-European banking groups.
This concerns, for example, Raiffeisen Bank (Austria), which has its daughter banks in Albania, Bosnia and Herzegovina, Kosovo and Serbia; Intesa Sanpaolo
14 Bosnia and Herzegovina is the exception. After the 2008–2009 crisis, lower FDI inflows to this country seem to have reflected its domestic political troubles (see Section 2) and delayed prospect of EU accession.
Figure 15. Share of the EU28 in the total stock of FDI in Western Balkan countries, %, 2014 Source: Hunya – Schwarzhappel (2016).
64,5
60,8
33,8
81,6
62,3
77,6
0 10 20 30 40 50 60 70 80 90
Albania B&H Kosovo Macedonia Montenegro Serbia
(Italy) with subsidiaries in Albania, Bosnia and Herzegovina and Serbia; National Bank of Greece owning subsidiaries in Albania and Macedonia; UniCredit (Italy) in Bosnia and Herzegovina and Serbia; Societe Generale (France) in Albania, Macedonia and Serbia; Nova Ljubljanska Banka (Slovenia) in all Western Balkan countries except for Albania; and Pireaus Bank (Greece) in Albania and Serbia.
In 2016, the share of banks with foreign ownership in total assets of banking sec- tor varied between 73.0% in Montenegro and 85.5% in Bosnia and Herzegovina (Kozaric – Begovic 2018).
Table 7. Inward FDI, annual flows, % of GDP, 2000–2016
Country 2001 2002 2003 2004 2005 2006 2007 2008 2009 2010 2011 2012 2013 2014 2015 2016 Albania 5.3 3.1 3.2 4.8 3.3 3.6 6.2 7.6 8.3 8.8 6.8 6.9 9.9 8.4 8.2 9.2 Bosnia and
Herzegovina 2.0 3.8 4.4 4.9 5.5 6.0 11.5 5.2 1.4 2.4 2.7 2.3 1.5 2.9 1.7 1.7
Montenegro 21.1 36.6 18.4 12.3 15.2 10.0 10.8 17.4 5.5
Serbia 7.2 6.0 3.7 9.3 2.7 3.9 3.9 5.4 5.2
Serbia and
Montenegro 1.1 2.8 5.8 3.4 6.5 13.1 11.0
Macedonia 12.1 2.3 5.7 1.5 6.3 8.3 5.9 2.1 2.3 4.6 1.5 3.1 2.4 2.4 3.9 Transition
economies 1.9 2.0 2.9 3.5 2.9 4.3 4.9 5.1 3.5 3.0 2.9 2.2 2.8 2.0 1.9 3.6 Source: UNCTAD, http://unctadstat.unctad.org/wds/TableViewer/tableView.aspx.
Figure 16. Stock of inward FDI, % of GDP, 2016 Source: UNCTAD, http://unctadstat.unctad.org/wds/TableViewer/tableView.aspx.
40,7 41,9
113,0
68,5
49,1
38,9
0,0 20,0 40,0 60,0 80,0 100,0 120,0
Albania B&H Montenegro Serbia Macedonia Transition economies
4.4. Offi cial development assistance (ODA)
In the early 2000s, the Western Balkan countries received large amounts of ODA (Figure 17), reflecting the desire of the international community to support their post-conflict recovery and reconstruction, the transition to democracy and market economy, and their integration with the EU (Sections 2 and 6). However, with their progress in economic convergence (Section 3.1), the size of ODA flows gradually diminished to between 0.9-3.0% of GNI in 2016, except for Kosovo, where they still amounted to 6.7% of GNI (having declined from 13.9% of GNI in 2009).
5. INSTITUTIONAL CHALLENGES
The Western Balkan region lags behind other Central and Eastern European (CEE) countries (those that already joined the EU) in terms of institutional re- forms. As noted by the World Bank (2017: 19–20), by 2013, the Western Balkan countries had made the same progress in reforms, measured by the EBRD transi- tion scores, as the group of smaller transition European economies (STEEs) had by 1996 (Figure 18).
Figure 17. Net inflows of ODA, % of GNI Source: World Bank World Development Indicators.
0,0 2,0 4,0 6,0 8,0 10,0 12,0 14,0 16,0 18,0
2000 2001 2002 2003 2004 2005 2006 2007 2008 2009 2010 2011 2012 2013 2014 2015 2016
Albania B&H
Kosovo Macedonia
Montenegro Serbia
Before 1991, the Western Balkan countries were moving faster on reforms than STEEs (Figure 18) thanks to the legacy of the Yugoslav ‘market socialism’
system. However, the political and economic turmoil of 1990s changed the situ- ation and since then the Western Balkan countries have lagged behind. Sanfey et al. (2016) offer an optimistic prediction, arguing that the Western Balkans can narrow the gap in the coming years under the right circumstances.
The delayed reforms have a negative impact on the business climate and the entire institutional environment, slowing down economic convergence with the EU and the EU accession process. However, not all the global surveys rate the Western Balkan economies unfavourably. For example, the annual World Bank Doing Business 2018 Survey ranks Macedonia eleventh globally and second in the Europe and Central Asia region (that is, among all transition economies). Kosovo, Montenegro and Serbia, respectively, occupy the 40th, 42nd and 43rd positions in this ranking. Bosnia and Herzegovina is the worst regional performer (86th place) but is still better than many economies of the former Soviet Union (Table 8).
Figure 18. Average EBRD transition scores: Western Balkans and STEE countries*
Source: Bruegel based on EBRD.
Notes: EBRD transition score is calculated as the simple average of six EBRD indicators: price liberalisation, trade and foreign exchange system, small-scale privatisation, large scale privatisation, governance and enter- prise restructuring, and competition policy, each rated on a scale from 1 (no reform) to 4.33 (maximum reform).
Data for Kosovo is missing.
* STEEs = Bulgaria, Croatia, Estonia, Latvia, Lithuania, Slovakia and Slovenia.
1 2 3 4
1989 1990 1991 1992 1993 1994 1995 1996 1997 1998 1999 2000 2001 2002 2003 2004 2005 2006 2007 2008 2009 2010 2011 2012 2013 2014 AverageWB5 Average7STEEs