Does the level of human capital matter for FDI in the Western Balkan countries?
MARIJA PETROVI C-RAND ELOVI C
1, TAMARA RAD ENOVI C
1p, BOJAN KRSTI C
1and VLADIMIR MI CI C
21Faculty of Economics, University of Niš, Trg. kralja Aleksandra Ujedinitelja 11, 18105, Niš, Serbia
2Faculty of Economics, University of Kragujevac, Kragujevac, Serbia
Received: October 15, 2018 • Revised manuscript received: December 12, 2018 • Accepted: January 9, 2019
© 2020 Akademiai Kiado, Budapest
ABSTRACT
The purpose of this paper is to investigate the importance of human capital, as location determinant for the foreign direct investment (FDI) decisions in the Western Balkan Countries between 2008 and 2016. Apart from the human capital indicators, several location determinants were used as control variables. The hy- pothesis has been tested by employing correlation and regression analysis. The empirical findings revealed the positive impact of primary education and the negative impact of tertiary education on the inflows. The analysis showed that political stability and control of corruption are more important location determinants than human capital. Therefore, the policy measures should be directed towards the improvement of institutional framework and creating a supporting environment for the FDI inflows.
KEYWORDS
human capital, education, foreign direct investment, Western Balkan countries
JEL CLASSIFICATION INDICES F21, I25, P30
pCorresponding author. E-mail: tamaracvetkovic81@yahoo.com Acta Oeconomica70 (2020) 3, 381–405
DOI:10.1556/032.2020.00019
1. INTRODUCTION
During the last three decades, numerous studies have confirmed that foreign direct investment (FDI) is the main driver for economic growth of the developing and transition countries (Arandelovic–Petrovic-Randelovic 2011). FDI, by its nature, is a complex investment package.
This attribute gives special advantages to this form of international private capital in generating a potentially large positive impact on the rate of growth in the host country.
Capital transfer through FDI complements domestic savings, and thus, creates the possibility for investments greater than domestic accumulation. Supplementary capital from abroad acts as a crucial force for turning out from the vicious circle of poverty, since the increased efficiency in using resources leads to increased production and, consequently, increases the economic growth rate of a host country. The primary effect of the capital transfer to economic growth is reflected in the capital growth in width. This form of development is considered to be extensive, since there is no change in the relationship between capital and labour, as the results of the new jobs and increased employment in a host country.
In addition to the primary effect on the capital growth in width, the capital transfer through FDI can be accompanied by a secondary effect on the increase of capital in depth, i.e. changing the relationship between capital and labour, and increasing productivity. This secondary effect on growth, that arise from the transfer of intangible capital (modern technology) through FDI in the host country may occur only in those countries which have a sufficient level of human capital, which will be able to absorb the advanced technology, since human capital and advanced technology tend to become the complementary inputs. In this regard,Borenzstein et al. (1998) argued that the effects of FDI on economic growth largely depend on the host country’s level of human capital. They found that FDI had a growth enhancing effect, if the host country possessed human capital above the critical threshold of 0.52 years of secondary schooling. Based on the same criteria for assessing the absorptive capacity of the host country,Xu (2000)came to the conclusion that, in contrast to the previous study, this human capital threshold was about 1.9 years.
According to the OECD (as cited in Keeley 2007: 29), human capital is defined as ‘the knowledge, skills, competencies and attributes embodied in individuals that facilitate the crea- tion of personal, social and economic well-being.’De La Fuente–Ciccone (2003: 7) indicate that
‘the knowledge and skills embodied in humans that are acquired through schooling, training and experience are useful in the production of goods, services, and further knowledge.’
As an integral part of the host country’s investment environment, improvements in human capital can lead to increasing attractiveness of the potential host country for FDI.‘Countries that receive FDI with the highest potential for capability development are, ironically, those with strong domestic absorptive capacities’ (Lall – Narula 2004: 452). Human capital does not represent only the determinant of attracting FDI but is also one of the factors which potentially enables the absorption of the growth enhancing effects of FDI. Since FDI enables transfer of other production factors besides capital, such as entrepreneurship, technological and managerial know-how, when choosing the location for FDI the multinational corporations are taking into account expected returns on all invested assets. In other words, FDI are directed towards those countries that, apart from high returns on capital, are also offering a high skilled labour with specific knowledge and skills.
Further, during the development process of a country the relative importance of different determinants of FDI is changing. Each country has location specific advantages whose role in making decisions about FDI differs depending on the investment motives, sectoral structure, type and the investors’ size. Thus, a country needs to offer location specific advantages compared to other countries in order to become attractive destination for those types of FDI that will contribute to the fulfilment of its specific development goals.
Technological inferiority of the developing and transition countries causes their lagging behind of the developed countries. Therefore, the development of the developing and transition economies largely depends on the technology transfer from the developed countries. Theory and practice have confirmed that the role of FDI in the process of economic development is not linked solely to their function of additional source of capital, but also in fostering growth through the transfer of new technological solutions, thus creating conditions for achieving a qualitative leap in economic development. Implementation of modern technology in the eco- nomic flows of the developing host countries initiates the need for economic restructuring according to the demands of a market economy. Such changes in the economy accelerate the pace of development through overcoming structural imbalances and disharmony accumulated during the previous development period.
In addition to direct technology transfer through FDI, that goes from the parent company to affiliates abroad, the most important channel for the indirect transfer of the modern technology appears to be the external effects or‘spillovers,’ which lead to increased human capital and productivity in the host country (Blomstrom–Kokko 1997, 2003). In fact, the engagement and training of the necessary workforce in the multinational corporations’affiliations, by organizing various training programs and seminars abroad, represent a potential channel for the expression of the spillover effects, contribute to the increasing qualification structure of the workforce, and therefore, increase human capital in the host country. In this way FDI‘not only introduce new ideas but also strengthens the human capital base needed to adapt these ideas to the local market’(Blomstrom–Kokko 2003).
While FDI and human capital represent important individual sources of growth, ‘they can also reinforce each other through possible“complementary effects”’(Checci et al. 2007: 2), and significantly contribute to the acceleration of the economic growth pace. However, in the available empirical literature the consensus does not exist on whether and what kind of the relationship between these two growth factors exists.
Identifying the location determinants of the FDI has become an inevitable requirement in designing and implementing the host country’s policies towards FDI. In the literature dealing with FDI, a significant part is devoted to the analysis of the FDI location determinants. Espe- cially, the investigation of the determinants of the FDI location plays an important role in understanding the geographic distribution of inward FDIflows. However, the consensus does not exist among researchers on the most influential determinants of FDI.
During the period of rapid FDI growth in the world in the 1980s, the five West Balkan Countries (Albania, Bosnia and Herzegovina, Macedonia, Montenegro and Serbia, for short:
WBC) did not seize the opportunities for attracting considerable FDI flows and exploiting them for the development purposes. Modest FDI inflows in this region were the consequence of political instability caused by war conflicts, destructions of institutions after the break-up of SFR Yugoslavia in 1991 (Brada et al. 2016), and also by NATO military intervention in 1999. In addition, they were the consequence of macroeconomic instability due to the‘hyperinflation,
Acta Oeconomica70 (2020) 3, 381–405 383
reversals in growth recovery, high public deficits and depreciating exchange rates’ (Estrin – Uvalic 2016: 5).
Numerous studies indicate that the developing and transition countries can increase their attractiveness as an investment location if they follow the policy that contributes to the rising level of education and qualification structure of the workforce, and consequently, the human capital development in the host country. However, relatively scarce empirical research exists in this field in the case of the WBC. Therefore, the aim of the paper is to examine the impact of human capital, as location determinant, on the FDI in the transition WBC.
The paper is structured as follows. After the introduction, in Section 2, the macroeconomic environment and FDI inflows in the WBC are elaborated, followed by the literature review of the most influential studies about the connection between the FDI and human capital in Section 3.
Section 4 presents the data and methodology of the research, while Section 5 summarises the empirical results. Finally, in the conclusion the mainfindings of the research are presented along with the recommendations for the policy makers.
2. MACROECONOMIC ENVIRONMENT AND FDI INFLOWS IN THE WBC
At the beginning of the 21st century, after a decade of stagnation, five WBC have firmly entered into the second phase of transition, with the aim of building adequate market institutions and developing democratic relations in the society. Numerous economic and political reforms have been implemented to fulfil a defined goal until 2008.
The analysis of the results of the implemented reforms and economic policy measures in the WBC shows that in the pre-crisis period the WBC achieved dynamic economic growth, with an average annual growth rate of 5.1% (Table 1).
Moreover, looking at the regional level, by 2008 the reform efforts have resulted in doubling of GDP per capita (PPP $) (regional average $11,296) as compared to 2001 (regional average
$7,825),1‘riding the tide of deeperfinancial and trade integration with the rest of Europe, high capital inflows, rapid credit expansion, and productivity growth’(Murgasova et al. 2015: 16).
The strategic orientation towards the modern market economy, the acceleration of the privatization process by involving foreign investors, and creating an enabling legal environment for these investors, have all increased the attractiveness of the WBC for FDI. Consequently, in the period of 2001–2008, the dynamic growth of FDI in this region was recorded, with an average annual growth rate of 68%, while the cumulative net inflows of FDI reached an amount of $32.8 billion (Fig. 1).
The global financial crisis has interrupted the period of continuous GDP growth and revealed the weaknesses of the previous unsustainable growth model. This model was charac- terised by growing domestic consumption initiated by rapid credit growth, with subsequent deepening of the current account deficit and rising indebtedness of the private sector. The general assessment was that such growth has been more a result of global liquidity and increased capital inflows, than a result of substantial progress in economic reforms.
After 2008, with the worsening of the economic performance of the WBC (Table 1), due to the spillover of the negative effects of the global crisis, the inward FDI flows have dropped
1Data table is available from the authors upon request.
Table 1.Real GDP growth rate in the WBC (2001–2016)
Country 2001 2002 2003 2004 2005 2006 2007 2008 Average
Albania 8.3 4.5 5.5 5.5 5.5 5.9 6.0 7.5 6.1
Bosnia and Herzegovina 2.4 5.1 3.9 6.3 4.2 5.7 6.0 5.6 4.9
FYR Macedonia –3.1 1.5 2.2 4.7 4.7 5.1 6.5 5.5 3.4
Montenegro 1.1 1.9 2.5 4.4 4.2 8.6 10.7 6.9 5.0
Serbia 5.0 7.1 4.4 9.0 5.5 4.9 5.9 5.4 5.9
Average 2.7 4.0 3.7 6.0 4.8 6.0 7.0 6.2 5.1
Country 2009 2010 2011 2012 2013 2014 2015 2016 Average
Albania 3.4 3.7 2.5 1.4 1.0 1.8 2.2 3.4 2.4
Bosnia and Herzegovina –0.8 0.8 0.9 –0.9 2.4 1.1 3.0 2.0 1.1
FYR Macedonia –0.4 3.4 2.3 –0.5 2.9 3.6 3.8 2.4 2.2
Montenegro –5.7 2.5 3.2 –2.7 3.5 1.8 3.4 2.5 1.1
Serbia –3.1 0.6 1.4 –1.0 2.6 –1.8 0.8 2.8 0.3
Average –1.3 2.2 2.1 –0.7 2.5 1.3 2.6 2.6 1.4
Source: International Monetary Fund, World Economic Outlook Database, October 2017.
Fig. 1.The structure of the FDI inflows in the WBC in million $ (2001–2016)
Source: Authors’ presentation based on the World Development Indicators database.
Acta Oeconomica70 (2020) 3, 381–405 385
significantly (except in Albania) and have shown a high sensitivity to the stability of investment environment. The slowing and falling of FDI inflows into this region were integral parts of the declining trend of FDI on the global level as reported by UNCTAD (2009). Namely, after a period of uninterrupted growth in FDI activity (2003–2007) the world economy has confronted with the globalfinancial crisis which has induced downturn in global FDI flows.‘Its negative impact on FDI has been twofold: because of reduced access to finance it has affected firms’
capacity to invest, while theirpropensityto invest has been affected by gloomy economic and market prospects and heightened risk perceptions’ (UNCTAD 2009: 5; Dabrowski – Mya- chenkova 2018).
The period after 2010 is characterised with the recovery of the FDI inflow dynamics in the WBC, although with different intensity, due to the immediate reaction of the authorities in the implementation of the packages of measures to mitigate the negative effects of the crisis, accelerate the reform process and reverse the negative trends of the real GDP growth rates. As a result, the total FDI inflows in the region have been increased to $39.4 billion, i.e. around 19.9%, in the period of 2009–2016 compared with the previous period (Fig. 1).
The structure of FDI inflows in the WBC (Fig. 1) shows that Serbia has the largest share in the total FDI inflows into the region in both sub-periods ($17.4 and $19.5 billion, respectively).
However, differences in population, the level of GDP and size of the countries are the main reasons why the net FDI inflows denominated in a cumulative value for a certain period cannot be taken as the sole criterion for assessing the performance of the WBC. Due to the unreliability of this indicator, other indicators are used as benchmarks of success in attracting FDI, such as the FDI per capita and the share of FDI inflows in GDP (Fig. 2).
Comparison of the WBC according the share of the FDI inflows in GDP has revealed the highest average share of 14.8% in the period of 2001–2008 and 15.8% in the period of 2009–2016 in Montenegro. Besides, the analysis of the share of FDI in GDP in the two separate periods, the
Fig. 2.The share of FDI inflows in the GDP in the WBC (2001–2016)
Source: Authors’presentation based on the World Development Indicators database.
period prior to the manifestation of the negative effects of the crisis on FDI inflows (2001–2008) and the post-crisis period (2009–2016) has revealed that: (1) in the post-crisis period the average share of FDI in GDP in Serbia has been slightly reduced (from 6.8 to 5.8%); (2) the largest decrease in the share after the crisis has been recorded in the case of Bosnia and Herzegovina (from 6.1 to 2.1%) and Macedonia (from 5.9 to 3.3%), while (3) the greatest increase in the average share of FDI in the GDP after the crisis has been recorded in the case of Albania (from 4.8 to 9%).
The usage of this indicator (FDI inflows as the percentage of GDP) should give the answer to the question of the extent to which FDI is important for the WBC, as well as, whether FDI has the potential to generate growth and development of these countries in the future.
It is widely agreed that the high FDI inflows in an economy exist if the share of FDI in GDP is higher than 10% (Fabris et al. 2008). As regards the WBC, this participation has varied considerably, with an average value of 7.3% in the period of 2001–2016. When we look at these values in the two sub-periods (before and after the crisis), the average share of FDI in GDP was between 7.7 and 7.2%, respectively. Such results directly confirm the hypothesis of an insuffi- cient quantum of FDI inflows in the WBC.
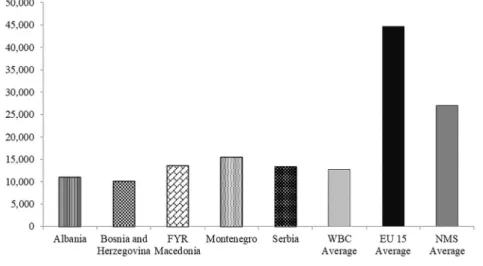
The WBC are far behind the EU countries, both in terms of total net FDI inflows and in terms of the share of FDI inflows in GDP. The most likely explanation for this situation is offered by Dunning’s investment development path approach (Dunning 1981). Namely, this approach‘relates a country’s net international direct investment position to its stage of devel- opment relative to that of the rest of the world’(Dunning–Narula 1993: 5). Measured by GDP per capita (in 2011 PPP $) (Fig. 3), the WBC lag behind the EU members, since the average GDP per capita in the WBC is 2.1 times smaller than that in the New EU Member States (NMS), and 3.5 times smaller than that in the EU15.
Fig. 3.GDP per capita (2011 PPP $) in the WBC in 2016
Source: Authors’presentation based on the International Monetary Fund, World Economic Outlook Database, October 2017.
Acta Oeconomica70 (2020) 3, 381–405 387
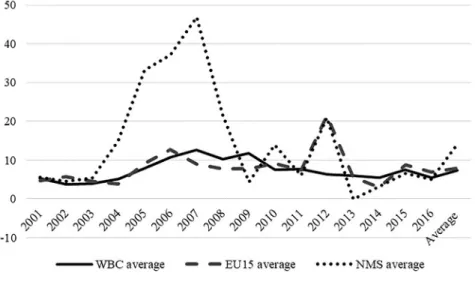
During the whole analysed period, the net FDI inflows were insufficient to drive growth and development of the WBC, since they accounted for only 7.2% of the total net FDI inflows to the NMS, and around 0.7% of total net inflows to the EU15 (Table 2). In relative terms, the WBC’s average share of FDI in GDP was 2 times smaller compared to the NMS average, while comparing with the EU15 average was less for 0.7 p.p. during the period of 2001–2016 (Fig. 4).
The higher share of FDI in GDP in the NMS, compared to the WBC, is explained by the supply- side factors. These factors include‘good economic growth prospects and the low level of physical capital, the improvement in the business climate, the highly educated labour force and low level of wages, and the low level of domestic credit offering’(Becker et al. 2010: 10).
Since development effects of the FDI on the host economy are largely determined by their sectoral structure, it is worth analysing the inward FDI flows dynamics to the WBC from a sectoral aspect. In this regard, following observations can be made:
(1) The structure of GDP formation in the WBC in the period of 2001–2016 resembles a modern market economy structure. This structure is characterised by the domination of
“other activities”i.e. service sector, followed by industry, while agriculture has the lowest share in the GDP formation. Further, the structure of gross value added (GVA) by eco- nomic activity indicates that the service sector, with the average share of value added in GDP of 61.2%, contributes substantially to the economic growth of the WBC in the pre- crisis period.2 Also, the tendency of a permanent increase in the share of service sector value added in GDP has been continued in the post-crisis period.
Additionally, in the period of 2001–2016, a declining trend in the average share of the agricultural value added in GDP was recorded for the region as a whole (from 13.6% in the pre-crisis period to 11.9% in the post-crisis period). At the same time, the average share of the industrial value added in GDP was slightly increased (from 25.2% in the pre-crisis period to 25.6% in the post-crisis period).
(2) The WBC‘have become largely service economies’(Estrin–Uvalic 2016: 8) characterised by the process of deindustrialization. Although the average share of the manufacturing value added in GDP for the region as a whole was slightly decreased in the post-crisis period compared to the pre-crisis period, it still accounts for a comparatively small percentage of the GDP compared to the service sector (Fig. 5). Such sectoral structure of GDP formation is not consistent to the achieved level of development, nor does it meet the development needs of the region.
(3) Structural changes, orientated toward strengthening the share of the service sector and declining the share of industry and agriculture, are the reflection of the prevailing trends in the sectoral distribution of the inward FDIflows in the WBC. According to the estimations ofEstrin–Uvalic (2014), the service sector participated for more than a half in inward FDI stock in the WBC by 2010. This share varied significantly by countries. The share of the service sector in inward FDI stock was about 50% of the inward FDI stock in Macedonia, nearly 60% in Albania and Bosnia and Herzegovina, and about 73% in Serbia (Estrin – Uvalic 2014: 293). Foreign investors have been largely orientated towards the following sectors: banking, telecommunications, real estate and wholesale and retail trade. Similar results were obtained byBotric (2010).
2Data table is available from the authors upon request.
Table 2. The net FDI inflows (million $)
Country 2001 2002 2003 2004 2005 2006 2007 2008
WBC 972.8 1,079.5 2,195.3 2,563.9 3,109.3 6,476.2 8,589.2 7,894.2
EU15 311,218.3 358,202.2 307,662.0 349,236.6 887,424.1 1,006,452.2 1,501,568.2 921,443.9
NMS 22,934.8 27,060.3 22,212.7 51,517.9 78,321.2 108,732.6 191,297.4 155,666.6
Country 2009 2010 2011 2012 2013 2014 2015 2016
WBC 6,218.2 4,286.9 7,515.1 3,544.4 4,475.7 4,251.4 4,703.8 4,436.2
EU15 409,986.1 534,826.9 805,696.6 641,338.4 595,980.5 329,406.3 548,097.5 651,783.4
NMS 35,361.3 43,283.7 45,411.5 91,888.9 9,599.1 54,216.9 32,558.6 33,480.2
Source: Authors’calculations based on the World Development Indicators database.
ActaOeconomica70(2020)3,381–405389
Also, such structural trends in FDI inflows are confirmed by the latest data from 2016 (Jirasavetakul–Rahman 2018) according to which the service sector retains its domination in the inward FDI stock in the WBC. Namely, the share of the service sector in the inward FDI stock is 63%, with the share of the financial sector –25%, information, communication and Fig. 4.The FDI net inflows (% of GDP)
Source: Authors’ presentation based on the World Development Indicators database.
Fig. 5.Manufacturing value added (% of GDP) in the WBC
Source: Authors’ presentation based on the World Development Indicators database.
business services–14%, wholesale and retail trade –12%, real estate –6%, and other–42%
(Jirasavetakul–Rahman 2018: 7).
As regards the manufacturing sector, its share in the inward FDI stock varied among countries from 35% in Bosnia and Herzegovina, 31% in Macedonia, about 20% in Serbia and 16% in Albania (Estrin–Uvalic 2014). The latest data shows that the share of the manufacturing sector in the inward FDI stock in the WBC is 22%, with the dominant orientation towards chemical and petroleum–27%, followed by food and beverage–24%, automotive–14%, metal –9%, textiles, printing and paper –9%, machinery and equipment – 3%, and others –15%
(Jirasavetakul–Rahman 2018: 7).
In recent years, there has been a trend towards increasing the share of manufacturing in total net FDI inflows, especially in the case of Macedonia and Serbia. According to the data available from the national statistics, the manufacturing industry in 2016 accounted for 57.3% of total net FDI inflows in Macedonia and 35.2% in Serbia. However, investment structure of these FDI inflows is orientated toward the lower-tech industries, and this is a major constraint for resolving the balance of payment problems and increasing the export competitiveness of these countries. This is in line with the study ofKinoshita (2011), who noted the increase in domestic demand and import in the countries with a higher share of inward FDIflows in the non-tradable sector. Also, such sectoral FDI orientation can act as a trigger for raising the trade deficit in these countries compared to those countries where the FDI inflows are primarily oriented toward the tradable sectors.
3. LITERATURE REVIEW
The effects of the implemented measures toward raising the quality of human capital are not only reflected in an increased attractiveness of the host country for FDI, but also in an increased capacity to fully absorb and maximize the positive development effects of FDI. In this context, Kapstein (2002: 16) asserts that‘in considering the factors that make a country attractive to FDI, human capital formation is a critical variable.’
However, the hypothesis that human capital plays a significant role in determining the in- ward FDI flows has not been confirmed in several earlier empirical studies. For example,Root– Ahmed (1979)performed an investigation on the determinants of manufacturing FDIflows in a sample of developing countries in the period from 1966 to 1970. They found that three variables from the group of social determinants used as a proxy of human capital (ratio of literacy and school enrolment, and availability of technical and professional workers) are not important determinants of FDI inflows. The research results of these authors can be explained by the variations in the relative importance of the determinants of inflows over time. Additionally, in the observed period, the FDI inflows were more determined by the traditional economic de- terminants, while the impact of non-economic determinants was insignificant.
Also,Schneider–Frey (1985)found the similar results, by developing a political-economic model which examined the economic and political determinants of inward FDIflows in the less developed countries. Their study showed that both groups of factors substantially influenced the FDI inflows. From the group of economic factors, the most important were a higher the country’s level of development and lower the balance of payments deficit. The most important political determinants were the amount of bilateral aid from the Western countries and
Acta Oeconomica70 (2020) 3, 381–405 391
multilateral aid. According to these authors, the qualification level of the workforce, inflation and labour costs, were the less significant factors affecting the FDI inflows.
The empirical literature on the relationship between human capital and FDI from the 1990s onward, is not unique in the conclusion that human capital does play an important role in attracting FDI inflows. Empirical evidence of the relationship between human capital and FDI inflows is quite different, depending on the host country or the group of countries observed (developed countries, developing countries and countries in transition). Also, there are numerous empirical studies that use the mixed samples of countries (see, e.g.Alsan et al. 2006;
Chousa et al. 2008) with the aim to identify the relationship between these two variables.
However, as the role of human capital, as a determining factor, differs according to the mentioned group of countries, these studies seem to prevent achieving consensus on the nature of the human capital-FDI relationship. Considering the subject of research our attention will be focused on the review of the relevant empirical literature in the developing and transition countries.
In the study by Lucas (1990), it was found that low level of human capital in the less developed countries is a key constraint to the larger FDI inflows. Lucas particularly indicates that the host country’s openness to FDI is a necessary, but insufficient precondition for a larger inflow. Therefore, he recommends the implementation of policies aimed at raising the level of human capital, since he believes that increased levels of human capital have the beneficial effects on the FDI inflows to the less developed countries.
Pfeffermann–Madarassy (1992)studied the FDI inflows in the developing countries in the period of 1970–1991 and concluded that the locational advantages of the host country play a key role in the choice of investment locations. These authors especially emphasized the importance of the relative cost of production in influencing FDI location decisions, while the direct labour costs were of secondary importance. Companies mainly direct their investment activities to- wards those countries that have highly educated and skilled workforce. This is in line with the motivation change over time and the evolution of the corporations’strategies and confirms the findings ofLucas (1990).
However,Hanson (1996)rejected the conclusions from Lucas’s study, since in determining the relationship between human capital and FDI he did not take into account the level of qualification of workers required by specific jobs. Therefore, Hanson provided a further evidence that the level of human capital in the host country really affects the geographic location of the multinational corporations’investment activities.
These findings are in line with the study conducted byLewis (2008). His results identified education as the most critical factor in attracting FDI in the less developing countries (LDC).
The illiteracy rate, as the proxy indicator for education, explains a significant part of the vari- ation in the FDI inflows. Additionally, Lewis pointed out that education should be more ori- ented towards technology disciplines due to the fact that the FDI inflows increase as the number of technicians increases in an LDC. Therefore, ‘it is important to incorporate technological disciplines into a government’s educational programs’(Lewis 2008: 106).
Similarly, empirical investigations byMody et al. (1999) and Blomstrom–Kokko (2003)also confirmed that highly qualified workforce, more than cheap labour force, is an important determinant of FDI in technology intensive sectors in the developing countries.
In order to investigate the impact of human capital on FDI inflows on a sample of 36 developing countries in the period of 1980–1994, Noorbakhsh et al. (2001) applied panel
estimation and confirmed the starting assumption that the level of human capital in host countries affects the geographical distribution of FDI. The results of their study indicate that all three variables used as proxies of human capital (secondary school enrolment ratio, the number of accumulated years of secondary education in the working age population and the number of secondary and tertiary education in the working age population) show high statistical signifi- cance in determining the FDI inflows and the increasing importance of human capital over time.
These authors especially emphasized the importance of implementing policies that support human capital development, since in this way the developing countries could attract a higher volume and more sophisticated FDI inflows. This is in line with the research ofSlaughter (2002) who noticed that the host country cannot absorb the full development benefits of FDI inflows without a certain critical level of absorptive capacity.
Miyamoto (2003)pointed out that the host country must offer labour force with at least basic education to attract any type of FDI. However, in order‘to attract high value-added MNEs, it is necessary to develop the tertiary education sector with close collaboration with the industry so as to formulate demand driven programmes’ (Miyamoto 2003: 42).
In an attempt to provide the answer to the question whether the FDI flows are attracted by the availability of human capital,Checchi et al. (2007)used gross enrolment rates of secondary and tertiary attainment as a proxy for human capital in the sample of 67 developing countries in the period of 1985–2000. Their results revealed that only the population with secondary school attainment is a significant determinant of the FDI inflows.
Dutta – Osei-Yeboah (2013) bring a new dimension in investigating the human capital impact on the FDI flows in the developing countries by linking the contribution of human capital in attracting FDI with quality of the country’s institutional framework. The main contribution of their study is reflected in policy recommendations towards improving the po- litical and civil right conditions, as a prerequisite for enhanced human capital–FDI nexus.
Regarding the human capital–FDI nexus in the transition economies, the empirical results are mixed and inconclusive.
Campos–Kinoshita (2003)examined the determinants of the investment location choice in 25 transition economies (the Central and Eastern European (CEE) countries, the Baltics, and the Commonwealth of Independent States (CIS)) in the period of 1990–1998 and identified natural resources and labour costs as most important determinants of the FDI location. However, these authors found that labour quality, measured by the enrolment rate in general secondary edu- cation, did not have a significant effect on the per capita FDI stock. In addition,Tøndel (2001) found that both general secondary and tertiary gross enrolment rates are insignificant de- terminants in explaining the FDI inflows in the observed transition countries.
Serbu (2005)examined the determinants of the FDI stock from EU15 and USA to three CEE countries (Hungary, Slovenia, and Romania) in the period of 1997–2000, and found a negative impact of the population with tertiary education on the FDI stock in the observed countries.
However, the country specific analysis revealed that tertiary education had a positive impact on the FDI stock in the case of Hungary, and negative impact in the case of Romania and Slovenia.
These differences are mainly driven by the sectoral orientation of FDI. Namely, FDIflows in Hungary are oriented to the high-value added sectors equipped with well-educated workforce, while FDIflows in Romania and Slovenia are mainly oriented to the low-skilled sectors, or low- tech manufacturing. Similarly, Majocchi – Strange (2007) in their study found that the
Acta Oeconomica70 (2020) 3, 381–405 393
proportion of the labour force with tertiary education had positive, but statistically insignificant impact on the location decisions in the examined CEE countries.
However, there are empirical studies that confirm the existence of a positive relationship between human capital and FDI flows in the transition countries. A study by Carstensen – Toubal (2004)showed that, along with low unit labour costs, the education level of the labour force has a strong positive impact on FDI inflows in the CEE countries. These authors emphasised the importance of skilled labour for the implementation of innovative technologies.
Skuflic–Botric (2006)applied the panel data estimation method to identify the main FDI determinants in the seven South Eastern European (SEE) countries in the period of 1996–2002.
They found that the FDI inflows in these countries are determined by the abundance of skilled labour, rather than low wages. Thesefindings can be explained by the prevailing orientation of inward FDI flows towards the service sector, which recorded above average wages and more skilled workforce than the manufacturing sector.
In a study on the spatial determinants of FDI in 25 transition countries in the period of 1993–2010,Shepotylo (2012)found that the share of population of age 15 withfinished tertiary education had a positive and significant effect on FDI.
Tast (2014)examined the FDI determinants in the SEE and CIS countries in the period from 2004 to 2011, and concluded that the factors related to workforce, the average monthly salary and the rate of people enrolled at university, were in negative correlation with the FDI inflows in both groups of countries. However, the region-specific analysis showed that, in the case of SEE, qualified workforce was positively correlated with the FDI inflows, while average monthly salary and FDI were in negative correlation. This is in line with the changing motives for undertaking FDI toward efficiency-seeking FDI. In the CIS countries the situation was quite opposite, since the resource seeking FDI was primarily attracted by investment opportunities in the countries abundant in natural resources and characterised by low wages. This is in line with the con- clusions reached byShepotylo (2012).
Jimborean–Kelber (2017)confirmed the significant impact of human capital, along with other internal and external determinants on the FDI in the CEE countries in the period of 1993–2014.
4. DATA AND METHODOLOGY
Data employed in this study are from the World Bank Development Indicators database, In- ternational Monetary Fund, World Economic Forum Global Competitiveness Report and the WB Government Indicators covering the period from 2008 to 2016 for five WBC. The main hypothesis investigates whether human capital affects FDI in the WBC. For the validation of this hypothesis the correlation and regression analysis were employed.
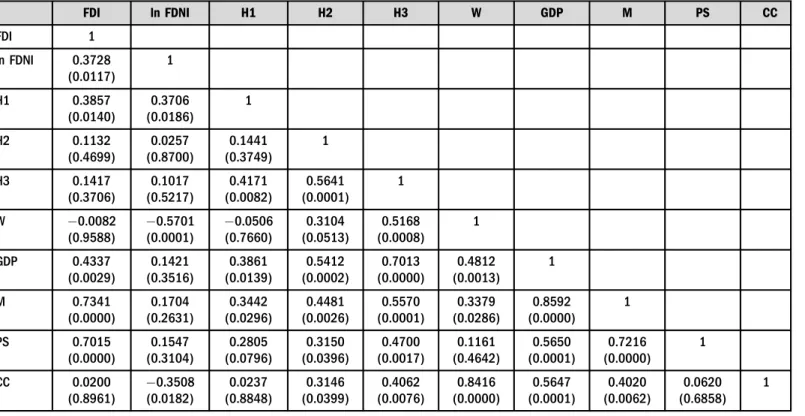
The correlation analysis is based on determining the correlation coefficientr. The value of this coefficient determines the strength of the relation between variables, and the absolute value of the correlation coefficient more than 0.5 implies high correlation, between 0.2 and 0.5 implies a moderate correlation and below 0.2 implies a low correlation between the analysed variables (Gupta 1999).
Since we have panel data before interpreting results of the regression analysis, we must decide which model best fits the data–The Pooled Regression Model (Pooled), the Fixed Effect Model (FEM) or the Random Effect Model (REM). Therefore, for deciding between the Pooled and FEM the F-test is used where the null hypothesis indicates that the Pooled model is more
appropriate than the FEM, meaning that there are no differences in regression constant across the countries (Jovicic – Dragutinovic Mitrovic 2011). For deciding between the Pooled and REM, the Breusch-Pagan LM test is used where the null hypothesis indicates the adequacy of the Pooled model, meaning that the random error does not contain significant individual effects. If the results of the F-test and Breusch-Pagan LM test reveal that both the FEM and REM models can be a good alternative, thefinal decision about the model is based on the Hausman test, where hull hypothesis indicates the adequacy of the REM.
In order to measure the impact of human capital development on FDI, we used the net FDI inflows as percentage of GDP (FDI) as the proxy measure of the FDI. The usage of this dependent variable has good empirical ground, especially in the studies byNoorbakhsh et al.
(2001) and Lewis (2008). Namely, the main reasons for choosing the relative measure of FDI (net FDI inflows as percentage of GDP), instead of absolute measure (net FDI inflows), are reflected in the following. First, the selection of the absolute measure can lead to the wrong conclusions regarding the role which FDI plays in the host country economy. The alternative relative measure is employed to control for any large-country effects (Noorbakhsh et al. 2001).
Second, it is well documented in practice that FDI represents the most important source of externalfinancing in the transition economies, and the factor that contributes to the achieve- ment of numerous development benefits. Therefore, the transition economies tend to increase the FDI inflows by implementing supporting policy measures.Lewis (2008)clearly indicates that the FDI is measured by their role in the host country economy. If a host country economy is considered as an unattractive FDI destination, then the role of FDI in the economy, and hence, the percentage share of FDI in GDP will be lower.
As regards to human capital, several explanatory variables are used. Those measures are mainly concentrated on the educational level of the population. Those are: enrolment rate of primary education (H1), the enrolment rate of secondary education (H2) and enrolment rate of tertiary education (H3). The basic assumption for using these variables as the indicators of human capital development is that the higher level of education is positively correlated with the possibility to attract foreign investments. Apart from these measures an indicator of labour cost is used, i.e. the average monthly wages (W). Additionally, the indicator of foreign direct net inflows (FDNI) is used as an explanatory variable, since evidence shows significant influence on the increase of FDI as percentage of GDP.
For estimating correlation between human capital development and FDI, apart from these variables, some macroeconomic indicators are included in the model as well. Those are GDP per capita in constant 2011 PPP $ (GDP), mobile phone users per 100 inhabitants (M), political stability (PS) and control of corruption (CC). Namely, GDP per capita in constant 2011 PPP $ represents an indicator of income level, i.e. a proxy of market size of the host country, suggesting that bigger market is more attractive for the FDI. This is in line with the research done by Chakrabarti (2001). Additionally, we observe the mobile phone users per 100 inhabitants as the proxy for the infrastructure development of a country. This measure is important since it demonstrates the development of telecommunication infrastructure of a country, and it is an important prerequisite for foreign investors when deciding where to channel their investments (Anyanwu 2011). Also, regarding the institutional quality in these transition countries, two governance indicators, such as political stability and control of corruption, are also used. It is expected that high political stability and control of corruption positively affect the FDI as demonstrated inAssuncao et al. (2011)(also seeKurul–Yalta 2017).
Acta Oeconomica70 (2020) 3, 381–405 395
5. EMPIRICAL ANALYSIS
The descriptive statistics of the data are explained in continuance.3The minimum value of the FDI is 0.54% of GDP in Macedonia in 2014, while the maximum value of FDI is 37.41% in Montenegro in 2009. The mean value of the FDI is 7.53% indicating insufficient level of FDI in these countries.
The minimum value of the FDI net inflows of $60.9 million is achieved in Macedonia in 2014, while the maximum level of the FDI net inflows of $4.93 billion is achieved in Serbia in 2011. The average value of the FDI net inflows in the analysed countries was about $1.05 billion.
The average enrolment rate of primary education (H1) is 92% in these countries, suggesting very high population covered by the basic education. As regards the enrolment rate of secondary education (H2), the average rate is 87%, and minimum rate of 45% is recorded in Bosnia and Herzegovina in 2008, while the maximum rate of 104% is recorded in Montenegro in 2012. The average value of the enrolment rate of tertiary education (H3) is 42% and the minimum value of 18% is recorded in Albania in 2012, while maximum rate of 58% is recorded in Serbia in 2016.
The average wage in the analysed countries isV413.69, and minimum wage ofV251 is paid in Albania in 2010, while the maximum wage ofV533 is paid in Macedonia in 2016.
The average value of GDP per capita in the analysed countries is $12 thousand (2011 PPP), and Albania has the minimum value of GDP per capita in 2008 (9 thousand), while Montenegro has the maximum value of the same in 2016 (16 thousand). The number of mobile phone subscribers per 100 inhabitants is 116, while the minimum is recorded in Albania in 2008 (59), and maximum in Montenegro in 2009 (209). The lowest political stability is achieved in Bosnia and Herzegovina in 2011 (–0.82), while the highest political stability is achieved in Montenegro in 2009 (0.82). The lowest control of corruption is achieved in Albania in 2012 (–0.73), while the highest control of corruption is achieved in Macedonia in 2014 (–0.02).
The results of correlation analysis are presented inTable 3. The correlation between foreign direct net inflows and FDI is moderate, positive and statistically significant. As regards human capital, the enrolment rate of primary education (H1) has positive, moderate, statistically sig- nificant correlation with FDI, while the relationship between the enrolment rate of secondary education (H2) and FDI, as well as, the enrolment rate of tertiary education (H3) and FDI is low and statistically insignificant. The connection between average monthly wages (W) and FDI is negative, low and statistically insignificant, while the low positive, statistically insignificant correlation exists between control of corruption and FDI. Moderate, positive and statistically significant relationship exists between GDP per capita and FDI. The highest positive, statistically significant correlation is determined between the number of mobile phone subscribers per 100 inhabitants and FDI, as well as between political stability and FDI. Strong positive correlation is determined between control of corruption and average monthly wages.
After determining the correlation between the variables, the test for choosing the appropriate regression model are performed. Based on the results it is determined that the Pooled regression is appropriate for model 1, while the FEM is appropriate for model 2.4
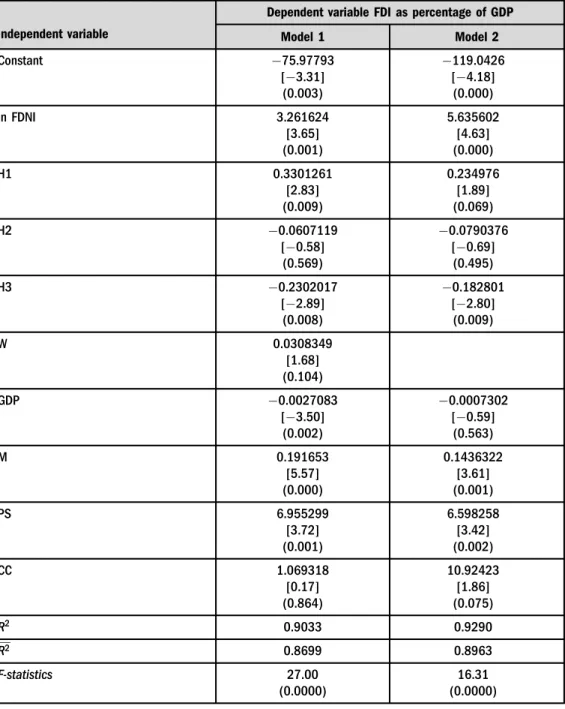
The results of the conducted regression analysis are presented inTable 4. Model 1 explains 90% change in FDI and this model is statistically significant. If the foreign direct net inflows
3Data table is available from the authors upon request.
4Data table is available from the authors upon request.
Table 3. Correlation analysis
FDI ln FDNI H1 H2 H3 W GDP M PS CC
FDI 1
ln FDNI 0.3728 (0.0117)
1
H1 0.3857
(0.0140)
0.3706 (0.0186)
1
H2 0.1132
(0.4699)
0.0257 (0.8700)
0.1441 (0.3749)
1
H3 0.1417
(0.3706)
0.1017 (0.5217)
0.4171 (0.0082)
0.5641 (0.0001)
1
W 0.0082
(0.9588)
0.5701 (0.0001)
0.0506 (0.7660)
0.3104 (0.0513)
0.5168 (0.0008)
1
GDP 0.4337
(0.0029)
0.1421 (0.3516)
0.3861 (0.0139)
0.5412 (0.0002)
0.7013 (0.0000)
0.4812 (0.0013)
1
M 0.7341
(0.0000)
0.1704 (0.2631)
0.3442 (0.0296)
0.4481 (0.0026)
0.5570 (0.0001)
0.3379 (0.0286)
0.8592 (0.0000)
1
PS 0.7015
(0.0000)
0.1547 (0.3104)
0.2805 (0.0796)
0.3150 (0.0396)
0.4700 (0.0017)
0.1161 (0.4642)
0.5650 (0.0001)
0.7216 (0.0000)
1
CC 0.0200
(0.8961)
0.3508 (0.0182)
0.0237 (0.8848)
0.3146 (0.0399)
0.4062 (0.0076)
0.8416 (0.0000)
0.5647 (0.0001)
0.4020 (0.0062)
0.0620 (0.6858)
1
Note: pvalues in bracets.
Source:Authors' calculations.
ActaOeconomica70(2020)3,381–405397
increase by 1%, the FDI as percentage of GDP increases by 3.26%, ceteris paribus. The enrol- ment rate of primary and tertiary education are statistically significant in explaining FDI, the increase of primary enrolment rate by 1% leads to the increase of FDI as percentage of GDP by 0.33%, while the increase in the tertiary enrolment rate by 1% leads to the decrease of FDI as percentage of GDP by 0.23% ceteris paribus. The secondary enrolment rate and average monthly wages are not statistically significant in explaining variations in FDI, while the increase of GDP per capita by 1$ leads to the decrease of FDI by 0.003%, ceteris paribus.
If the number of mobile phone subscribers per 100 inhabitants increases by 1, the FDI in- creases by 0.19%, ceteris paribus. Also, political stability is statistically significant in explaining FDI variation, the increase of political stability by 1 leads to the increase of FDI as percentage of GDP by 6.95%, ceteris paribus. Control of corruption is statistically insignificant, and this may be due to the high correlation with the indicator of average monthly wages, and hence the model 2 is estimated with this variable dropped out.
The model 2 explains 93% variation in FDI as percentage of GDP. Parameters of the estimated regression model show that secondary enrolment rate and GDP per capita are statistically insignif- icant for the FDI, while all other indicators are statistically significant. The regression coefficient for tertiary enrolment rate exhibits negative correlation, i.e. its increase leads to decrease of FDI. If control of corruption increases by 1, the FDI as percentage of GDP increases by 10.92%, ceteris paribus.
6. RESULTS AND DISCUSSION
The research results regarding human capital are mixed. The correlation analysis revealed a positive relationship between primary education and FDI as percentage of GDP, and this was confirmed by the regression analysis in both regression models. The increase of the primary enrolment rate leads to the increase of the FDI inflows. However, the secondary education is not statistically significant determinant of FDI, which has been confirmed by the results of both correlation and regression analysis. Additionally, the FDI relation with secondary enrolment rate is negative, suggesting an inverse relationship. This does not correspond to the expected results that higher level of education is positively related with the possibility to attract foreign investments.
However, these results are in line with the results obtained by Talpos – Enache (2010) who concluded that ‘at odds with the theoretical predictions, the percentage of persons with lower secondary education attainment is negatively correlated with the foreign directed investment in- flows.’ These results are due to the specific feature of the WBC different from the rest of the developing countries. In regards of tertiary education, the correlation analysis shows a statistically insignificant positive relationship with the FDI as percentage of GDP, while the regression results determine the negative statistically significant impact of tertiary education on the FDI inflows, thus confirming the strategic orientation of FDI towards the low-technology manufacturing. Namely, the FDI in the WBC are dominantly orientated towards the low-technology sectors that do not require skilled labour. This is also confirmed by the sectoral structure analysis which indicates that 33% of FDI in manufacturing is orientated towards the low-technology products (food and beverage, textiles, printing and paper) (Jirasavetakul–Rahman 2018: 7). Hence, a specific level of human capital quality attracts the similar level of FDI that matches the level of industry structure.
Also, despite the fact that low labour cost has been emphasised as the key comparative advantage of these countries, the empirical findings confirmed that average wages do not have a statistically
Table 4.Regression results
Independent variable
Dependent variable FDI as percentage of GDP
Model 1 Model 2
Constant 75.97793
[ 3.31]
(0.003)
119.0426 [ 4.18]
(0.000)
ln FDNI 3.261624
[3.65]
(0.001)
5.635602 [4.63]
(0.000)
H1 0.3301261
[2.83]
(0.009)
0.234976 [1.89]
(0.069)
H2 0.0607119
[ 0.58]
(0.569)
0.0790376 [ 0.69]
(0.495)
H3 0.2302017
[ 2.89]
(0.008)
0.182801 [ 2.80]
(0.009)
W 0.0308349
[1.68]
(0.104)
GDP 0.0027083
[ 3.50]
(0.002)
0.0007302 [ 0.59]
(0.563)
M 0.191653
[5.57]
(0.000)
0.1436322 [3.61]
(0.001)
PS 6.955299
[3.72]
(0.001)
6.598258 [3.42]
(0.002)
CC 1.069318
[0.17]
(0.864)
10.92423 [1.86]
(0.075)
R2 0.9033 0.9290
R2 0.8699 0.8963
F-statistics 27.00
(0.0000)
16.31 (0.0000)
Note:t statistics in [ ],pvalues in brackets.
Source:Authors’calculations.
Acta Oeconomica70 (2020) 3, 381–405 399
significant impact on the FDI as percentage of GDP in the WBC. This cannot be explained by a single variable, but with the fact that the global financial crisis of 2008 had negative consequences for these markets and the FDI inflows. Namely, due to the low level of the financial market development the foreign investors leave the border markets with the first sign of the crisis (Radjenovic–Rakic 2017), and these trends are reflected in the FDI inflows in these countries as well.
As regards to GDP per capita in constant 2011 PPP $, as an indicator of the market size of the host country, the results are mixed. The correlation analysis revealed moderate, positive, statis- tically significant relationship with the FDI as percentage of GDP, which is in line with the market orientated FDI inflows that seek to gain access to the new markets. However, the regression results have revealed that the higher level of GDP per capita in the WBC leads to the decrease of the FDI inflows, thus additionally confirming the FDI’s strategic orientation towards the low labour costs in manufacturing. The argument in favour of thisfinding is the high negative correlation between the average wages and foreign direct net inflows. This can be explained by the fact that FDI are not only market-seeking, but also resource-seeking in the case of the WBC.
The correlation analysis has revealed the moderate, positive and statistically significant relationship between the foreign direct net inflows and FDI as percentage of GDP, and these results have been confirmed by the regression analysis results where an increase of foreign direct net inflows leads to the increase of the FDI as percentage of GDP in both estimated models.
The results of the correlation and regression analysis have confirmed a strong positive relationship between the mobile phone users per 100 inhabitants, as an indicator of telecom- munication infrastructure development and FDI as percentage of GDP. The high level of telecommunication infrastructure development facilitates the activities of the multinational corporations, reduces the coordination costs between parent companies and their affiliates, and makes the WBC attractive for the resource-seeking FDI.
As regards, the institutional quality in these transition countries, the results confirmed that two governance indicators, political stability and control of corruption, have significant impact on determining the FDI inflows. According to the results of both regression models, the high political stability and control of corruption positively affect the FDI as percentage of GDP. This suggests that stable political environment without corruption activities can significantly increase the attractiveness of the WBC for the FDI inflows and points out the importance of improving institutional quality in these countries. Therefore, the host country policies should be directed towards improving the quality of institutional environment by strengthening the political sta- bility and mitigating the negative effects of corruption. This is of utmost importance for their future development and successful fulfilment of the second phase of the transition process.
7. CONCLUSION
We investigated the impact of human capital development on the FDI inflows in the WBC in the period of 2008–2016. With the aim to empirically verify the hypothesis, the sample of five WBC (Albania, Bosnia and Herzegovina, FYR Macedonia, Montenegro and Serbia), that share common characteristics, has been chosen. These countries represent relatively small economies with similar macroeconomic performances. They constitute the group of transition countries and are mutually interconnected through historic heritage, trade and other channels.
As indicators of human capital development three measures regarding the educational level of the population are employed, namely, the enrolment rates of primary, secondary and tertiary education. Apart from the measures of the education quality of human capital, the average monthly wages are used as an indicator of labour cost. Additionally, several location de- terminants are used as explanatory variables, such as: the indicator of foreign direct net inflows, GDP per capita in constant 2011 PPP $, mobile phone users per 100 inhabitants, political stability and control of corruption.
Based on the obtained empirical results the defined hypothesis is only partially proven – the primary enrolment rate has a positive impact on the FDI inflows. Opposite to the expected results, the tertiary enrolment rate has a negative impact on the FDI inflows in the WBC, while the secondary enrolment rate also has an inverse relationship with the FDI inflows, but it is statistically insignificant.
These results are pointing to the resource-seeking motives of the FDI inflows in the WBC.
Namely, the most FDI inflows in the analysed period were directed towards the low-technology industries that require low-skilled labour. The empirical results are the reflection of the real economic situation in the analysed transition countries: structural changes and the transition process have resulted in the substantial incompatibility between the supplied skills of employees and the required skills of employers. In order to attract high quality FDI inflows it is necessary to intensify the connection between economy and educational system, since educational pro- grammes directly improve the competitive position of a certain location and imply the long- term stability of the FDI. Namely, the educational structure should be adjusted to the needs of investors, both domestic and foreign, and the level of human capital development should correspond to the industry structure quality and they should grow simultaneously. Economic transformation towards areas with higher productivity, that supports the increase of creative potential, should be the key direction of the policy makers’activities in the WBC in the future.
At the same time, in order to reduce the gap between supply and demand of labour with specific qualifications, it is necessary to change and improve the qualification structure of the existing workforce and align them with the requirements of the new economic structure.
The current competitive position of the WBC regarding the FDI inflows is very low and mainly based on the low-skilled and low-cost labour, but such position cannot be part of the long-term, sustainable competitive strategies towards attracting high-value added FDI inflows.
Therefore, the role of educational system, the level and quality of education and workforce skills and qualifications need to be taken more seriously by the policy makers in these countries.
Considering that the development of human capital is obtained through the educational system, whose effects on the individual and economy are not reflected immediately but with a specific time lag, there is an urgent need that macroeconomic policy makers take into account the re- form measures of education system and improve the quality of educational system in order the WBC to become attractive destinations for the FDI in sectors with high-value added.
Due to the prevailing sectoral trends regarding FDI inflows in the WBC towards low- technology industries, the additional problem has arisen. Namely, another important issue is the process of brain drain that has taken place in these countries in the last decade and pose serious challenges to the macroeconomic managers. The brain drain of high-skilled labour puts addi- tional pressure to the macroeconomic policy makers to find the way to attract high-value added FDI and retain the high-skilled labour by implementing policy measures that offer high-skilled labour to the potential investors. Such efforts should contribute to the expectation of the so- phisticated investors who follows the complex global integration strategies.
Acta Oeconomica70 (2020) 3, 381–405 401
The empirical findings presented in this paper can be used as a good information base for the policy makers in the analysed countries in undertaking activities aimed at increasing their attractiveness for FDI inflows. Efforts should be made towards increasing the level of human capital development in order to attract high value added FDI in these countries.
The contribution of this paper is twofold. First, it aims to fill the gap in the existing literature on FDI, especially regarding the transition economies. Namely, the vast majority of FDI studies is focused on the developed and developing countries, but also at the advanced transition economies of the CEE, that have achieved the best results in the realisation of the reform processes. Second, unequal dynamics of investment inflows in the transition economies after the 1990s have initiated the debate on the most influential factors in attracting the FDI inflows towards these countries. In that regard, this research on the human capital impact on the FDI in the WBC significantly fills the gap in the area of FDI research dealing with the explanation of the location determinants.
The presented research has not examined the impact of FDI on economic growth and convergence hypothesis in the WBC. This could be a good starting point for future research in this area.5
Additionally, some considerations should be given to the chosen indicators of the human capital development, since this can be viewed as a main limitation of the paper. Namely, there is no unique position in the literature regarding individual indicators of human capital develop- ment, but the choice of indicators is rather based on the subjective judgement of the researchers and the availability of data. Therefore, it would be inspiring for further research to employ some other measures for the human capital development, such as the literacy rate or the educational attainment. Nevertheless, these limitations do not reduce the significance of the paper and obtained results, but rather point towards the potentials for future research and enhancement.
ACKNOWLEDGEMENTS
This work was supported by the Ministry of Education, Science and Technological Development of the Republic of Serbia, project No. 179066.
REFERENCES
Alsan, M.–Bloom, D. E.–Canning, D. (2006): The Effect of Population Health on Foreign Direct In- vestment Flows to Low- and Middle-Income Countries.World Development, 34(4): 613–630.
Anyanwu, J. C. (2011): Determinants of Foreign Direct Investment Inflows to Africa, 1980–2007. African Development Bank,Working Paper Series, No. 136.
Arandelovic, Z.–Petrovic-Randelovic, M. (2011): Uticaj drzave na priliv i efikasnost stranih direktnih investicija (The Impact of the State on Inflow and Efficiency of Foreign Direct Investment).Ekonomika preduzeca, 59(3–4): 143–156.http://scindeks-clanci.ceon.rs/data/pdf/0353-443X/2011/0353-443X1104143A.pdf.
5Several researchers (Jawaid–Raza 2012; Zekarias 2016; Cocris¸ et al. 2017) investigated the convergence effects in different country groups, but there are no such studies for the WBC.
Assuncao, S.–Forte, R.–Teixeira, A. A. C. (2011): Location Determinants of FDI: A Literature Review.
FEP Working Papers, No. 433, Faculdade de Economia Universidade do Porto.
Becker, T.–Daianu, D.–Darvas, Z.–Gligorov, V.–Landesmann, M.,–Petrovic, P.–Pisani-Ferry, J.– Rosati, D.–Sapir, A.–Weder Di Mauro, B. (2010): Whither Growth in Central and Eastern Europe?
Policy Lessons for an Integrated Europe.Bruegel Blueprint Series, No. 11, Bruegel.
Blomstrom, M.–Kokko, A. (1997): How Foreign Direct Investment Affects Host Countries.The World Bank Policy Research Working Paper, No. WPS1745.
Blomstrom, M.–Kokko, A. (2003): Human Capital and Inward FDI.Working Paper, No. 167, European Institute of Japanese Studies.
Borenzstein, E.–De Gregorio, J.–Lee, J. W. (1998): How Does Foreign Direct Investment Affect Economic Growth?Journal of International Economics, 45(1): 115–135.
Botric, V. (2010): Foreign Direct Investment in the Western Balkans: Privatization, Institutional Change, and Banking Sector Dominance.Economic Annals, 55(187): 7–30.
Brada, J. C.–Kutan, A. M.–Yigit, T. M. (2006): The Effects of Transition and Political Instability on Foreign Direct Investment Inflows: Central Europe and the Balkans.Economics of Transition, 14(4):
649–680.
Campos, N. F.–Kinoshita, Y. (2003): Why does FDI go where it goes? New Evidence from the Transition Economies.IMF Working Paper, No. WP/03/228.
Carstensen, K.–Toubal, F. (2004): Foreign Direct Investment in Central and Eastern European Countries:
A Dynamic Panel Analysis.Journal of Comparative Economics, 32(1): 3–22.
Chakrabarti, A. (2001): The Determinants of Foreign Direct Investment: Sensitivity Analyses of Cross- Country Regressions.Kyklos, 54(1): 98–114.
Checci, D.–De Simone, G.–Faini, R. (2007): Skilled Migration, FDI and Human Capital Investment.IZA Discussion Paper, No. 2795, Institute for the Study of Labor.
Chousa, J. P.–Vadlamannati, K. C.–Aristidis, B. P.–Tamazian, A. (2008): Determinants of Barriers to Quality of Direct Investments–Evidences from South & East Asian Economies. William Davidson Institute Working Papers Series, No. 910, William Davidson Institute at the University of Michigan.
Cocris¸, V.–Stoica, O.–S^arbu, R. -M. (2017): Foreign Direct Investments and the Real Convergence. An Approach for Romania and Bulgaria.Acta Universitatis Danubius13(4): 374–394.
Dabrowski, M.–Myachenkova, J. (2018): The Western Balkans: Weak Performance since the Crisis.Acta Oeconomica, 68(S): 85–120.
De la Fuente, A.–Ciccone, A. (2003):Human Capital in a Global and Knowledge-Based Economy—Final report. Luxembourg: Office for Official Publications of the European Communities.
Dunning, J. H. (1981): Explaining the International Direct Investment Position of Countries: Towards a Dynamic and Development Approach.Weltwirtschaftliches Archiv, 117(1): 30–64.
Dunning, J. H.–Narula, R. (1993):Transpacific Foreign Direct Investment and the Investment Development Path: The Record Assessed. Maastricht: MERIT.
Dutta, N.–Osei-Yeboah, K. (2013): A New Dimension to the relationship between Foreign Direct In- vestment and Human Capital: The Role of Political and Civil Rights.Journal of International Devel- opment, 25(2): 160–179.
Estrin, S.–Uvalic, M. (2014): FDI into Transition Economies: Are the Balkans Different. Economics of Transition, 22(2): 281–312.
Estrin, S.–Uvalic, M. (2016): Foreign Direct Investment in the Western Balkans: What Role has it Played during Transition?Comparative Economic Studies, 58(3): 455–483.
Acta Oeconomica70 (2020) 3, 381–405 403
Fabris, N.–Kilibarda, B.–Kalezic, Z.–Radunovic, M.–Rakocevic, M. (2008):Strane direktne investicije kao pokretac privrednog razvoja Crne Gore (Foreign Direct Investment as a Promoter of Economic Development of the Montenegro). Podgorica: Centralna banka Crne Gore.http://www.cb-cg.org/slike_i_
fajlovi/fajlovi/fajlovi_publikacije/radne_studije/sdi_kao_pokretac_privrednog_razvoja_cg.pdf.
Gupta, V. (1999):SPSS for beginners.VJBooks Inc.
Hanson , II, J. R. (1996): Human Capital and Direct Investment in Poor Countries.Explorations in Eco- nomic History, 33(1): 86–106.
Jawaid, S. T.–Raza, S. A. (2012): Foreign Direct Investment, Growth and Convergence Hypothesis: A Cross Country Analysis.MPRA Paper, No. 39000.
Jimborean, R.–Kelber, A. (2017): Foreign Direct Investment Drivers and Growth in Central and Eastern Europe in the Aftermath of the 2007 Global Financial Crisis.Comparative Economic Studies, 59(1): 23–
54.
Jirasavetakul, La-Bhus F.–Rahman, J. (2018): Foreign Direct Investment in New Member States of the EU and Western Balkans: Taking Stock and Assessing Prospects.IMF Working Paper, WP/18/187.
Jovicic, M.–Dragutinovic Mitrovic, R. (2011):Ekonometrijski metodi i modeli (Econometric methods and models). Beograd: Univerzitet u Beogradu, Ekonomski fakultet, Centar za izdavacku delatnost.
Kapstein, E. B. (2002): Virtuous Circles? Human Capital Formation, Economic Development, and the Multinational Enterprise.OECD Development Centre Working Paper, No. 191.
Keeley, B. (2007):Human Capital: How What You Know Shapes Your Life. Paris: OECD.
Kinoshita, Y. (2011). Sectoral Composition of Foreign Direct Investment and External Vulnerability in Eastern Europe.IMF Working Paper, No. WP/11/123.
Kurul, Z.–Yalta, A. Y. (2017): Relationship between Institutional Factors and FDI Flows in Developing Countries: New Evidence from Dynamic Panel Estimation.Economies, 5(2): 17.
Lall, S.–Narula, R. (2004). Foreign Direct Investment and Its Role in Economic Development: Do We Need a New Agenda?The European Journal of Development Research, 16(3): 447–464.
Lewis, J. (2008): Factors Influencing Foreign Direct Investment in Lesser Developed Countries.The Park Place Economist, 8(1): 97–107.
Lucas, R. E. (1990): Why Doesn’t Capital Flow from Rich to Poor Countries? The American Economic Review, 80(2): 92–96.
Majocchi, A.–Strange, R. (2007): The FDI Location Decision: Does Liberalization Matter?Transnational Corporations, 16(2): 1–40.
Miyamoto, K., (2003):Human Capital Formation and Foreign Direct Investment in Developing Countries (OECD Development Centre Working Paper, No. 211). OECD Publishing, Paris.
Mody, A.–Dasgupta, S.–Sinha, S. (1999): Japanese Multinationals in Asia: Drivers and Attractors.Oxford Development Studies, 27(2): 149–164.
Murgasova, Z.–Ilahi, N.–Miniane, J. –Scott, A.–Vladkova-Hollar, I.–IMF staff team (2015):The Western Balkans: 15 Years of Economic Transition. Washington, DC: International Monetary Fund.
Noorbakhsh, F. – Paloni, A. – Youssef, A. (2001): Human Capital and FDI Inflows to Developing Countries: New Empirical Evidence.World Development, 29(9): 1593–1610.
Pfeffermann, G. P.–Madarassy, A. (1992): Trends in Private Investment in Developing Countries 1993:
Statistics for 1970–91.IFC Discussion Paper, No. 16.
Radjenovic, T.–Rakic, B. (2017): Interdependence between Level of Financial System Development and Economic Growth in Serbia.Journal of Balkan and Near Eastern Studies, 19(06): 645–665.
Root, F. R.–Ahmed, A. A. (1979): Empirical Determinants of Manufacturing Direct Foreign Investment in Developing Countries.Economic Development and Cultural Change, 27(4): 751–767.
Schneider, F.– Frey, B. S. (1985): Economic and Political Determinants of Foreign Direct Investment.
World Development, 13(2): 161–175.
Serbu, S. G. (2005): FDI Flows towards CEECs: An Analysis on the Romania, Hungary and Slovenia’s Performances.https://ssrn.com/abstract5873474.
Shepotylo, O. (2012): Spatial Complementarity of FDI: The Example of Transition Countries. Post- Communist Economies, 24(3): 327–349.
Skuflic, L.–Botric, V. (2006): Foreign Direct Investment in Southeast European Countries: The Role of the Service Sector.Eastern European Economics, 44(5): 72–90.
Slaughter, M. J. (2002): Skill Upgrading in Developing Countries: Has Inward Foreign Direct Investment Played a Role?OECD Development Centre Working Paper, No. 192.
Talpos, I.–Enache, C. (2010): Searching for Human Capital Determinants of Foreign Direct Investment Inflows in the EU Member States.Annales Universitatis Apulensis Series Oeconomica, 12(1): 483–489.
Tast, J. (2014): FDI Determinants in the SEE and CIS Countries.European Journal of Economic Studies, 10(4): 268–278.
Tøndel, L. (2001): Foreign Direct Investment During Transition: Determinants and Patterns in Central and Eastern Europe and the Former Soviet Union. CMI Working Paper, No. 2001:9, Chr. Michelsen Institute.
UNCTAD. (2009): World Investment Report 2009: Transnational Corporations, Agricultural Production and Development. New York and Geneva: United Nations.
Xu, B. (2000): Multinational Enterprises, Technology Diffusion, and Host Country Productivity Growth.
Journal of Development Economics, 62(2): 477–493.
Zekarias, S. M. (2016): The Impact of Foreign Direct Investment (FDI) on Economic Growth in Eastern Africa: Evidence from Panel Data Analysis.Applied Economics and Finance, 3(1): 145–160.
Acta Oeconomica70 (2020) 3, 381–405 405