Introduction
Agriculture is a source of food and nutrition, and raw materials for industry. The sector accounts for 4 per cent of global gross domestic product (GDP) and in some develop- ing countries, contributes more than 25% of GDP (World Bank, 2020). Growth in the sector is between two and four times more effective in increasing wealth among the poor- est compared to other sectors. It is understood that in 2016, 65% of poor working adults made a living through agricul- ture (World Bank, 2020). Therefore, developing agriculture is one of the most potent tools to terminate extreme poverty, enhance shared prosperity and feed a projected 9.7 billion people by 2050 (World Bank, 2020). Global investment needs (domestic and foreign direct investment) are in the range of
$5 trillion to $7 trillion per year. Estimates for investment needs in developing countries alone range from $3.3 trillion to $4.5 trillion per year, mainly for basic infrastructure, and food security, among others (United Nations, 2014). Thus, investments including foreign direct investment are required to support the agricultural sector.
Therefore, governments globally have pursued mac- roeconomic policies to attract foreign direct investment (FDI). This is an investment made by an enterprise dwell- ing in one economy in order to attract lasting attention to an enterprise that is dwelling in another economy (Punthakey, 2020; UNCTAD, 2020; United Nations, 2015). “Lasting attention” in this regard suggests the presence of a long- term association between the direct investor and the direct investment enterprise that exerts a substantial influence on the leadership of the enterprise. This substantial influence is evidenced by domestic investors typically possessing 10%
or more of the voting power of a direct investment enter- prise (UNCTAD, 2020). Inward FDI is important for a range of reasons. Firstly, inward FDI enhances local investment by increasing domestic investment via connections in the production value-chain; this occurs when foreign firms buy locally made inputs or when foreign firms supply transitional inputs to local firms. Secondly, the FDI supplements the sup-
ply of funds for investment, a situation that fosters capital formation. Thirdly, inward FDI increases the host countries’
ability to export, initiating a rise in foreign exchange earn- ings. Finally, new job openings, and improved technology transfer are both related to FDI, thereby augmenting overall economic growth (de Mello Jr., 1997; Gallova, 2011; Kim and Seo, 2003; Mileva, 2008; Oualy, 2019; Romer, 1992).
These benefits notwithstanding, there is evidence that for- eign divestment (FD) does occur after FDI. Foreign divest- ment is a strategic decision of foreign firms in a host country that results in changes in their business portfolio, ultimately leading to a reduction in the level of assets. The divestment could be downsizing, relocation of operations or termina- tion (Benito, 2005; Belderbos and Zou, 2006; Boddewyn, 1983a; Chung et al., 2010; Nyuur and Debrah, 2014). Nyuur and Debrah (2014) explained downsizing as partial sale or disposal of physical and organisational assets and the reduc- tion of workforces of the organisation. Relocation entails the complete shutdown of facilities and moving these facilities and the foreign firms’ operations to another country (Belder- bos and Zou, 2006; McDermott, 2010; Nyuur and Debrah, 2014). Finally, termination involves the complete sale or disposal of physical and organisational assets, shutdown of facilities, and foreign firms’ operations in a country without relocating to another country (Nyuur and Debrah, 2014). The assets of the subsidiary are usually repatriated back to the headquarters (Nyuur and Debrah, 2014). Irrespective of the form, FD does reduce the stock of FDI and total domestic investment in the host country, leading to loss of jobs, tax revenue, and foreign exchange and depriving the host econ- omy of other benefits accruing from FDI. Taking all this into consideration, it is important to identify the causal factors of FD in agriculture and the direction of the effects.
Some studies have addressed the drivers of FDI into agriculture (Djokoto, 2012a; Farr, 2017; Husman and Kubik, 2019; Kassem and Awad, 2012; Lv et al., 2010; Rashid and Razak, 2017) but not FD. This paper uses multilateral FD data covering 1991 to 2017 for 50 countries. The paper focuses on agriculture globally. Identifying the factors that Justice G. DJOKOTO*
Drivers of agricultural foreign divestment
This paper has used multilateral foreign divestment (FD) data covering 1991 to 2017 for 50 countries, fitted to an optimised model based on microeconomic theory, to estimate the drivers of FD out of agriculture. Identifying the factors that determine FD would offer an opportunity for policymakers to know what kind of policies can discourage FD. Furthermore, knowledge of the directional effect would offer a way to use the policy variables to appropriately influence FD. Market size, exchange rate, political regime characteristics and transitions as well as the level of development drive FD out of agriculture globally. Trade openness and access to land resources have not been found to determine FD. Consequently, agricultural economy managers should work towards increasing the size of the agricultural economy; they should also liaise with their respective country’s Central Banks with a view to ensure exchange rate stability, and with their governments in order to promote better political regime characteristics and smoother political transitions.
Keywords: Foreign direct investment, foreign divestment, foreign exchange, agriculture, market size JEL classification: Q14
* Department of Agribusiness Management, Central Business School, Central University, P.O. Box DS 2310 Dansoman, Accra, Ghana, dgameli2002@gmail.com Received: 28 December 2020, Revised: 24 January 2021, Accepted: 2 February 2021.
determine FD would afford an opportunity for policymak- ers to understand what kind of policies can discourage FD.
Also, knowledge of the directional effect would offer a way for policymakers to use policy to appropriately influence FD. This is relevant as FD reduces not only FDI stock, but it also reduces the total investment stock, which is key to eco- nomic growth in the agricultural sector as well as the wider economy.
This paper is organised in five sections. A review of the literature follows next. Section three presents the model and data. The results of the analysis and discussion of same are captured in section four. Concluding remarks constitute the last section.
Literature review
Theoretical review
In the literature, theories of FD have been conceptualised as barriers to exit within the industrial-organisation perspec- tive (Boddewyn, 1983b; Porter, 1976; Wilson, 1980) and as a managerial dimension with a specific focus on what fac- tors cause FD (Boddewyn, 1983a,b ; Spanhel and Johnson, 1982; Spanhel and Boddewyn, 1983). Boddewyn (1983b, p346) succinctly notes “These managerial studies have gen- erally focussed on the deliberate and voluntary reduction or elimination of actively controlled foreign subsidiaries and branches through sale or liquidation, thereby excluding nationalizations, expropriations, spin-offs, ‘fade-out’ and
‘harvest’ cases as well as passive subsidiaries”. Viewing FD theory as the reverse of Dunning’s eclectic theory, Bod- dewyn (1983b) notes three preconditions for FD. The firm:
1. ceases to possess net competitive advantages over firms of other nationalities.
2. no longer finds it beneficial to use them itself rather than sell or rent them to foreign firms - that is, the firm no longer considers it profitable to ‘internalise’ these advantages.
3. no longer finds it profitable to utilise its internalised net competitive advantage outside its home country – that is, it is now more advantageous to serve foreign markets by home production, and/or to abandon for- eign markets altogether.
The internationalisation theory of Hymer (1976) notes that firms often prefer FDI to licence as a strategy for enter- ing a foreign market. The oligopolistic industries theory of Knickerbocker (1973) posits that firms follow others in entering foreign markets. Firms undertake FDI at stages in the life cycle of the product they pioneered (Vernon, 1966).
Foreign markets are accessed when local demand in those countries grows sufficiently to support local production.
These theories of FDI can work in the reverse for FD.
Empirical review
As studies on the drivers of FD from agriculture are non-existent, the empirical review addresses the drivers of
FDI. The existing literature focused on an individual country (Ghana - Djokoto, 2012a; Egypt - Kassem and Awad, 2012;
China - Lv et al., 2010) and country groups (Africa - Hus- mann and Kubik, 2019; Latin America - Farr, 2017; Organi- sation of Islamic Countries (OIC) - Rashid and Razak, 2017).
The size of the agricultural economy (market size) influences FDI into agriculture (Farr, 2017; Husmann and Kubik, 2019;
Kassem and Awad, 2012; Lv et al., 2010; Rashid and Razak, 2017). However, while Kassem and Awad (2012) found that the exchange rate determined FDI, Djokoto (2012a) and Rashid and Razak (2017) found a neutral effect. Openness to trade determines FDI overall (Farr, 2017) although Djokoto (2012a) found a positive but statistically insignificant effect of trade openness on FDI into agriculture. Some have con- cluded that access to land resources significantly determines FDI into agriculture (Farr, 2017; Husmann and Kubik, 2019;
Rashid and Razak, 2017). However, Djokoto (2012a) found the contrary. The effect of inflationary pressures on FDI into agriculture has been mixed. Whilst Djokoto (2012a) found a positive effect, Kassem and Awad (2012) reported a nega- tive effect. Lastly, Djokoto (2012a) found that political open- ness promoted FDI into agriculture. Combining theory and empirical evidence, market size, exchange rate, inflation, land, and political openness can be said to determine FDI.
Modelling and Data
Owing to the non-existent literature on the drivers of FD in agriculture, the starting point of the model building is the drivers of FDI derived from theoretical and optimisation pro- cedures. This is further justified as the work of Boddewyn (1979a,b, 1983a,b, 1985) have shown that the theories of foreign divestment are the reverse of the theories of FDI.
For example, consider a multinational enterprise (MNE) faced with a cost function for both domestic and foreign pro- duction plants. The MNE would decide whether to expand production domestically and export to a foreign market or instead to invest directly in a foreign market (Hymer, 1976;
Vernon, 1966). The MNE would thus seek to minimise the cost of production for the two plants. Let C denote the total cost, ωd and ωf the unit costs in domestic plants and foreign plants, respectively, and Qd and Qf to be the respective quan- tities produced in each plant. Then,
(1) Unit costs in both plants are therefore a function of the quantity produced. The production of the two plants should not exceed given by:
(2) In line with production theory, cost should be minimised, hence the setup of the Lagrangian.
(3)
Taking first-order partial derivative of 3 with respect to Qd, Qf and λ and equating them to zero, then:
(4)
(5) (6) To attain the objective decision of locating the foreign plant,
(7)
where:
and are assumed to be
positive.
From the above, output in the foreign firm is positively related to the total demand and differences in unit costs.
Consequently, the foreign plant increases its production pro- vided ωd > ωf. On the other hand, the firm will expand pro- duction in its domestic plant, resulting in a reduction in the output produced in its foreign plant provided ωd < ωf. Thus far, the desired output is established. The next thing to do is decide on the levels of inputs to be used for the production in the foreign firm. For the sake of brevity, two inputs are assumed: labour, L and capital, K. Let w and k be wage rate and cost of capital, respectively. Then, the cost of producing the Qf denoted as Cf is:
(8) As the subsequent derivation relates to the foreign firm (production), the subscript, f is dropped. Assuming a Cobb- Douglas production function:
(9) the Lagrangian is set up as in equation 10. Unlike in equation 4, the constraint here is the production function.
(10)
Taking first-order partial derivatives with respect to w, k and λ, and equating to zero:
(11) (12) (13) Solving for K and substituting Q from equation (7):
(14)
Therefore, K is positively related to total demand (sum of domestic and foreign demand) and negatively related to the unit costs of foreign costs relative to domestic costs. As the focus is on the foreign firm of the MNE, the capital is largely or entirely, FDI. Thus, K can be replaced with FDI in equation (14). Based on the theories of FDI (Dunning, 1977, 1988, 1993, 2001; Hymer, 1976; Knickerbocker, 1973; Vernon, 1966) and the empirical evidence for agricul- ture (Djokoto, 2012a; Farr, 2017; Husman and Kubik, 2019;
Kassem and Awad, 2012; Lv, et al., 2010; Rashid and Razak, 2017) and the total economy (Harding and Javorcik, 2007;
Morisset, 2003; Barthel et al., 2008; Djokoto, 2012b; Dah and Khadijah, 2010; Nyarko et al., 2011), the function for the drivers of FDI is:
(15)
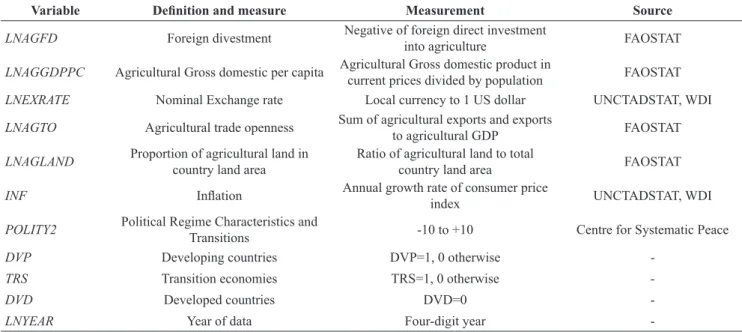
The variables, their definitions and data source are reported in Table 1.
As Boddewyn (1979a,b, 1983a,b, 1985) has amply dem- onstrated that the theories that explain FDI are the reverse of those for FD, equation (15) is underpinned by the theories of FD. As will soon be shown, the data employed in this study has two important distinguishing characteristics; it is made up of countries at different levels of development, and there are repeated observations for some countries but different years, yet the structure of the data is not such as to qualify as a panel. As such, it is necessary to control for these. Thus, additional variables are introduced into equation (15) and defined in Table 1. According to UNCTAD (2020), negative FDI is FD. As the focus of the study is FD, the AGFDI can be replaced with AGFD. Consequently, equation 15 can be augmented as:
(16)
Table 1: Variable definitions, measures, and sources of data.
Variable Definition and measure Measurement Source
LNAGFD Foreign divestment Negative of foreign direct investment
into agriculture FAOSTAT
LNAGGDPPC Agricultural Gross domestic per capita Agricultural Gross domestic product in current prices divided by population FAOSTAT LNEXRATE Nominal Exchange rate Local currency to 1 US dollar UNCTADSTAT, WDI LNAGTO Agricultural trade openness Sum of agricultural exports and exports
to agricultural GDP FAOSTAT
LNAGLAND Proportion of agricultural land in
country land area Ratio of agricultural land to total
country land area FAOSTAT
INF Inflation Annual growth rate of consumer price
index UNCTADSTAT, WDI
POLITY2 Political Regime Characteristics and
Transitions -10 to +10 Centre for Systematic Peace
DVP Developing countries DVP=1, 0 otherwise -
TRS Transition economies TRS=1, 0 otherwise -
DVD Developed countries DVD=0 -
LNYEAR Year of data Four-digit year -
Notes: 1. The prefix LN denotes natural logarithm. 2. FAOSTAT- Food and Agricultural Organisation statistics centre: http://www.fao.org/faostat/en/. 3. UNCTADSTAT – United Nations Conference of Trade and Development Data centre: https://unctadstat.unctad.org/EN/. 4. WDI – World Development Indicators of the World Bank: https://databank.
worldbank.org/home.aspx. 5. Centre for Systematic Peace: https://www.systemicpeace.org/inscrdata.html Source: own composition
Table 2: Descriptive statistics.
Variable Mean Standard deviation Minimum Maximum
Explained variable(s)
FD 0.0071 0.0259 4.50e-06 0.3000
LNFD -6.631 1.8617 -12.3113 -1.2038
Explanatory variables Theoretical variables
GDPPC 665.2623 1,261.6060 15.2965 10,252.8200
LNGDPPC 6.0505 0.8186 2.7276 9.2353
EXRATE 339.9892 1,233.2330 0.0568 10,389.9400
LNEXRATE 1.9037 2.6770 -2.8678 9.2486
AGTO 7.6797 26.1065 0.0317 247.5623
LNAGTO 1.0715 1.2773 -3.4510 5.5117
AGLAND 0.4047 0.1729 0.0109 0.8491
LNAGLAND -1.0450 0.6357 -4.5215 -0.1636
Economic and political controls
INF 4.6757 8.1377 -0.9222 74.3000
POLITY2 8.4220 3.2638 -6 10
Data controls
DVP 0.2775 0.4490 0 1
TRS 0.0405 0.1976 0 1
DVD 0.6821 0.4670 0 1
YEAR 2004.751 6.4350 1991 2017
LNYEAR 7.6033 0.0032 7.5964 7.6094
Note: The prefix LN denotes natural logarithm.
Source: own composition
The subsequent model specification is:
(17)
Where the prefix LN stands for natural logarithm. The data used in this study is made up of 50 countries across all
three levels of development according to the United Nations (2020) (Appendix). As the data is not strictly a panel, equa- tion (16) is estimated by Ordinary Least Squares (OLS) having controlled for the repeated observations using the year of observation. Violations of the OLS namely, hetero- scedasticity, multicollinearity and misspecifications were tested.
Results and discussion
Background of data
The data ranged from 1991 to 2017 (YEAR) and repre- sented observations of countries for which FDI is negative (Table 2). This is the singular driver of the number of coun- tries and years of the data. The FD ranged from 4.50e-06 (Republic of Korea in 2000) to 30% (Belgium in 2005). The maximum is appreciable; indeed, the penultimate highest is 12% (Singapore in 2004), less than half of the maximum.
The mean of 0.71% coincides with the value for Lithuania in 2015. The least AGGPPC of $15.29/person was for Sin- gapore in 2004 and the maximum of $10,252/person relates to Panama in 2009. Thus, distributing agricultural produc- tion by the national population, Singapore gets the least whilst Panama gets the highest. Regarding local currency relative to the US dollar, it was least expensive to acquire
$1 using Venezuela’s Bolívar in 1991 (Bs 0.0568) and most expensive to acquire $1 in Indonesian Rupiah (Rp 10,390) in
2009. INF and POLITY2 both recorded negative values. The latter shows a low level of democracy and political toler- ance (Morocco - 2005, 2008 and Kazakhstan - 2004, 2007).
The negative values in the two series prevented their natural logarithm transformation. Regarding the other data controls, most of the countries that experienced FD in agriculture over the study period are developed countries, 68% (28 countries) and the least is economies in transition, 4% (3 countries).
Results from the estimations
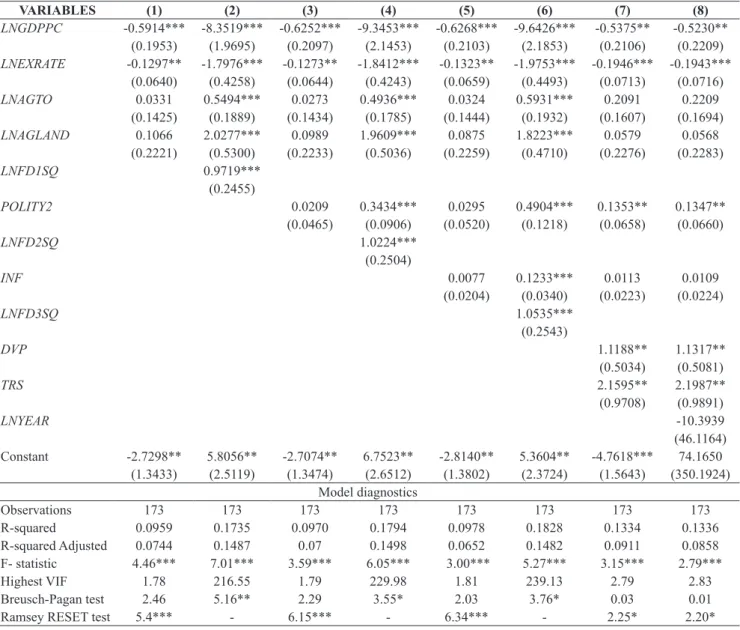
The estimations, model 1 to 8, are reported in Table 3.
Model 1 is the outcome of estimation with the theoretical variables only. The model appeared to be incorrectly speci- fied with the statistical significance of the Ramsey RESET test (Ramsey, 1969) measured at 1%. Upon correcting for the misspecification by including a square term of the prediction of LNFD (LNFD1SQ), the adjusted R squared doubled but the highest VIF exceeded the threshold of 10, a result that is indicative of multicollinearity. Furthermore, the variance of model 2 became heteroscedastic (Breusch and Pagan 1979;
Table 3: Estimation results.
VARIABLES (1) (2) (3) (4) (5) (6) (7) (8)
LNGDPPC -0.5914*** -8.3519*** -0.6252*** -9.3453*** -0.6268*** -9.6426*** -0.5375** -0.5230**
(0.1953) (1.9695) (0.2097) (2.1453) (0.2103) (2.1853) (0.2106) (0.2209) LNEXRATE -0.1297** -1.7976*** -0.1273** -1.8412*** -0.1323** -1.9753*** -0.1946*** -0.1943***
(0.0640) (0.4258) (0.0644) (0.4243) (0.0659) (0.4493) (0.0713) (0.0716) LNAGTO 0.0331 0.5494*** 0.0273 0.4936*** 0.0324 0.5931*** 0.2091 0.2209
(0.1425) (0.1889) (0.1434) (0.1785) (0.1444) (0.1932) (0.1607) (0.1694) LNAGLAND 0.1066 2.0277*** 0.0989 1.9609*** 0.0875 1.8223*** 0.0579 0.0568
(0.2221) (0.5300) (0.2233) (0.5036) (0.2259) (0.4710) (0.2276) (0.2283)
LNFD1SQ 0.9719***
(0.2455)
POLITY2 0.0209 0.3434*** 0.0295 0.4904*** 0.1353** 0.1347**
(0.0465) (0.0906) (0.0520) (0.1218) (0.0658) (0.0660)
LNFD2SQ 1.0224***
(0.2504)
INF 0.0077 0.1233*** 0.0113 0.0109
(0.0204) (0.0340) (0.0223) (0.0224)
LNFD3SQ 1.0535***
(0.2543)
DVP 1.1188** 1.1317**
(0.5034) (0.5081)
TRS 2.1595** 2.1987**
(0.9708) (0.9891)
LNYEAR -10.3939
(46.1164) Constant -2.7298** 5.8056** -2.7074** 6.7523** -2.8140** 5.3604** -4.7618*** 74.1650
(1.3433) (2.5119) (1.3474) (2.6512) (1.3802) (2.3724) (1.5643) (350.1924) Model diagnostics
Observations 173 173 173 173 173 173 173 173
R-squared 0.0959 0.1735 0.0970 0.1794 0.0978 0.1828 0.1334 0.1336
R-squared Adjusted 0.0744 0.1487 0.07 0.1498 0.0652 0.1482 0.0911 0.0858
F- statistic 4.46*** 7.01*** 3.59*** 6.05*** 3.00*** 5.27*** 3.15*** 2.79***
Highest VIF 1.78 216.55 1.79 229.98 1.81 239.13 2.79 2.83
Breusch-Pagan test 2.46 5.16** 2.29 3.55* 2.03 3.76* 0.03 0.01
Ramsey RESET test 5.4*** - 6.15*** - 6.34*** - 2.25* 2.20*
Notes: 1. Dependent variable is LNFD. 2. Standard errors in parentheses. 3. *** is p<0.01, ** is p<0.05, and * is p<0.10.
Source: own composition
ability of resources. Thus, the decrease in market size would discourage FDI and invariably encourage FD.
The negative and statistically significant coefficient of LNEXRATE means that depreciation of the country local cur- rency by 1% would induce 0.19% decrease in FD. Owing to concessions for imports for MNEs, they tend to import mate- rials including raw materials. Depreciation of the country’s currency would make the imports more expensive. Also, this could lead to an increase in other imported goods, leading to an increased cost of living. This could drive up wages.
Generally, the increased cost of production could diminish profits and encourage FD out of agriculture. This finding is consistent with Kassem and Awad (2012) with regard to the significance of the coefficient. Whilst the exchange rate promoted FDI, the price of the currency discouraged FD.
Djokoto (2012a) and Rashid and Razak (2017) however, found no effect of exchange rate on FDI.
Openness to trade is positive but statistically insignifi- cant. This is consistent with the findings of Djokoto (2012b) but at variance with the conclusions of Farr (2017) and Kas- sem and Awad (2012). As the exchange rate depreciates, although exports become cheaper, imports become more expensive. MNEs in agriculture that depend on imported raw materials would face high costs. They would thus, fail to reap the benefits of cheaper exports. The interaction of the exports and imports would, therefore, have no discernible effect on FD.
In theory, location resources should determine FDI and for that matter FD. The findings of this study, however, show that access to land resources does not have a discern- ible effect of FD. Although consistent with Djokoto (2012a), the finding disagrees with Farr (2017), Husmann and Kubik, (2019) and Rashid and Razak (2017). The measure of land used in this study is agricultural land use as a proportion of total country land. Not only does this reflect agricultural land use in the country, but it also captures land grab influences on agriculture (Byerlee et al., 2015; Deming, 2012; Escresa, 2014; Fraser, 2019). Divestments that involve transfers of capital leaving control of land resources or transfer of land to domestic or other MNEs could account for the statistically insignificant effect.
Increase in POLITY2 variable by 1% would induce 0.1347% rise in FD. Although this is not an encouraging out- come, it is to be expected. Improvements in political regime characteristics and transitions promote FDI into agriculture (Djokoto, 2012a). This is often associated with investment laws that guarantee the security of investment. Just as these attract FDI into the sector, the same window offers an oppor- tunity to MNE’s affiliates in host countries to divest if or when it becomes necessary. The consolation, however, is that the agricultural sector of the host economy would have attracted FDI and reaped the benefits therefrom before the FD. Moreover, between the period of 1991 to 2017, the FAOSTAT reported 984 instances of FDI (positive) whilst the occurrences of FD number 173 (less than 20% of the FDI). Further, the instances of FD did not mean there was no FDI, rather the FD was more than the FDI.
The positive sign of the coefficient of INF suggests as inflation worsens FD increases. This is not surprising as Kas- sem and Awad (2012) reported worsening inflation drove Cook and Weisberg, 1983). In model 3, with the inclusion
of POLITY2, there was misspecification and the subsequent correction created a new multicollinearity problem (VIF = 229.98) (Model 4) (Cuthbert and Wood, 1980). On adding INF, model 5 is also incorrectly specified and correcting for this also led to above 10 threshold VIF of 239.13. It is instructive to note that the corrections for the misspecifica- tion always created a multicollinearity problem. The mis- specification correction variable then gives rise to another problem whose most appropriate resolution would require dropping the correction variable.
To get out of the dilemma, the data controls were added.
First, the levels of development (Model 7). Second, is the year control variable (LNYEAR) as in model 8. Whilst producing statistically significant F statistics, the VIFs are below 3.00 and no evidence of heteroscedasticity. Based on a cut-off of 5%, models 7 and 8 are not incorrectly specified.
Thus, they do not violate the assumptions of the OLS hence appropriate for discussion. The difference between model 7 and 8 is the introduction of LNYEAR that drove the statistical significance of the constant (model 7) to statistical insignifi- cance (model 8).
Using model 8, the statistical significance and sign of the coefficients of LNGDPPC and LNEXTRATE are consistent across all eight models. The magnitude and sign of the coef- ficients of LNAGTO and LAGLAND are consistent across the models not corrected for misspecification. The sign and statistical significance of the magnitude of POLITY 2 are consistent for four out of six models. That for inflation is consistent for three out of the four models containing INF.
The sign and statistical significance of the magnitude of the development controls are also consistent in model 7 and 8.
It is worth noting that the F statistics are statistically sig- nificant. These imply that the explanatory variables jointly explain the variability in the explained variable. However, the adjusted R squared values of model 7 and 8 are small, about 10%. As the R-squared represents the scatter around the regression line, the low R squared shows a wide vari- ation around the trend line. This does not, however, vitiate the relationship between the explanatory variables and the explained variable which is the focus of the paper.
Discussion of drivers of foreign divestment
The statistically significant coefficient of -0.5230 for LNGDPPC suggests a 1% decrease in LNGDPPC would increase FD by 0.5230%. It would be observed that the mag- nitude of 0.5230 is the largest among the coefficients of the theoretical, macroeconomic and political controls. Thus, not only is market size a driver of FD, but it is also the single most important theoretical driver of FD. This finding is syn- onymous with those for FDI. Just as market size increased with FDI (Djokoto, 2012a; Farr, 2017; Husmann and Kubik, 2019; Kassem and Awad, 2012; Lv et al., 2010; Rashid and Razak, 2017), market size increased with the decline in FD. Increase in market size affords the sector’s economic agents to purchase the products of the sector. This is further enhanced by households from other sectors as agriculture remains the most important provider of food. Increase in the size of the sector is also associated with the increased avail-
down FDI. Djokoto (2012a) however, reported a positive effect of inflation on FDI in Ghana and explained that the generally high inflationary environment was accommodated by FDI. Moreover, other drivers are known to have stronger effects on FDI than inflation. In the case of the current study, the magnitude of the coefficient of the INF is statistically insignificant.
The development controls show statistically significant coefficients. The magnitude of TRS is more elastic than that of DVP. Whilst these suggest TRS experienced more FD than DVP, the sum of the outcome is that developing coun- tries and transition economies experienced FD more than developed countries. This seemed to depart from the uni- variate position that most developing countries experienced FD because other variables have now been accounted for.
Indeed, developed countries tended to be more stable politi- cally than developing and transition economies. Moreover, although agriculture becomes less and less important as its shares to total GDP decline, the size of the sector continues to be large. A combination of the transition process and some instability within the three transition countries could have accounted for the higher elasticity.
Although not statistically significant, the coefficient of LNYEAR is negative. This presents a situation of decline in FD over time, which is encouraging. This is to be expected as the size of the agricultural economies of countries tends to increase over time.
Concluding remarks
This paper used multilateral FD data covering 1991 to 2017 for 50 countries to estimate the drivers of agricultural FD. Identifying the factors that determine FD would offer an opportunity for policymakers to know the policies that can discourage FD. Also, knowledge of its directional effect would suggest ways to use policy to appropriately influ- ence FD. It has been found that market size, exchange rate, political regime characteristics and transitions as well as a country’s level of development drive FD out of agriculture globally. However, a country’s openness to trade and access to land resources have not been found to determine FD.
As market size was measured as GDP per person, agri- cultural economic managers acting together with Central Government should formulate policies to control their coun- try’s population as increased technology adoption is lead- ing to increased unemployment in the agricultural sector.
A declining population would increase the size of GDP per capita ceteris paribus. Agricultural GDP should be increased through increasing domestic and foreign investment. The use of such policy tools should increase the size of the economy and decrease FD from the sector.
There is also a need to manage foreign currency exchange rates in order to reduce the cost of acquiring the US dollar within bounds that would not unduly discourage essential imports whilst simultaneously facilitating exports from the sector. Policymakers need to balance consideration of the effects of exchange rate movements on the agricultural sec- tor with those of the wider economy as the exchange rate affects all other sectors.
Notwithstanding the positive effects political regime characteristics and political transitions have been shown to have in relation to FD, political regime characteristics should be enhanced as the benefits to the sector in terms of FDI out- weigh the effects of FD. As developed countries have tended to experience less FD than developing and transition econo- mies, these less advanced countries must redouble their efforts as they push on towards becoming developed coun- tries themselves. This would require, among other things, increasing efficiency in the agricultural sector through appropriate and improved technology, as well as measures such as expanding the non-agricultural sector to absorb the resultant excess labour. Generally, increasing the share of the non-agricultural sector feeds into the structural transforma- tion narrative of economic development. Although the model discussed fits the data despite the low adjusted R squared, future studies could usefully employ machine learning; this could improve the model fit.
References
Barthel, F., Busse, M. and Osei, R. (2008): The characteristics and drivers of FDI in Ghana. Hamburg Institute of International Economics (HWWI), Germany.
Belderbos, R. and Zou, J. (2006): Foreign investment, divestment and relocation by Japanese electronics firms in East Asia. Asian Economic Journal, 20 (1), 1–27. https://doi.org/10.1111/j.1467- 8381.2006.00222.x
Benito, G.R. (2005): Divestment and international business stra- tegy. Journal of Economic Geography, 5 (2), 235–251. https://
doi.org/10.1093/jnlecg/lbh041
Boddewyn, J.J. (1979a): Foreign divestment: Magnitude and fac- tors. Journal of International Business Studies, 10 (1), 21–27.
https://doi.org/10.1057/palgrave.jibs.8490786
Boddewyn, J.J. (1979b): Divestment: Local vs. foreign, and U.S.
vs. European approaches. Management International Review, 19 (1), 21–27.
Boddewyn, J.J. (1983a): Foreign and domestic divestment and investment decisions: like or unlike?. Journal of International Business Studies, 14 (3), 23–35. https://doi.org/10.1057/palg- rave.jibs.8490525
Boddewyn, J.J. (1983b): Foreign direct divestment theory: Is it the reverse of FDI theory? Weltwirtschaftliches Archiv, 119 (2), 345–355. https://doi.org/10.1007/BF02706431
Boddewyn, J.J. (1985): Theories of foreign direct investment and divestment: A classificatory note. Management International Review, 25 (1), 57–65.
Breusch, T. S. and Pagan, A. R. (1979): A simple test for hetero- scedasticity and random coefficient variation. Econometrica:
Journal of the econometric society, 47 (5), 1287–1294. https://
doi.org/10.2307/1911963
Byerlee, D., Masters, W.A. and Robinson, D. (2015): Investment in land development: An overlooked dimension of the land grab discourse on frontier agriculture. In pre-conference workshop on Agro-holdings and other types of mega-farming operations at the 29th International Conference of Agricultural Econo- mists, Milan, August (Vol. 8).
Chung, C.C., Lee, S.H., Beamish, P.W. and Isobe, T. (2010): Sub- sidiary expansion/contraction during times of economic cri- sis. Journal of International Business Studies, 41 (3), 500–516.
https://doi.org/10.1057/jibs.2009.72
Cook, R.D. and Weisberg, S. (1983): Diagnostics for heteroske- dasticity in regression. Biometrika, 70 (1), 1–10. https://doi.
org/10.1093/biomet/70.1.1
Cuthbert, D. and Wood, F. S. (1980): Fitting Equations to Data:
Computer Analysis of Multifactor Data. 2nd Edition Wiley. New York.
Dah, F.K. and Khadijah, M.S. (2010): The contribution of oil to the economic development of Ghana: The role of foreign direct in- vestments (FDI) and government policies. (Master Dissertation in International Business 15 ECT). Department of Economics and Informatics, University West.
de Mello Jr., L.R. (1997): Foreign direct investment in de- veloping countries and growth: A selective survey. Jour- nal of Development Studies, 34 (1), 1–34. https://doi.
org/10.1080/00220389708422501
Deming, K. (2011): Food and the Feminization of Agriculture: Land Grab Practices and the Future of Food in Jordan. Washington University Senior Honors Thesis Abstracts (WUSHTA), 3, 92.
Djokoto, J.G. (2012a): An investigation of the drivers of inward foreign direct investment flow into Ghana’s agricultural sector.
Pentvars Business Journal, 6 (1), 19–37.
Djokoto, J.G. (2012b): Does causal relationships exist between ex- ternal trade and foreign direct investment flow to agriculture in Ghana? International Journal of Business Management, 7 (1), 179–193. https://doi.org/10.5539/ijbm.v7n2p179
Dunning, J.H. (1977): Trade, location of economic activity and MNE: a search for an eclectic approach, 395-418. IN: Ohlin, B., Hesselborn, P.-O. and Wijkman, P. M. (eds.) The internatio- nal allocation of economic activity. London: Macmillan Press.
Dunning, J.H. (1988): The eclectic paradigm of international pro- duction: A restatement and some possible extensions. Journal of International Business Studies, 19 (1), 1–31.
Dunning, J.H. (1993): Multinational Enterprises and the Global Economy. London: Addison‐Wesley Publishers.
Dunning, J.H. (2001): The eclectic (OLI) paradigm of inter- national production: past, present and future. Journal of the Economics of Business, 8 (2), 173–190. https://doi.
org/10.1080/13571510110051441
Escresa, L. (2014): Comment on Christian Häberli Foreign direct investment in agriculture: Land grab or food security improve- ment?, 305-319. IN: Eger, T., Oeter, S. and Voigt, S. (eds.) Eco- nomic Analysis of International Law. Tübingen: Mohr Siebeck.
Farr, F. (2017): Drivers of foreign direct investment and foreign direct investment in agriculture in developing countries (Doctoral dissertation, Kansas State University).
Fraser, A. (2019): Land grab/data grab: precision agriculture and its new horizons. The Journal of Peasant Studies, 46 (5), 893–912.
https://doi.org/10.1080/03066150.2017.1415887
Gallova, Z. (2011): Foreign direct investment in selected countri- es of Balkan, does it crowd out or crowd in domestic invest- ment? Czech Financial and Accounting Journal, 2011 (6), 68–78.
Harding, T. and Javorcik, B.S. (2011): Roll out the red carpet and they will come: Investment promotion, information asymmetri- es and FDI inflows. Economic Journal, 121 (557), 1445–1476.
https://doi.org/10.1111/j.1468-0297.2011.02454.x
Husmann, C. and Kubik, Z. (2019): Foreign direct investment in the African food and agriculture sector: trends, drivers and im- pacts. ZEF – Discussion Papers on Development Policy No.
274. http://doi.org/10.22004/ag.econ.287431
Hymer, S.H. (1976): The International Operation of National Firms: A Study of Direct Foreign Investment. Cambridge, MA:
MIT Press.
Kassem, A.Z. and Awad, M. M. (2012): Determinants of foreign direct investment in Egypt’s agriculture. Assiut Journal of Ag- ricultural Science, 50 (4), 191–202. https://doi.org/10.21608/
AJAS.2019.66207
Kim, D.D.K. and Seo, J.S. (2003): Does FDI inflow crowd out do- mestic investment in Korea? Journal of Economic Studies, 30 (6), 605–622. https://doi.org/10.1108/01443580310504462 Knickerbocker, F. (1973): Oligopolistic reaction and multinational
enterprise. The International Executive, 15 (2), 7–9. https://doi.
org/10.1002/tie.5060150205
Lv, L., Wen, S. and Xiong, Q. (2010): Drivers and performance index of foreign direct investment in China’s agriculture. Chi- na Agricultural Economic Review, 2 (1), 36–48. https://doi.
org/10.1108/17561371011017487
McDermott, M.C. (2010): Foreign divestment: The neglected area of international business? International Studies of Manage- ment & Organization, 40 (4), 37–53. https://doi.org/10.2753/
IMO0020-8825400404
Mileva, E. (2008): The impact of capital flows on domestic invest- ment in transition economies, ECB Working Paper, No. 871, European Central Bank ECB, Frankfurt, Germany.
Morisset, J. (2003): Does a country need a promotion agency to attract foreign direct investment? World Bank Policy Research Working Paper, No. 3028. Washington DC, USA.
Nyarko, P.A., Nketiah-Amponsah, E. and Barnor, C. (2011): Effects of exchange rate regimes on FDI inflows in Ghana. Internation- al Journal of Economics and Finance, 3 (3), 277–286. http://doi.
org/10.5539/ijef.v3n3p277
Nyuur, R.B. and Debrah, Y.A. (2014): Predicting foreign firms’ ex- pansion and divestment intentions in host countries: Insights from Ghana. Thunderbird International Business Review, 56 (5), 407–419. https://doi.org/10.1002/tie.21628
Oualy, J.M.R. (2019): Do foreign direct investments FDI crowd in or crowd out domestic investment in Cote D’Ivoire? SSRN Paper. https://doi.org/10.2139/ssrn.3505572
Porter, M. E. (1976). Please note location of nearest exit: Exit barri- ers and planning. California Management Review, 21.
Punthakey, J. (2020): Foreign direct investment and trade in agro-food global value chains, OECD Food, Agriculture and Fisheries Papers, 142, OECD Publishing, Paris. https://doi.
org/10.1787/993f0fdc-en
Ramsey, J.B. (1969): Tests for specification errors in classical lin- ear least‐squares regression analysis. Journal of the Royal Sta- tistical Society: Series B (Methodological), 31 (2), 350–371.
https://doi.org/10.1111/j.2517-6161.1969.tb00796.x
Rashid, I.M.A. and Razak, N.A.A. (2017): Economic drivers of foreign direct investment (FDI) in agriculture sector based on selected developing OIC countries: An empirical study on the provincial panel data by using Stata, 2003-2012. Jurnal In- telek, 12 (1), 6–11.
Romer, P.M. (1992): Two strategies for economic development: us- ing ideas and producing ideas. The World Bank Economic Re- view, 6 (1), 63–91. https://doi.org/10.1093/wber/6.suppl_1.63 Spanhel, C. L., & Boddewyn, J. J. (1983). The crisis divestment
decision process: a descriptive model. Austin, TX: Graduate School of Management, University of Texas, Working Paper, September 1983.
Spanhel, C. L., & Johnson, D. (1982). Issues in the Study of U.S.
Foreign Divestment: A Re- view of Major Studies. Paper pre- sented at the Annual Meeting of the Midwest Academy of Inter- national Business, Chicago, IL, March 1982. (Working Paper, Division of Research, Graduate School of Business, Indiana University.
UNCTAD (2020): Summary: Foreign direct investment: In- ward and outward flows and stock, annual. Retrieved from:
https://unctadstat.unctad.org/wds/TableViewer/summary.aspx (Accessed in October 2020).
United Nations (2014): World Investment Report 2014, Overview - Investing in the SDGs, An action Plan. United Nations Confer- ence on Trade and Development, United Nations, New Pork and Geneva.
United Nations (2015): World Investment Report 2015, Reforming International Investment Governance, United Nations.
United Nations (2020): World Economic Situation and Prospects, Statistical annex.
Vernon, R. (1966): International investment and international trade in the product cycle. Quarterly Journal of Economics, 80 (2), 190–207.
Wilson, B. D. (1980). Disinvestment of Foreign Subsidiaries. Ann Arbor, MI: UMI Press.
World Bank (2020). Agriculture and Food. https://www.worldbank.
org/en/topic/agriculture/overview
Appendix 1: List of countries in the sample.
Developing Developed
Bolivia Madagascar Uruguay Australia France Netherlands
Cambodia Malaysia Venezuela Austria Germany Poland
Chile Morocco Transition Belgium Greece Romania
Colombia Mozambique Albania Bulgaria Iceland Slovakia
Costa Rica Panama Kazakhstan Croatia Italy Slovenia
El Salvador Paraguay North Macedonia Cyprus Japan Spain
Honduras Rep. of Korea Czechia Latvia Sweden
Indonesia Singapore Denmark Lithuania UK
Israel Thailand Estonia Malta USA
Source: own composition