DO INSTITUTIONS STILL MATTER FOR INVESTORS? IMPACT OF INSTITUTIONAL DETERMINANTS ON INVESTMENT INFLOWS
INTO EUROPEAN ECONOMIES*
Victoria DONU – Martin JANÍČKO
(Received: 18 May 2017; revision received: 15 October 2017 accepted: 11 February 2018)
Institutional quality is commonly cited as a reason that investment infl ows still vary across Euro- pean countries, despite their economic stabilization following the tumultuous years in the early 1990s. This article tests empirically whether institutional quality has any bearing on the level of investment infl ows into selected groups of European countries. The role of institutions is assessed using Economic Freedom indices from the Heritage Foundation. We construct a panel dataset from 2000–2015 for 35 European countries to apply a fi xed-effects and generalized method of moments model framework in the regression benchmark with the metrics from the Heritage Foundation. Re- sults show that although institutional quality has some impact on the level of investment, it is less signifi cant than expected and far less than suggested by the existing theoretical literature. Macro- economic fundamentals matter more than do institutional factors.
Keywords: foreign direct investment, institutional determinants, fundamentals, European econo- mies, panel data
JEL classifi cation indices: F21, F23, K20, H11
* Some parts of the article were already published in Acta Oeconomica Pragensia (2015). In comparison with the previous version, the current article contains number of changes, updates and extensions. The authors would like to thank the anonymous reviewers for their valuable comments and suggestions that greatly contributed to improving the article.
Victoria Donu, Charles University in Prague, Faculty of Social Sciences, Institute of Economic Studies. E-mail: victoria.donu@gmail.com
Martin Janíčko, corresponding author. University of Economics in Prague, Faculty of Economics.
E-mail: martin.janicko@moodys.com
1. INTRODUCTION
With the rise of globalisation, foreign direct investment (FDI) has become an important stimulus for productivity and economic growth in both developed and developing countries. Although the level of FDI has been increasing continuous- ly, the spread among countries remains uneven. The available literature explains these differences in allocation by providing empirical analysis on the main deter- minants peculiar to developing economies. Most of these investigations stress the role of market size and economic reforms as the main attractors of FDI inflows, leaving aside focus on the potential role of institutional framework. Pournarakis – Varsakelis (2002), Fabry et al. (2006) and Daude – Stein (2007) emphasise the importance of institutional factors for the FDI levels. Meanwhile, Acemoglu – Robinson (2008) argue that economic structures may prove remarkably resilient to changes in political power and even regimes. By contrast, authors such as Akçay (2001) did not observe any distinct relationship between institutions and the level of investment inflows.
The aim of this paper is to fill the gap in, or elaborate further on, the debate sur- rounding the main determinants of FDI inflows in European countries by provid- ing a quantitative and comparative analysis of the potential institutional factors affecting investment inflows in 35 selected countries in the time span from 2000 to 2015. The countries were grouped based on geographic and economic features and similarities. We develop a model combining traditional FDI determinants and specific institutional indicators, all of which are expected to play a signifi- cant role in explaining the cross-country variation in FDI inflows. The proposed econometric model relies on a panel dataset, developed to capture the dynamic behaviour of the parameters in the regression, and therefore provide somewhat more efficient estimation of parameters used in the model. We analyse the mod- el with commonly employed fixed/random approach as well as the generalised method of moments (GMM, more specifically, System GMM, further referred to as SYS-GMM) to complement the static estimation.
The institutional quality is assessed by the Heritage set of indicators. They re- late to the Economic Freedom Indices provided by the Heritage Foundation and are compiled based on a number of qualitative as well as quantitative factors.
The rest of the article is structured as follows: Sections 2 and 3 summarise and analyse recent literature available on FDI and institutions. Section 4 provides de- tailed information on the employed empirics and model, including description of variables, hypotheses and model specification. Section 5 concludes the article.
2. FDI AND INSTITUTIONS IN RETROSPECTIVE
FDI1 is conventionally considered as a type of investment that includes insertion of foreign funds into an entity that operates outside the country of origin of the investor. Since the 1970s, a significant increase in FDI inflows has been observed in the world economy. Moreover, the growth of FDI inflows has exceeded the growth of world trade and output (Bissoon 2011). A considerable share of FDI in- flows has been attracted by the European Union (EU) members and according to the existing empirical analyses, the main determinants for FDI attractiveness re- late to economic potential, market size, technological progress and competitive- ness (Villaverde – Maza 2012). Likewise, Hunady – Orviska (2014) examined the relationship between corporate taxes along with the macroeconomic variables and FDI levels. They argue that corporate taxes do not play a significant role in FDI while economic conditions such as GDP per capita, trade openness and pub- lic debt have significant effects.
Similarly, Julio et al. (2013) assert that improved home institutions are likely to have a material effect on the FDI levels in Portugal while using more recent data, Donu – Janíčko (2015) concluded that the institutional impact on the levels of FDI appears to be generally weaker than it is stated in the existing literature.
The macroeconomic conditions seem to play a more dominant role in the deci- sion-making process of the investors.
Meanwhile, for transitional economies, the increase in FDI inflows is asso- ciated with the improvement in the economic growth strategy of the country.
Bevan – Estrin (2000) stated that the main problem of these economies is the lack of capital and technology necessary to spur growth while there are suffi- cient stocks of human capital. Considering this aspect, the region became more eager and open to foreign investors after the political changes due to the collapse
1 We can distinguish between horizontal, platform, and vertical FDI; however, in practice the difference between these types is often unclear. Demekas et al. (2005) stated that the horizontal FDI is targeted towards the local markets of the host country, when the production is considered more profitable, thus source countries, instead of considering exports, expand their activity in the market of the host country. Accordingly, market size would represent one of the main determinants for the horizontal FDI and cost of labour for the vertical FDI.
Although, Demekas et al. (2005) suggest that the horizontal FDI are observed on a large scale in comparison with the vertical FDI, both types can be encountered simultaneously.
Finally, the platform investment serves purely for re-exports to third countries. Likewise, we differentiate several investment strategies, one of them is known as the “brownfield investment”. This is based on a company acquiring existing facilities to initiate a business activity in a certain country. The opposite strategy stands for the “greenfield investment” and it consists of developing new equipment and starting an activity from ground zero. It is usually accompanied by providing long-term possibilities for local people to long-term jobs.
of socialism in the early 1990s. Their deteriorated economic conditions sparked a massive economic restructuring inter alia to attract FDI. Therefore, foreign companies were expected to provide assistance through various channels. One of them would be improvement in competitiveness via innovation in products, pro- duction processes and organizational issues. Secondly, it would provide financial support to reduce the existing debt burden and to improve the social imbalances caused by poverty, job losses, and income distribution (Pournarakis – Varsakelis 2002). Also, in the last years, massive FDI inflows were observed exactly in the regions treated by this paper, also stressing the fact that these economies have made significant progress in attracting them (Dorożyńska – Dorożyński 2015).
The uneven distribution can still be driven by localization advantages, political, social and economic progress, all of which might have influenced the decision- making process of investors. The economies in transition start to earn credibility, consequently giving these countries an impulse to continue the socio-economic and infrastructural development. It is a mutually favourable situation when the host countries benefit from financial assistance and the entrepreneurs from the source countries are provided with incentives to find unsaturated markets and new business opportunities. For instance, using a panel estimation analysis in eight Central and Eastern European (CEE) countries, Bellak et al. (2009) con- cluded that both taxes and telecommunication infrastructure endowment play an important role in the localization decisions made by the investors.
The transitional economies from South Eastern Europe (SEE) registered the highest FDI stock as a percentage of GDP between 2005 and 2014 (Dauti 2015).
The ongoing process of macroeconomic stabilisation, abandoned national and ethnic conflicts along with progressive and constructive negotiations with the EU on potential membership, has improved the perception of foreign investors regarding the region and the prospective investment. However, even if at a first glance it may seem that the transitional economies mainly attract market-seekers, Pournarakis et al. (2002) argue that the presence of natural resources and cheap labour force do not seem to be the main drivers of FDI anymore. They stated that the multinational enterprises (MNEs) are slowly shifting to efficiency-seeking FDI, therefore the emphasis is now more on quality and stability. Even though inexpensive labour might not always be the main driver for investors, Botrić – Škuflić (2005) state that FDI into developing countries consist more in knowl- edge transfer using the already present production in the host country.
Until quite recently, the institutional framework of a country was not much taken into consideration when analysing the level of FDI inflows. In institutional economics, the term “institutions” has a variety of meanings. As North (1990:27) puts it, “(institutions) provide rules, constraints and incentives that are instru-
mental for the governance of exchanges”.2 Ali et al. (2008) found that good insti- tutions with efficient rules of enforcement tend to substantively decrease the cost of doing business. Among other things, the institutional determinants depend on the efficiency of government policy implementation and on the characteristics of political and social entities. These characteristics include the level of political and social risks, transparency of regulatory framework, political stability and effec- tive property rights protection, rule of law, lack of corruption and efficient bank- ing environment. The level of corruption creates conditions for unfair competi- tion and thus putting up barriers for investors. Nevertheless, it should be treated also with more complexity. An interesting finding is presented by Brada et. al.
(2014) in a model showing that the MNEs have incentives to invest in countries with similar corruption levels as in their home country. Thus, this occurrence should not just be seen as a simple linear negative relation where the more cor- rupt countries receive less investment. For the purposes of this study, we take the basic assumption of a negative relationship in terms of FDI changes. The taxa- tion system is also taken into account since high taxes may hamper growth and productivity, and discourage investment.
Despite the vast empirical investigation on institutional quality performed on the determinants of FDI, there is no consensus on the role of institutions due to their nature and complexity. Thus, there is not a single generally accepted empiri- cal explanation since they tend to evolve in space and time. Employing a static model might therefore not capture the full picture and dynamics of the evolution of institutions. The available literature mention that the factors such as effec- tiveness of property rights, sound and stable regulatory framework, economic freedom and lack of corruption are important for the investors’ decision-making process. It is deemed that the localization advantages make some countries more attractive than others. Those can be size of the market, macroeconomic stability, and cost of labour, economic growth, trade openness, political stability, trans- parent regulatory framework, corruption, and privatisation process (Dumludag 2009). Meanwhile, Brada et al. (2017) found a non-monotonic relationship be- tween home-country corruption for outward FDI, with both high and low levels of corruption reducing the probability of FDI outflows.
An early attempt to study the impact of institutions on FDI level was made by Wheeler – Moody (1992). Taking the first principal component of 13 risk fac- tors (including the quality of legal system, corruption, bureaucracy and political
2 The institutional framework consists of three components: formal rules, informal rules and enforcement mechanisms. The formal rules are considered the written rules of a society. Ex- amples of formal institutions could be regulation of banks, imposition of tariffs and quotas, or laws governing contracts (North 1990).
instability), the authors did not find that the “good” institutions have a consid- erable impact on the location of the U.S. foreign affiliates. Moreover, Rodrik (1999) added “social conflict” indicator as one of the explanatory variables in his estimations. His empirical results showed that what matters are the rules of a game in a society. Daniele – Marani (2006) discuss the potential channels through which institutions may affect the level of investment. First, the presence of good institutions tends to improve factor productivity, and subsequently stimulates investment, regardless whether domestic or external. Also, the well-performing institutions are associated with lower investment transaction costs. Finally, FDI are typically associated with high sunk costs. Thus, good institutions add more credibility and security for the MNEs.
Still, the available empirical evidence is quite inconclusive. Using a sample of 83 developing countries in the period between 1984 and 2003, Busse – Hefeker (2005) found that the factors such as government stability or ethnic tensions have significant influence on the FDI of multinational corporations. The level of mac- roeconomic stability represented by inflation and corruption turned out to be sig- nificant to a lesser degree. Similarly, using granular sectoral data, Álvarez et al.
(2015) analysed the effects of institutions on international trade and also tested institutional distance of the source and host countries. The results indicated that both institutional conditions and distance play an important role, however, these two factors stand for a relatively small fraction of international trade and the im- portance has not increased in recent years.
Analysis on institutional quality in transitional countries is of major interest since these economies, in general, represent a suitable natural environment model for studying institutional improvements of economic development (North 2005).
The change of the economic system from socialism to capitalism/market econ- omy in the CEE region also included significant institutional changes, allowing researchers to test the importance of institutions for several areas of economic life. One of the earliest attempts to investigate institutional framework in the transitional economies was made by Holland – Pain (1998). They examined a time-series of 11 transitional countries from 1992-1996 using the specific transi- tion indicators from the EBRD database. The analysis showed that besides the macroeconomic indicators like trade openness and labour costs, the method of privatisation appeared to be an important determinant influencing FDI inflows.
Likewise, Pournarakis – Varsakelis (2002) analysed the impact of institutional environment on investment inflows of 10 transitional CEE countries for the pe- riod of 1997–2000. They found that weak civil and political rights prevent the country from being attractive to foreign investors. Moreover, a transparent busi- ness environment is a significant advantage regarding the attraction of FDI from the EU member states. Sušjan et al. (2007) confirm the assumption that FDI can
spur economic growth in the transitional economies and that institutions play an important role for the level of FDI. Employing Economic Freedom Indices from the Heritage Foundation database, they emphasized that property rights protec- tion and regulation are major institutional determinants for FDI inflows.
Among the recent empirical studies, Kersan-Šcabić (2013) analysed the insti- tutional environment in the Balkans and its impact on the level of FDI inflows.
The author states that besides the main macroeconomic drivers, level of corrup- tion, large scale privatisation and overall infrastructure reform play an important role in assessing institutional factors that determine the level of investment in- flows in the region.
Fabry – Zeghni (2006) analysed the importance of EU membership variable in explaining the level of FDI in the transitional economies. They found that FDI are more sensitive to institutions in the non-candidate countries than in the future or the current EU members. This can be explained by the fact that before joining the EU, the candidate countries make substantial effort to improve their legal, political and economic institutions, adopting more stable and transparent rules.
The EU integration process appears to have positively affected FDI inflows in the CEE in the past 20 years. To prove this assumption, Bevan – Estrin (2000) constructed variables representing for admission of the CEE countries to EU as a result of the progress made by the candidate countries in fulfilling the member- ship criteria of the Essen European Council Meeting in 1994 and 1995 and the Agenda 2000 document announcing the “first” and the “second” wave countries.
The results show that the countries announced in the future perspective of EU enlargement significantly improved their image as investment destinations. Con- sequently, the same authors mention that countries like the Czech Republic, Hun- gary, Slovakia and Poland observed an increase in FDI levels after the official announcement. They conclude that the positive feedback related to the progress of these countries might improve their institutional quality as they comply more with the EU requirements.
3. DATA AND MODEL SETUP
The study aims to fill the gap in the ongoing debate on the determinants in selected geographical regions by providing a comparative econometric analysis of the in- stitutional factors affecting investment inflows in these countries covering a time span of 16 years between 2000 and 2015. For a better assessment of the specific institutional environment, we grouped the countries by their geographical posi- tion and provided a comparative analysis on the results obtained in each group of countries. We developed a model that combines the macroeconomic determinants
and the specific transitional factors (such as level of privatisation or government effectiveness), expected to play a certain role in the decision-making process of multinational companies that have invested in these countries. Previous empiri- cal literature puts emphasis on the models using fixed and random effects. Yet, we also employ the dynamic model of generalised method of moments (GMM) which addresses consistency of the estimators when endogeneity is present in the model. More specifically, we employ the SYS-GMM model which takes the lagged values of both levels and differences. We consequently use Sargan-Hansen and Hausman tests to confirm the validity of the selected approach.
Our goal is to analyse the factors with a common causal impact on the levels of FDI in the selected groups of countries from 2000 to 2015. Even though most authors use FDI inflows as the dependent variable, we apply the principle high- lighted by Benáček et al. (2014) and construct FDI stocks based on the annual FDI inflows. The drawback of using pure FDI net inflows lies in the presence of large amount of negative inflows, making logarithmic transformations in the model more difficult, possibly hampering fundamental properties of the time series, and therefore causing loss of efficiency in estimators. Although we understand that nominal exchange rates may also play a role in investors’ decision-making proc- ess, it is generally recommended to calculate the stock using accrued values of FDI flows at market prices in the time of FDI acquisition (Duce 2003).
The FDI stock time series is constructed using FDI stock in the original year t and adding net FDI inflow in all the subsequent years, so that FDI stock in t+1 equals FDI stock in t plus net inflow in the second year of the time span. This also helps avoid a situation in which pure fluctuation of the nominal exchange rate would have significant impact on FDI stock in the respective countries. For illustration, since the beginning of 2008, the U.S. dollar appreciated by a total of 35% vis-à-vis the euro. The presented time framework was selected based on the rationale that the majority of the transition economies started to attract FDI stocks only after the mid-1990s while the developed European economies accumulated a more significant amount in the same period, thus to provide a more uniform setup for empirical analysis the coverage starts in 2000. Along with the levels of FDI stocks, we assume that the unstable institutional framework in the 1990s due to continuous economic and political efforts has been addressed and moderate progress has been registered in the early 2000s.3
The FDI data was collected from the UNCTAD database and it is measured in million U.S. dollars (at current prices). The independent macroeconomic vari-
3 Although the authors understand that even this approach exhibits a small valuation effect caused by foreign exchange volatility, they consider it as a preferable one since it is the most transparent and intuitive, while valuation effects are only limited in scope.
ables were chosen based on previous literature, suitability for the selected groups of countries and availability of the dataset for the selected period.4
Economic development is represented by GDP per capita in constant prices. It is considered one of the most important factors in explaining foreign investment in both levels and inflows and it was also employed by previous researchers as a measure for market size and purchasing power (Chakrabarti 2001; Carstensen – Toubal 2004; Janicki – Wunnava 2004). The metric also captures potential econo- mies of scale in production. The data for this variable are harvested from the World Bank Economic Indicators. It is expected to be a positive and significant determinant of FDI inflows, as suggested by numerous empirical studies (Bevan – Estrin 2000; Asiedu 2002; Garibaldi – Mauro 2002).
Population size is taken as a proxy for market size in our model. Authors such as Aziz – Makkawi (2012) concluded that a country’s population would be posi- tively related to FDI when considering 56 Asian and African countries. It is ex- pected that the larger the population, the higher the demand for products and services provided by investors. This implies more economic activity thus more opportunities for FDI inflows (Liang – Yoon 2011). The data is collected from the World Bank (World Development Indicators).
Telecommunication infrastructure measure (number of phone devices per 100 people) is a standard measure in the literature for infrastructure development (Demirhan – Masca 2008). It is proven that high-quality infrastructure stimulates FDI inflows and increases productive potential of investments (Jordaan 2004).
Data is retrieved from World Bank (World Development Indicators).
Corporate tax rates5 can be a decisive factor for companies when they consider broadening their investment activities abroad. The existing literature is, however, indecisive with studies showing a negative as well as no impact on FDI. Authors like Loree – Guisinger (1995) and Kemsley (1998) concluded that high corporate taxes have a negative effect on the levels of FDI, while Porcano – Price (1996) show that taxes do not affect FDI inflows in any significant manner. Our assump-
4 It should be noted that we do not distinguish between greenfield and brownfield investment, as this is not permitted by the low data granularity and possible methodological drawbacks of such an approach as well as potential problems with hidden endogeneity.
5 For the purpose of this article, we consider only statutory corporate rate, and not the effective one which measures the corporate rate paid by firm in reality, i.e. after taking into consideration tax credit, incentives and other possible deductions. A quality discussion about the effects of statutory versus effective corporate tax rates can be found in Bellak – Leibrecht (2009). The authors find evidence that semi-elasticity with respect to corporate taxes is higher for effective tax rates than the statutory ones.
tion is that low corporate taxes should boost FDI inflows. Data is retrieved from Trading Economics website.6
The index of economic freedom compiled by the Heritage Foundation7 is as- sessed as an indicator of economic and social progress of the respective country.
Features characterising a solid economic freedom index are healthy societies, higher per capita wealth, democracy, and poverty reduction. The index is meas- ured based on a total of ten factors grouped into four broad dimensions, or pillars, defining “economic freedom”. To provide a complete analysis, we have carefully chosen four most representative factors from each bin to be included in our mod- el. Although, in theory, all components of economic freedom are important, we have selected those that are believed to be most relevant for investors and have been also articulated by the existing literature on the topic. A country’s overall score is calculated by averaging all indicators and assigning them equal weights afterwards (Heritage Foundation 20158). The selected factors are as follows:
Corruption freedom (CORR) measures the extent to which corruption erodes economic freedom by affecting economic relationships with insecurity and un- certainty and how much it is present in a country. The indicator is assessed using qualitative information from internationally recognized sources.
Fiscal freedom (FISC) relates to the level of tax burden imposed by the state.
It incorporates direct taxes in terms of marginal rates on corporate and individual incomes, and overall taxes, including all forms of indirect and direct taxation at all government levels.
Business freedom (BUSINESS) is an indicator treating the efficiency of gov- ernment business regulations. The quantitative score is based on a multitude of metrics about starting, operating and closing a private business.
Investment freedom (INVEST) is a composite measure looking at absence of restrictions and constraints in movement of investment capital. Main restrictions
6 The authors also tested investment incentives as one of the drivers, however, they did not prove to be a good predictor in most cases presumably because of poor quality of available series, their inconsistency in terms of definition as well as low cross-section variability of this metrics for certain groups of states, such as Visegrad, for example.
7 Originally, we also considered using EBRD indicators, however, since those are not available for the Western countries and ceased to be available for most of the CEE region following the 2004 EU enlargement, only Heritage Foundation was ultimately considered in the article.
Also, until where comparable, the two sets of indices were relatively strongly correlated with each other.
8 It should be noted that the Heritage Foundation 2017 differ slightly from this original definition.
Most notably, the total number of indicators is higher, as some of them were split into more granular categories. The Heritage Foundation indices corresponding to 2015 specification can be obtained from the authors upon request.
are different rules for foreign and domestic investment, imposed restrictions on payments and transfer, and weak infrastructure.
Meanwhile, the remaining Heritage Foundation sub-indicators have not been considered in the analysis as either their expected impact was judged to be rather low, or they would be often collinear with the above-mentioned measures or with the pure economic drivers in the model. Their inclusion on top of the existing indicators would also likely lead to model overspecification.9
Our hypotheses and directions of influence can be summarised as follows:
H1: The higher FDI inflows are associated with a more stable and dynamic macroeconomic environment with developed infrastructure and reasonable mar- ket size.
H2: The safer and more reliable the political, economic, and social institutions in a country, the higher the FDI inflows.
We believe that macroeconomic and institutional variables complement each other, and hence countries with solid economic features indirectly imply pro- gressive institutional framework. Based on specific geographical regions, the institutional features have various levels of impact for investors as they seek op- portunities based on the specific concepts and alternatives. Also, the pace of de- velopment differs among countries/regions thus our goal is to determine which variables have a more significant role for investors. The selection of existing explanatory variables was based on existing literature and evidence on previous empirical assessments; nevertheless, we cannot exclude the possibility of leaving out important factors/variables from our model.
The omitted-variable bias is a common problem for panel data estimation.
The “bias” can yield erroneous results when it compensates for the missing vari- able by either over- or under-estimating the effects of the variables already in- cluded in the model. However, we cannot exclude the presence of natural unex- plained volatility and animal spirit phenomenon in the decision-making process of the investors. Early discussion on this point of view was provided by Keynes (1936:161– 162 ), who defined this phenomenon as a “spontaneous urge to action rather than inaction and not as the outcome of a weighted average of quantitative benefits multiplied by quantitative probabilities”. This is a central idea in explain- ing the instability in investment decisions which the conventional theory fails to explain. Later authors like Piroşcă (2011) asserted that the animal spirit comes from an intense desire for investment and investors are tempted to hope that econ- omy will everlastingly grow based on a notion that nothing can go wrong at least in the short run. A good illustration would be the Chinese investment, typically
9 Those indicators include government integrity, judicial effectiveness, government spending, fiscal health, and also labour, monetary, trade, and financial freedom.
supported by the state, often disconnected from any drivers or previous patterns.
Also, investors might have political inclinations towards investing into a specific country and the mainstream drivers highlighted in the existing literature that it may not play such an important role. Likewise, choosing panel data as an estima- tion technique gives major advantages over cross-sectional and time-series data sets. It increases the degrees of freedom, reduces collinearity among explanatory variables but generally the setup provides means of resolving the econometric questions in the presence of the unobserved or mismeasured variables correlated with the explanatory variables.
Based on the hypotheses stated above, we estimate the following model, using a type of log-log specification. The log transformations are useful when facing highly skewed distributions or significant volatilities in the data. They do not guarantee, however, the stationarity of the data per se. Hence, the respective vari- ables have been further transformed into differences to achieve stationarity, i.e.
a process with unaltered joined probability for different points in time, therefore not exhibiting either trend or unit root. Also, taking the natural logarithm of the variables in question helps a better fit of the model as log transformations render positively skewed distribution more normal. When a change in the dependent variable is related to percentage change in an independent variable, the relation- ship drifts away from possible dependencies on the levels. Although the final interpretation of the coefficients may look cumbersome since they show percent- age changes in elasticities, they still retain reasonable economic interpretation.
Moreover, their most important interpretation needs to be made with respect to their relative sizes and intuitive signs.
, , , ,
, , ,
_ 1 _ 2 _ 3 _
4 _ 5 _
i t i i t i t i t
i t i t i t
D LFDI D INST D LGDP D LPOP D TELEC D TAX
α β β β
β β ε
Where:
α is the intercept and ε is the error term.
D_LFDIi,t is the difference in natural logarithms of FDI stocks for a country i in year t as per earlier explanation.
D_INSTi,t stands for the difference in indicators that measure institutional quality for country i in year t as per earlier explanation.10
D_LGDPi,t is the difference in natural logarithm of GDP per capita for country i at time t as per earlier explanations.
10 The differences account for changes in the institutional environment in the country as the indicator exhibits strong persistence. Moreover, since this set of drivers may be somewhat subjective due to the collection and aggregation methods used by the responsible institutions, the differences also have better economic interpretation.
D_POPi,t is the difference in natural logarithm of population size for country i at time t as per earlier explanations.
D_TELECi,t stands for the difference in telecommunication infrastructure for country i at time t as per earlier explanations.
D_TAXi,t stands for the official corporate tax rate for country i at time t and it represents a part of cost of doing business.
It is taken as the metrics showing potential for future profitability of compa- nies as per earlier explanations. The variable is different from the FISC institu- tional variable in that it only indicates the tax burden for businesses. Meanwhile, the FISC variable indicates the burden imposed by government spending in the economy with its potential repercussions. The two variables may or may not be collinear, depending on how the tax system is organized in a particular country.11
Our empirics is based on a methodology using panel data specifications with relatively symmetric panels in cross-section and time dimension. This technique exhibits a set of advantages in comparison with pure time-series and/or cross- sections since it incorporates all the available information that might provide use- ful insights when analysing the dataset (Baltagi – Kao 2000). Ranjan – Agrawal (2011) confirm that panel data has advantages by specifying individual hetero- geneity and reducing the chances of getting biased and/or inconsistent results and by providing a large framework of data points. The well-known fixed effect estimator can be inconsistent if the time framework is too small (Nickel 1981) therefore we simultaneously employ the dynamic model of generalized method of moments (GMM) estimator (Arellano –Bond 1991), allowing for constructing more efficient estimates of dynamic panel data model. This method combines the standard set of equations in the first differences with lagged levels as instruments with an additional set of equations in levels with the lagged first differences as in- struments (Benáček et al. 2014). In the estimation of the model using fixed versus random effects, the latter was rejected by Hausman test whose values were less than 0.001. The suitability of random effects was rejected in all cases. Essentially, we have used the two mentioned approaches in order to determine if the institu- tional structure in these sets of countries is an authentic cause of the changing levels of FDI inflows and a determinant spurring economic growth in the regions.
Thus, we are estimating the model by analysing FDI absorption among countries with different market sizes at a given time. This would be a static approach based on past decisions and outcomes. However, every experienced investor would also consider the dynamic development and evolution over time of these markets.
11 One can take here two examples: France and the Czech Republic. While in both countries, government spending to GDP is relatively high compared to the OECD average, the statutory corporate taxes are significantly higher in France than in the Czech Republic.
By using both static and dynamic estimation, we analyse a two-stage process whereby investors first decide where to locate their investment and then how much to invest in time. After testing the statistical properties of our exogenous variables, we have selected the final determinants that present the most relevance and significance in explaining FDI inflows in the given group of countries. The panel data regressions will be estimated separately for the three groups of coun- tries, while taking differences of logarithmic transformation of independent vari- ables and differences for the institutional variables. The model was also tested without transformation of the institutional drivers, and the results did not ex- hibit valid economic intuition, while being weighed down by serial correlation.
Moreover, time series were not stationary in levels and, using Johansen test, no cointegration was found between the variables in question. By running the trans- formed model, the explanatory power of the model was significantly improved and the results could be economically interpreted. Due to the transformation, we are working with percentage changes, thus we analyse the evolution of the chosen determinants from investors’ perspective with all available information embodied in them. Moreover, we transform the institutional variables using differences in order to understand if their importance in the 2000s is similarly as important as it was in the 1990s for investors. One of the problems which may arise is that panel regression analysis with respect to independent and identically distributed ran- dom variables, or i.i.d., may entail autocorrelation of disturbances. This specific issue was solved by taking the first difference of institutional variables.
The statistics provided by Durbin-Watson test demonstrated that autocorre- lation was substantively reduced in the model. To account for stationarity, se- lected variables are transformed in differences of logs and are viewed as growth rates. After the transformation, Levin–Lin–Chu test for unit roots or stationarity in panel datasets bias-adjusted t-statistic scored between –3.79 and –4.51, denot- ing significant value at the standard testing levels. Consequently, we rejected the null hypothesis and conclude that all the transformed series were stationary at the 5% significance level. Another issue to consider is to assess the extent to which multicollinearity between independent variables exists in the model. The initial Variance Inflation Factor (VIF) test, when we included a wide range of macr- oeconomic variables (such as GDP per capita, real GDP growth, labour costs, and trade openness), showed that some variables were highly collinear pointing to potential endogeneity in the explanatory variables. This obviously suggests that economic underdevelopment may determine institutional underdevelopment and vice-versa. This causality is seen as a natural endogeneity of development in real world. Hence, we had to drop some variables from the model, which noticeably reduced multicollinearity. Finally, all models are adjusted for heteroscedasticity using cluster robust standard errors.
4. RESULTS AND INTEPRETATION
The respective panel estimation results for 35 countries are presented in Tables 1 to 6. The countries were grouped according to their geographical allocation in or- der to provide a comparative assessment of the institutional framework specific for each of them. The grouping of the countries was based on the corresponding similarities of historical development and we assume a positive correlation in economic level among and within these groups. The first group consists of the
“Western block” (WE) countries: Germany, France, the United Kingdom, Portu- gal, Spain, Belgium, the Netherlands, Switzerland, Austria, and Italy. The second group is represented by the Central and Eastern European (CEE) countries: the Czech Republic, Slovakia, Poland, Hungary, Lithuania, Latvia, and Estonia, while the third group consists of selected South East European (SEE) countries12, main- ly based on data availability: Romania, Bulgaria, Macedonia, Slovenia, Croatia, Bosnia and Herzegovina, Bulgaria, Albania, and Serbia. Institutional variables were added to the benchmark model. The Heritage indicators are employed in the model for each highlighted group of countries.13 The selected time framework represents recent data covering one full business cycle, including episodes of recession and recovery.14
The static time series estimation with fixed effects reveals three main macr- oeconomic determinants playing a decisive role in the decision-making process of the investors in this specific region: GDP per capita (GDP), size of the population (POP) and infrastructure development (TELEC). Among the institutional varia- bles, freedom from corruption (CORR) and fiscal freedom (FISC) are significant at 5% and 10% levels, respectively. CORR appears to play a more significant role in comparison with the less pronounced importance of FISC. This highlights the dominating position of the economic criteria along with a weak performance of the institutional determinants. Variables such as business freedom (BUSINESS) and investment freedom (INVEST) are found less significant, however, they can be complementary to the macroeconomic variables which show a strong impact on the level of FDI. For this model specification, we can conclude that in the long term, economic maturity plays a pronounced role in FDI allocation while the institutional impact is weaker.
12 Sometimes also referred as the South East European region or Southeast Europe (SEE).
13 A dummy for EU membership was initially used as a control variable in the model, however, the results showed little significance for the investor, and therefore it was excluded from the final model specification.
14 The length of these business cycles broadly corresponds to Juglar-like economic fluctuations.
The regression with GMM system estimators provides a similar view as in the estimation with fixed effects, where economic fundamentals dominate the at- traction of FDI even though their importance was not confirmed unanimously in both cases. GDP and POP present a pronounced significance while TELEC can hardly be associated as an imposing determinant. The institutional determinants present a much weaker impact suggesting complementarity between economic soundness and improved institutional framework. In these setups, institutional environment did not show any widespread strong significance. The implication suggests that once we excluded the high collinearity of institutional variables with some of the economic ones during the 16 years’ time span, their relation to FDI evolved differently in comparison with other countries, thus providing statistically insignificant results. The lagged value of the dependent variable does not influence the decision-making process of the investors presenting a scenario where established economic environment and recent developments are the main attributes for signing investment transactions.
Table 1. Fixed effects model: FDI inflows to Western countries using Heritage Foundation indices
Model 1-FE Model 2-FE Model 3-FE Model 4-FE CONST
D_LOG_GDP
0.060***
(0.000) 0.653***
(0.000)
0.059***
(0.000) 0.692***
(0.000)
0.058***
(0.000) 0.627***
(0.000)
0.059***
(0.000) 0.712***
(0.000)
D_LOG_POP 2.008**
(0.016) 1.883**
(0.026) 1.978**
(0.024) 2.021**
(0.018)
D_TELEC 0.000**
(0.023) 0.000***
(0.009) 0.000**
(0.021) 0.000**
(0.013)
D_TAX 0.002
(0.573) 0.001
(0.631) 0.001
(0.653) 0.001
(0.617)
D_CORR 0.003**
(0.047)
D_FISC 0.002*
(0.086)
D_BUSINESS 0.002
(0.190)
D_INVEST 0.001
(0.640) R-sq. within
R-sq. between F-test (model) S.D. (dep. var.) Obs.
0.124 0.521 1.470 0.061 150
0.057 0.509 1.443 0.061 150
0.127 0.543 1.408 0.061 150
0.111 0.517 1.363 0.061 150
Note: P-values are presented in parentheses. ***, **, * indicate significance at 1%, 5%, and 10% levels, respectively.
It is worth mentioning that this aspect can be interpreted as the “animal spirit”, mentioned earlier in the text. Some investors do not follow prudential approach but rather go with the instinct in determining prospective investment opportuni- ties, a thing hardly ever captured by the data. The engine for FDI attraction in advanced economies rests in their economic development and infrastructure, as these countries are considered to have achieved a high degree of harmonization with the EU, implying institutional inertia.
Table 3 with estimates for the selected CEE countries paints a similar picture.
GDP and TELEC are decisive economic factors with high elasticities. Relatively low corporate taxation vis-à-vis the advanced economies positively influence the rising FDI inflows, yet with a weaker impact than expected. POP could also pro- vide useful insights, nevertheless it was omitted from the model due to collinear- ity with GDP per capita in the case of the CEE region. The results reveal mostly insignificant impact of institutional variables in the region. FISC presents the
Table 2. GMM estimation: FDI inflows to Western countries using Heritage Foundation indices Model
1-SYS-GMM
Model 2-SYS-GMM
Model 3-SYS-GMM
Model 4-SYS-GMM D_LOG_FDI_TO(-1)
CONST
D_LOG_GDP
–0.028 (0.833)
0.061***
(0.000) 0.498***
(0.002)
–0.045 (0.738) 0.061***
(0.000) 0.512***
(0.001)
–0.039 (0.758)
0.061***
(0.000) 0.454**
(0.014)
–0.031 (0.817)
0.061***
(0.000) 0.528***
(0.001)
D_LOG_POP 1.880***
(0.001) 1.883***
(0.001) 1.870***
(0.002) 1.900***
(0.002)
D_TELEC 0.001*
(0.077) 0.001**
(0.047) 0.001*
(0.086) 0.001**
(0.047)
D_TAX 0.001
(0.850) 0.000
(0.944) 0.001
(0.888) 0.001
(0.866)
D_CORR 0.002
(0.193)
D_FISC 0.002*
(0.090)
D_BUSINESS 0.002
(0.275)
D_INVEST –0.001
(0.923) Test for AR(1)
Test for AR(2) Sargan test Wald test
0.006 0.337 0.000 0.000
0.006 0.259 0.000 0.000
0.005 0.170 0.000 0.000
0.005 0.297 0.000 0.000 Note: P-values are presented in parentheses. ***, **, * indicate significance at the 1%, 5%, and 10% levels, respectively.
highest prevalence. This is relevant in the context of including one lag for insti- tutional determinants supporting the approach of following the previous invest- ment trends. Further, corruption and investment burdens do not seem to impede investors in the decision-making process. Corruption in bureaucratic mechanisms was previously discussed by Schleifer – Vishny (1993). They distinguish between organized and disorganized corruption. The former implies that payers can de- crease transaction costs when there is a well-defined bribing process, however, the outcomes can be uncertain in either case. Although the estimation results do not provide a fully comprehensive overview of the indicator, we assume hidden complementary effects due to the predetermined existence of bureaucratic insti- tutions in the specified region.
Results provided by the SYS-GMM estimator show similarity with the fixed effects estimator confirming unanimously the impact of the selected determi- nants. Economic development (proxied by GDP per capita) and TELEC are the economic pillars for the investors in their FDI scheme. The elasticities of the in- stitutional variables are lower than in the case of advanced economies showing a lesser impact of institutional restructuring on FDI inflows. One important finding emerges when we compare the analysed groups of countries. The association of
Table 3. Fixed effects model: FDI Inflows to CEE region using Heritage Foundation indices Model 1-FE Model 2-FE Model 3-FE Model 4-FE CONST
D_LOG_GDP
0.078***
(0.000) 0.436**
(0.019)
0.074***
(0.000) 0.418*
(0.069)
0.078***
(0.000) 0.438**
(0.019)
0.075***
(0.000) 0.422**
(0.025)
D_TELEC 0.004***
(0.000) 0.003***
(0.004) 0.004***
(0.000) 0.004***
(0.000)
D_TAX –0.008
(0.319) –0.007
(0.352) –0.008
(0.309) –0.009
(0.274)
D_CORR_1 6.399
(0.974)
D_FISC_1 0.005*
(0.056)
D_BUSINESS_1 0.001
(0.559)
D_INVEST_1 0.003
(0.379) R-sq. within
R-sq. between F-test (model) S.D. (dep. var.) Obs.
0.355 0.630 0.924 0.087 98
0.356 0.644 0.957 0.087 98
0.326 0.618 0.916 0.087 98
0.343 0.621 1.038 0.087 98
Note: P-values are presented in parentheses. ***, **, * indicate significance at the 1%, 5%, and 10% levels, respectively.
institutional variables with accumulation of FDI stocks is less pronounced than with the economic variables. Investors analyse the state of institutions in different points in time for the CEE countries while in advanced economies they tend to follow the “animal spirit”. The difference in behaviour is related to the perception of stable institutions in advanced economies and dynamic and frequently chang- ing environment in emerging markets. While this assumption may be accurate, it creates room for discriminatory actions based on country, region, possibly institu- tional framework and the overall accumulation for FDI stocks in the long run.
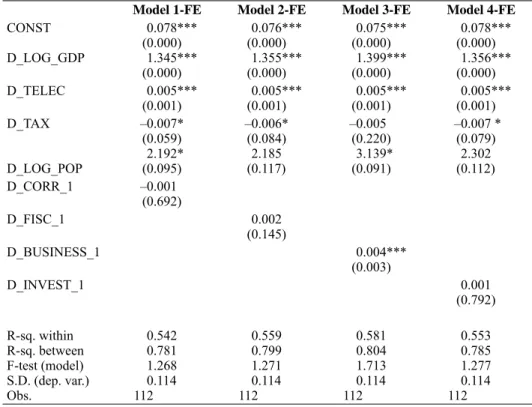
The assessment for the transition economies in the SEE delivers a slightly dif- ferent overview on the topic. The list of vital attractors is confirmed in various levels of significance for all macroeconomic variables included in the model. In contrast to the CEE and the WE, the building of FDI stock largely depend on con- tinuous implementation of economic reforms. Several factors can be associated with these conclusive remarks. The region is known for facing economic, social
Table 4. GMM estimation: FDI Inflows to CEE region using Heritage Foundation indices Model
1-SYS-GMM
Model 2-SYS-GMM
Model 3-SYS-GMM
Model 4-SYS-GMM D_LOG_FDI_TO(1)
CONST
D_LOG_GDP
0.266***
(0.000) 0.049***
(0.000) 0.444**
(0.015)
0.259***
(0.000) 0.047***
(0.000) 0.408**
(0.021)
0.269***
(0.000) 0.049***
(0.000) 0.426**
(0.023)
0.271***
(0.000) 0.048***
(0.001) 0.416**
(0.028)
D_TELEC 0.003***
(0.001) 0.002***
(0.005) 0.003***
(0.001) 0.003***
(0.001)
D_TAX –0.008
(0.150) –0.008*
(0.080) –0.009
(0.102) –0.009
(0.139)
D_CORR_1 0.002
(0.409)
D_FISC_1 0.004**
(0.040)
D_BUSINESS_1 0.001
(0.421)
D_INVEST 0.002
(0.609) Test for AR(1)
Test for AR(2) Sargan test Wald test
0.031 0.127 0.000 0.000
0.033 0.153 0.000 0.000
0.036 0.127 0.000 0.000
0.038 0.146 0.000 0.000 Note: P-values are presented in parentheses. ***, **, * indicate significance at the 1%, 5%, and 10% levels, respectively.
and political struggles in the early 1990s, thus maximizing investors’ attention on monitoring the macroeconomic and selective institutional factors of the coun- tries. Sound and established business environment represents an important factor in the decision-making process of the investors. Moreover, investors assess the suitability of various institutional layers based on geographical preferences. This finding suggests certain discriminatory approach associated with specific percep- tion levels of investors.
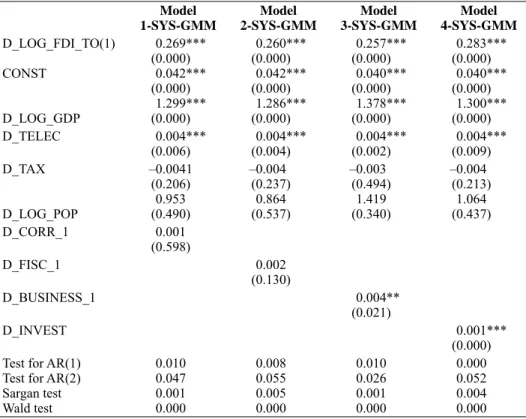
Same specification but in a more dynamic setup presents a slightly different interpretation. The magnitude of the economic variables is reduced to the sig- nificance of market size (GDP) and telecommunication infrastructure (TELEC).
The perception of economic slow lane does not only disqualify these countries as potential FDI receivers, but simultaneously reduces the confidence levels in the quality of their institutions. Investment and business environment presents two main pillars for the investors when assessing investment opportunities while CORR has the correct sign but presents no significance. It is important to stress
Table 5. Fixed effects model: FDI inflows to SEE region using Heritage Foundation indices Model 1-FE Model 2-FE Model 3-FE Model 4-FE CONST
D_LOG_GDP
0.078***
(0.000) 1.345***
(0.000)
0.076***
(0.000) 1.355***
(0.000)
0.075***
(0.000) 1.399***
(0.000)
0.078***
(0.000) 1.356***
(0.000)
D_TELEC 0.005***
(0.001) 0.005***
(0.001) 0.005***
(0.001) 0.005***
(0.001) D_TAX
D_LOG_POP
–0.007*
(0.059) 2.192*
(0.095)
–0.006*
(0.084) 2.185 (0.117)
–0.005 (0.220)
3.139*
(0.091)
–0.007 * (0.079)
2.302 (0.112)
D_CORR_1 –0.001
(0.692)
D_FISC_1 0.002
(0.145)
D_BUSINESS_1 0.004***
(0.003)
D_INVEST_1 0.001
(0.792) R-sq. within
R-sq. between F-test (model) S.D. (dep. var.) Obs.
0.542 0.781 1.268 0.114 112
0.559 0.799 1.271 0.114 112
0.581 0.804 1.713 0.114 112
0.553 0.785 1.277 0.114 112
Note: P-values are presented in parentheses. ***, **, * indicate significance at the 1%, 5%, and 10% levels, respectively.
out that for each group of countries, the importance of determinants differ con- firming the assumption that the criteria and selection process of the investors dif- fer based on economic, political and behavioural factors. There is no consensus in a final investment model since the conditions and the motivations can change based on specific investment opportunity. When comparing the estimations for all three groups of countries, it is apparent that the role of institutions lacks cred- ibility especially in the transitional economies from the central and the SEE countries. Meanwhile, the various stages of economic development have been reflected in country groupings and estimation results. Also, as can be observed, our model set-up works best with the SEE countries where the combination of macroeconomic drivers and institutional framework appears to play the most prominent role. One of the reasons behind this observation could be the presence of inertia in other regions, larger accumulated base of FDI which needs to be reproduced via reinvestment, and also stronger autonomous or semi-autonomous demand in these regions.
Table 6. GMM estimation: FDI inflows to SEE region using Heritage Foundation indices Model
1-SYS-GMM
Model 2-SYS-GMM
Model 3-SYS-GMM
Model 4-SYS-GMM D_LOG_FDI_TO(1)
CONST
D_LOG_GDP
0.269***
(0.000) 0.042***
(0.000) 1.299***
(0.000)
0.260***
(0.000) 0.042***
(0.000) 1.286***
(0.000)
0.257***
(0.000) 0.040***
(0.000) 1.378***
(0.000)
0.283***
(0.000) 0.040***
(0.000) 1.300***
(0.000)
D_TELEC 0.004***
(0.006) 0.004***
(0.004) 0.004***
(0.002) 0.004***
(0.009) D_TAX
D_LOG_POP
–0.0041 (0.206)
0.953 (0.490)
–0.004 (0.237)
0.864 (0.537)
–0.003 (0.494)
1.419 (0.340)
–0.004 (0.213)
1.064 (0.437)
D_CORR_1 0.001
(0.598)
D_FISC_1 0.002
(0.130)
D_BUSINESS_1 0.004**
(0.021)
D_INVEST 0.001***
(0.000) Test for AR(1)
Test for AR(2) Sargan test Wald test
0.010 0.047 0.001 0.000
0.008 0.055 0.005 0.000
0.010 0.026 0.001 0.000
0.000 0.052 0.004 0.000 Note: P-values are presented in parentheses. ***, **, * indicate significance at the 1%, 5%, and 10% levels, respectively.
In general, the results broadly confirm our first hypothesis regarding macr- oeconomic stability, yet only partially support the second one. One of the find- ings from the results suggests that the selected groups of countries differ quite substantively in their sensitivity to institutional framework outlined by the article, with the algorithm being that those more developed are less sensitive. This is likely due to investors’ perception of institutional inertia, supported by long in- stitutional history, membership in different international organizations, including the EU, and longer history of settlement of litigations and FDI protection, leading to its higher transparency and better visibility. Another possible reason is a clear prevalence of favourable static macroeconomic conditions, including purchasing power of the local populations, and more predictable economic conditions in the future. Finally, since our model specification in all presented set-ups highlights the evolution of institutional framework in time rather than its current state, this can also somewhat weigh on the results for the WE countries.
Likewise, the results exhibit some similarities with Bloningen – Piger (2011) who analysed determinants that are most likely to influence the FDI dynamics.
They categorise institutional variables as determinants only with little impact on FDI activity, while output, labour endowments and trade agreements have a higher likelihood of being included in a correct FDI model specification. As opposed to them, the presented article is more resistant to a potential critique of mis-measuring institutions as such, leading to wrong conclusions, as it uses the well-elaborated Heritage Foundation metrics and sufficiently robust model specification. Nevertheless, it is conventionally understood that definition and quantification of institutional framework is always somewhat subjective and can be at least partially disputed.
5. CONCLUSION
Our research is based on a comparative approach of constructed FDI stocks in three groups of selected European countries. The novelty of our analysis resides in the formulation of a model based on a selected group of macroeconomic fac- tors blended with institutional indicators and estimated using two sets of empiri- cal techniques to determine the behavioural patterns of FDI. We tested the extent to which foreign firms’ decisions to invest in a region depends on the region’s institutional setup. Specifically, in order to capture a full business cycle, we fo- cused on a timeframe from 2000 to 2015 which we consider as a “stabilisation period” following the tumultuous and, econometrically speaking, noisier years of the early 1990s and investigate whether institutional determinants still matter for investors in the FDI attraction process. The estimates for fixed and random ef-