DETERMINANTS AND IMPLICATIONS OF THE EUROZONE ENLARGEMENT
Grzegorz W. KOLODKO – Marta POSTULA
(Received: 27 April 2018; revision received:10 June 2018;
accepted:3 July 2018)
To join the Eurozone (EZ), a candidate country has to fulfi l fi ve nominal Maastricht convergence criteria and ensure compliance of national legislation with the acquis communautaire. With this regard special diffi culties pose the fi scal criterion relating to the maximum allowed budget defi cit of 3 per cent of GDP. If it is not met, the European Commission launches the Excessive Defi cit Procedure. Currently, such formula applies to France, Spain and the United Kingdom. Although the issue is not absolutely certain, one can assume that euro will weather the present diffi culties and will come out stronger, though the economically unjustifi ed Euro scepticism of some countries is not helping. It may be expected that in the 2020s the European Monetary Union will be joined by all countries that are still using their national currencies and that the EU will be extended to include new member states, enlarging the euro area further. In this article authors are discussing the issue whether Poland will join the EZ in the coming years, considering the challenges of meeting all Maastricht criteria, on the one hand, and the reluctance of the government to give up the national currency, on the other. A mixed method combining the results of qualitative and quantitative re- search has been used to empirically verify the research question presented.
Keywords: integration, euro convergence, Maastricht criteria, excessive defi cit procedure, public debt
JEL classifi cation indices: E44, E63, F02, F45, G01, G18, P34, P52
Grzegorz W. Kolodko, corresponding author. Director of Transformation, Integration and Global- ization Economic Research (TIGER), Kozminski University, Warsaw, Poland.
E-mail: kolodko@tiger.edu.pl
Marta Postula, Associate Professor and Chair of the Center of Entrepreneurship at the Faculty of Management, Warsaw University, Poland. E-mail: mpostula@wz.uw.edu.pl
1. INTRODUCTION
The issue of the euro is not just an internal affair of the Euroland or, more broadly speaking, of the European Union (EU) as a whole, but also an international or even a global problem, because it is the currency in which ca. 20% of all foreign exchange reserves are held. Globally, it is the second reserve currency after the US dollar (ca. 63.5%). According to the International Monetary Fund’s data, total reserves amount to ca. USD 11.3 trillion1, of which we know the currency com- position for the equivalent is of 9.65 trillion. These are the so-called allocated reserves, and the rest, 1.65 trillion, are unallocated reserves.2
It is understandable that in the foreseeable future, despite all the troubles it got itself into (Prasad 2014), the dollar will keep playing the leading role in global economic relations, not only as reserve money but also as the principal means of payment in international transactions and the major measure of value of goods in the global market. However, with time it will have to give some ground to other currencies, including the Chinese renminbi (Kolodko 2018). As regards the euro, though only one fifth of those reserves are kept in it, surely its fate will have a more-than-proportionate impact on the global economy’s stability, despite the fact that the euro’s share of all countries’ aggregate reserves has declined by over seven percentage points since 2009.3
This downward trend can be expected to reverse, though it depends on a number of factors, especially those related to economy but also to politics. It is beyond any doubt, however, that both the overall condition of the EU’s single currency area and the euro’s international status as one of the world’s reserve cur- rencies will be significantly affected by the changes in the methods of Eurozone (EZ) regulation and supervision as well as by the enlarging area of its circulation.
This process also has its complex political, social, economic and technical deter- minants. The most difficult problems, hence the most important ones, are those involved in fiscal determinants of convergence with the EZ of the economies that are now outside the single currency area.
1 As of the end of the 3rd quarter of 2017 (exclusive of monetary gold).
2 Slightly over 4.5% of the former are denominated in the Japanese yen, 4.5% in British pound sterling, 2% in Canadian dollar, 1.1% in Chinese renminbi, and only 0.16% in Swiss franc.
The remaining 2.4% are reserves in other currencies, e.g. Australian, New Zealand, Singapo- rean and Hong Kong dollars, Korean won, South African rand and Saudi riyal.
3 In 2009, euro represented 27.7% of global reserves, and USD 62.0% (IMF 2014, Appendix I, International Reserves: 2).
2. CURRENCY CONVERGENCE CRITERIA
The euro is in circulation in 19 out of 28 EU member states. In 11 of them – in Austria, Belgium, Finland, France, Germany, Ireland, Italy, Luxemburg, the Netherlands, Portugal, and Spain – it has been so since the clearing system was established in 1999 and was put in circulation in 2002, and since 2003 – with huge problems until today (Galbraith 2016; Kolodko 2016) – in Greece. Then, in 2008, the area was joined by two Mediterranean countries, Cyprus and Malta, and five post-socialist countries, in the following order: Slovenia in 2007, Slovakia in 2009, Estonia in 2011, Latvia in 2014 and Lithuania in 2015. The euro is also in circulation, pursuant to the agreements signed, in four tiny European states: in Andorra, Monaco, San Marino and Vatican, and de facto also in Liechtenstein, a fifth one from this category, where it functions side by side with the official Swiss franc, and based on its unilateral introduction, in Montenegro and Kosovo.
Out of 9 EU member states that are still outside the euro area, only two of them, Denmark and the United Kingdom, pursuant to the Maastricht treaty opt- out clause (1993), are not obliged to join the monetary union (MU). All the other countries, including Sweden, an EU member state since 1995, and five post-so- cialist countries – Bulgaria, Czech Republic, Hungary, Poland and Romania – have the right and the duty to join the MU pursuant to their membership treaties.
In line with the treaty, one can expect all of them – of course except the United Kingdom which is leaving the European Union – to join the EZ, though there is no telling when that will happen and in what order. One can also conjecture that with the further enlargement of the MU and the resulting accession of subsequent post- socialist economies – Bulgaria and Romania most probably being the first ones – and especially if the problems besetting the Euroland are effectively solved, also Denmark will adjust its strategy and may give up on its own currency.
The economic integration processes as part of the EU are regulated by a legal framework, whose main element is the Treaty on the Functioning of the Euro- pean Union (TFEU)4. In accordance with the treaty provisions, the EU member states pursue their own economic policy, but, at the same time, some coordination measures are undertaken at the supranational level. TFEU lays down the basic policy-making methods and principles for the single economic policy (Postula 2015). These issues are dealt with in Chapter 1 “Economic Policy” of Title VIII
“Economic and Monetary Policy”. The key provisions of this chapter are pro- vided in Article 121, which speaks of multilateral surveillance and coordination of economic policies, and Article 126 about avoiding excessive budget deficit. It
4 The consolidated version of the “Treaty on the Functioning of the European Union” can be found in Official Journal of the European Union, C 83/01 of 30.03.2010.
stipulates the form of corrective actions against countries which have too high public debt or excessive public finance sector deficit. In accordance with Article 140 of TFEU, the European Commission (EC) and the European Central Bank (ECB) are obliged to make reports, in every two years, on the progress made by the member states not meeting the requirements to adopt the euro in fulfilling their obligations regarding the economic achievements and the MU. These are so-called member states with derogation (Article 139 of TFEU).
The monetary convergence is contingent on meeting five well-known nominal financial criteria pertaining to inflation, interest rate, budget deficit, public debt and the exchange rate.
Although the common European currency exists already for almost 20 years, it is no surprise that the controversies about this bold project still continue. The furthest going scepticism dares to refer to this endeavour – or a particular issue, as the upper limit of acceptable fiscal deficit not exceeding a threshold of 3 per cent of a country’s GDP – as something nonsensical (Pasinetti 1998; de Grauve 2010; Stiglitz 2018). Yet far from perfect, the supporting of economic and politi- cal integration by applying the common currency does make sense.
An economy aspiring to join the EZ should have a floating exchange rate mechanism in place and for two years leading up to the conversion, it should be a member of the European exchange rate mechanism, ERM-2. In this period, the exchange rate of the domestic currency against the euro may, generally speak- ing, deviate from the central parity negotiated between the candidate state, the ECB and the EC in minus or in plus by 15%.5 In practice, when enforcing the exchange rate stability criterion, a more narrow and asymmetric margin from +15% to –2.25% is in effect. However, it is not always the case. In particular, two departures from that rule have been applied in current practices: pegged exchange rate or revaluation.
With respect to the Baltic states – Estonia, Latvia and then Lithuania – the use of a pegged exchange rate or currency board arrangement was accepted instead of a two-year participation in ERM-2 with a floating but stable exchange rate.
For Lithuania, a country which was the last of the current member states to join the EZ, a wide range of +/– 15% deviations was formally applicable throughout the entire period of participation in ERM-2, for ten years, from mid-2004 until entering the EZ in 2015. Without major tensions, Lithuania maintained, in the two-year reference period, a pegged exchange rate against the euro as used previ- ously as part of the currency board arrangement and it was at this exchange rate of 3.4528 lits per euro that the national currency was finally converted to the euro.
5 When the Treaty of Maastricht was being adopted, this range was only +/– 2.25%. In 1993, it was widened to +/– 15%.
In the reference period, devaluation is prohibited, but revaluation is accept- able. That was the case of first Greece and then Slovakia. It was similar with Ire- land, which has been a member of the EZ since its creation. Over there, with work productivity growing faster than elsewhere, Irish pound followed a strengthen- ing trend. This type of appreciation pressure, contrary to short-term currency strengthening due to speculation, promotes economic equilibrium and is con- sidered “healthy”. The Irish pound in the period leading up to the conversion to the euro stood, on average, 4.6% higher than the central rate, with the maximum deviation approaching 11% (Schadler 2005).6
To join the European MU, one must meet all the criteria in a durable and sus- tainable manner. They are of importance to the functioning of the single monetary area as they concern achieving and maintaining a high level of price stability, stable exchange rate, convergence of long-term interest rates and a stable overall situation of public finance. There is also a sixth criterion, which requires national legislation on monetary and fiscal matters to be compatible with the EC law.
More detailed treaty provisions as regards the coordination of economic poli- cies of the EU member states were formulated in the Stability and Growth Pact (SGP) passed in 1997, composed of a relevant resolution7 and two regulations of the European Council8, pursuant to which the EU member states are obliged to have a sound public finance and meet both fiscal criteria. From the perspective of budgetary policy, the fiscal criterion referred to as the avoidance of excessive deficit is of key importance. SGP, expanding on the treaty provisions regarding the avoidance of excessive deficit, introduced the duty to prepare a medium-term convergence and stability plan indicating the medium-term budgetary target9. Every year in April, the EZ member states submit their stability programs with the EC and the European Council, and non-member states submit their conver- gence programs. These programs must contain relevant information on the state’s medium-term budgetary target and explanation of the intended way to achieve it (Postula 2012). Moreover, the states must present an analysis and evaluation of the results of economic changes affecting the state’s fiscal position.
6 Poland has had a floating exchange rate mechanism in place since 2000, but is not part of the ERM–2.
7 Resolution of the European Council (EC) of 17 June 1997 on the Growth and Stability Pact, Official Journal C 236 of 2.8.1997, p. 1.
8 Council Regulation (EC) no. 1466/97/EC of 7 July 1997 on the strengthening of the surveil- lance of budgetary positions and the surveillance and coordination of economic policies, Of- ficial Journal L 209 of 2.8.1997, p. 1 and Council Regulation (EC) no. 1467/97 of 7 July 1997 on speeding up and clarifying the implementation of the excessive deficit procedure, Official Journal L 209 of 2.8.1997, p. 6.
9 Declaration of 16 December 1996 and European Council Regulations of 16 June 1997.
3. EXCESSIVE DEFICIT PROCEDURE
The implementation of both stability and convergence programs is monitored by the EC. Based on its recommendations, the European Council launches the exces- sive deficit procedure (EDP), if the criteria are not met. The procedure imposes a duty on the state to present the planned corrective actions to improve the condi- tion of public finance. If none are implemented or those in place are inadequate, various kinds of sanctions may be imposed. These refer to the EZ member states to a greater extent, but there are also possibilities to apply them to the EU member states that are still outside the single currency area.
The insufficient effectiveness of SGP made it necessary to significantly modify it (Schick 2010; Schaechter et al. 2012). The so-called six-pack was used to that end10, which was aimed to ensure more effective budgetary and public debt con- trol. The legislative changes to the principles of fiscal policy that were introduced as a part of it (Marneffe et al. 2011) were confirmed and specified in the Treaty on Stability, Coordination and Governance in the Economic and MU (known as the fiscal compact). In particular:
The existing fiscal criterion regarding the deficit limit and public debt limit was developed (3% of GDP and 60% of GDP, respectively).
A duty was introduced to reduce public debt at an average rate of one twen- tieth per year of its excess over the limit.
Structural deficit should be reduced by 0.5% of GDP until the medium-term budgetary target is achieved.
Costs of pension reforms can be deducted from the deficit.
10 The adopted legislative acts came into effect on 13 December 2011. These were four joint regulations of the European Parliament and of the Council, one Council regulation and one Council directive, i.e. a non-legislative act:
– Regulation (EU) of the European Parliament and of the Council No. 1173/2011 of 16 No- vember 2011 on the effective enforcement of budgetary surveillance in the euro area, – Regulation (EU) of the European Parliament and of the Council No. 1174/2011 of 16 No-
vember 2011 on the enforcement measures to correct excessive macroeconomic imbalances in the euro area,
– Regulation (EU) of the European Parliament and of the Council No. 1175/2011 of 16 Novem- ber 2011 amending Council Regulation (EC) No. 1466/97 on the strengthening of the surveil- lance of budgetary positions and the surveillance and coordination of economic policies, – Regulation (EU) of the European Parliament and of the Council No. 1176/2011 of 16 No-
vember 2011 on the prevention and correction of macroeconomic imbalances,
– Council Regulation (EU) No. 1177/2011 of 8 November 2011 amending Regulation (EC) No 1467/97 on speeding up and clarifying the implementation of the excessive deficit pro- cedure,
– Council Directive 2011/85/EU of 8 November 2011 on requirements for budgetary frame- works of the Member States.
Moreover, it was recommended that a fiscal rule should be introduced in re- spective member states’ national law, enforcing sustainability of the structural balance of the general government sector (achievement of the medium-term budget target).
Without getting into a detailed discussion, one can formulate a view that most member states did not have an economic policy in place that would take full ac- count of the idea of SGP, so no wonder its goals were not achieved, either. As a result, the condition of public finance in most EU member states was deemed insufficiently stable.
Irrespective of any regulatory specifications introduced at the EU level as part of the modified SGP, the principal parameters subject to fiscal evaluation are still the public sector deficit and debt. In the years from 2005 to 2016, the ratio of gen- eral government deficit to GDP stood at levels that made it necessary to initiate excessive deficit procedure for most countries.
In 2016–2017, the fiscal situation was relatively good. Following the favoura- ble economic situation in 2016, public finance was balanced in two countries and in as many as 9 countries there was a budgetary surplus. It was similar in 2017.
Table 1. General government deficit/surplus in EU countries, 2005–2016 (% of GDP)
Country 2005 2006 2007 2008 2009 2010 2011 2012 2013 2014 2015 2016 Austria –2.5 –2.5 –1.4 –1.5 –5.3 –4.4 –2.6 –2.2 –2.0 –2.7 –1.0 –1.6 Belgium –2.8 0.2 0.1 –1.1 –5.4 –4.0 –4.1 –4.2 –3.1 –3.1 –2.5 –2.5 Bulgaria 1.0 1.8 1.1 1.6 –4.1 –3.1 –2.0 –0.3 –0.4 –5.5 –1.6 0.0 Croatia –3.9 –3.4 –2.4 –2.8 –6.0 –6.5 –7.8 –5.2 –5.3 –5.1 –3.3 –0.9 Czech Republic –3.0 –2.2 –0.7 –2.0 –5.5 –4.2 –2.7 –3.9 –1.2 –1.9 –0.6 0.7 Cyprus –2.2 –1.0 3.2 0.9 –5.4 –4.7 –5.7 –5.6 –5.1 –8.8 –1.2 0.5 Denmark 5.0 5.0 5.0 3.2 –2.8 –2.7 –2.1 –3.5 –1.2 1.1 –1.8 –0.6 Estonia 1.1 2.9 2.7 –2.7 –2.2 0.2 1.2 –0.3 –0.2 0.7 0.1 –0.3 Finland 2.6 3.9 5.1 4.2 –2.5 –2.6 –1.0 –2.2 –2.6 –3.2 –2.7 –1.7 France –3.2 –2.3 –2.5 –3.2 –7.2 –6.8 –5.1 –4.8 –4.1 –3.9 –3.6 –3.4 Germany –3.4 –1.7 0.2 –0.2 –3.2 –4.2 –1.0 0.0 –0.1 0.3 0.6 0.8 Greece –6.2 –5.9 –6.7 –10.2 –15.1 –11.2 –10.3 –8.9 –13.2 –3.6 –5.7 0.5 Hungary –7.8 –9.3 –5.0 –3.7 –4.5 –4.5 –5.4 –2.4 –2.6 –2.7 –2.0 –1.9 Ireland 1.6 2.8 0.3 –7.0 –13.8 –32.1 –12.7 –8.0 –6.1 –3.6 –1.9 –0.7 Italy –4.2 –3.6 –1.5 –2.7 –5.3 –4.2 –3.7 –2.9 –2.9 –3.0 –2.6 –2.5 Latvia –0.4 –0.5 –0.5 –4.2 –9.1 –8.7 –4.3 –1.2 –1.0 –1.2 –1.2 0.0 Lithuania –0.3 –0.3 –0.8 –3.1 –9.1 –6.9 –8.9 –3.1 –2.6 –0.6 –0.2 0.3 Luxembourg 0.1 1.9 4.2 3.3 –0.7 –0.7 0.5 0.3 1.0 1.3 1.4 1.6 Malta –2.6 –2.5 –2.1 –4.2 –3.2 –2.4 –2.4 –3.5 –2.4 –1.8 –1.1 1.1 Netherlands –0.3 0.2 0.2 0.2 –5.4 –5.0 –4.3 –3.9 –2.4 –2.3 –2.1 0.4 Poland –4.0 –3.6 –1.9 –3.6 –7.3 –7.3 –4.8 –3.7 –4.1 –3.6 –2.6 –2.5 Portugal –6.2 –4.3 –3.0 –3.8 –9.8 –11.2 –7.4 –5.7 –4.8 –7.2 –4.4 –2.0
Currently, the excessive deficit procedure is imposed on three member states: on the UK since 2008, and on France and Spain since 2009. Only in two countries, Estonia and Sweden, it has never been applied to date and in all the others it was periodically imposed by the Commission and lifted upon implementing relevant corrective actions.
After many years of financing budget deficits, non-compliance with the sec- ond fiscal criterion has been frequent. In the non-EZ economies, it has been the case also due to the decline in the value of national currency in the countries where the public debt consisted partly of debt in a foreign exchange that was gaining strength at the time. In the period of 2005–2016, out of 28 member states 11 complied with this criterion. It must be emphasized that as many as 8 of those countries are post-socialist economies: Estonia, Latvia, Lithuania and Slovakia, which are the EZ member states, and Bulgaria, Czech Republic, Poland and Ro- mania, which are still outside the EZ. In 2016, in as many as 17 countries pub- lic debt (calculated according to ESA, General Government Gross Debt) stood above 60% of GDP. Record-breakers in this respect are Greece and Italy, where this index exceeds the acceptable limit respectively three times and more than twice. In 2017, the situation was similar, though these two countries got closer to the debt limit, recording a slight budget deficit. In Finland, with 2016 public debt amounting to 63.1% of GDP, the deficit stood at 1.7%, while the Netherlands, with the debt of 61.8%, recorded a surplus of 0.4% of GDP. Against this back- drop, one can conclude that in 2018 the country may successfully go below the Maastricht threshold.
It is worth emphasizing that in some economies, for example Greece and Italy, the fiscal criterion relating to the acceptable debt was not met already at the time the euro came into being. Such tolerance for noncompliance with its own inten- tionally hard rules right from the inception of the single currency is one of the orig- inal causes of the difficulties faced by the EZ at a later time. This makes itself felt now, as well, and will represent a major burden also in the future. One can double the public debt very fast while it’s very hard and time consuming to halve it.
Table 1 continued
Country 2005 2006 2007 2008 2009 2010 2011 2012 2013 2014 2015 2016 Romania –0.8 –2.1 –2.8 –5.5 –9.5 –6.9 –5.4 –3.7 –2.1 –1.4 –0.8 –3.0 Slovakia –2.9 –3.6 –1.9 –2.4 –7.8 –7.5 –4.3 –4.3 –2.7 –2.7 –2.7 –2.2 Slovenia –1.3 –1.2 –0.1 –1.4 –5.8 –5.6 –6.7 –4.0 –14.7 –5.3 –2.9 –1.9 Spain 1.2 2.2 1.9 –4.4 –11.0 –9.4 –9.6 –10.5 –7.0 –6.0 –5.3 –4.5
Sweden 1.8 2.2 3.4 1.9 –0.7 0.0 –0.2 –1.0 –1.4 –1.6 0.2 1.1
United Kingdom –3.2 –2.8 –2.6 –5.2 –10.1 –9.4 –7.5 –8.2 –5.4 –5.5 –4.3 –2.9 Source: Eurostat.
4. FISCAL CRITERIA AND THE POLISH QUESTION
For Poland in the years during 2004–2017, the public sector debt did not exceed the reference value of 60% of GDP. The inflation criterion, i.e. keeping the rate of inflation under control at a level no more than 1.5 percentage points higher than the average for three EU member states with the most stable prices, was com- plied with by Poland in periods of several and over a dozen months ever since it became a member of the EU and is complied with now. Equally irregular was the country’s compliance with the interest rate criterion but currently this criterion is also met. When assessing the stability of prices and interest rates it is worth
Table 2. Public debt in EU countries, 2005–2016 (% of GDP)
Country 2005 2006 2007 2008 2009 2010 2011 2012 2013 2014 2015 2016 European Union 61.5 60.1 57.5 60.7 72.7 78.3 81.0 83.7 85.6 86.5 84.5 83.2 Euro area 69.2 67.3 64.9 68.6 78.4 83.8 86.1 89.4 91.3 91.8 89.9 88.9 Austria 68.3 67.0 64.7 68.4 79.6 82.4 82.2 81.7 81.0 83.8 84.3 83.6 Belgium 94.7 91.1 87.0 92.5 99.5 99.7 102.6 104.3 105.5 106.8 106.0 105.7 Bulgaria 26.8 21.0 16.3 13.0 13.7 15.3 15.2 16.7 17.0 27.0 26.0 29.0 Croatia 41.3 38.9 37.7 39.6 49.0 58.2 65.0 70.6 81.7 85.8 85.4 82.9 Czech Republic 27.9 27.7 27.5 28.3 33.6 37.4 39.8 44.5 44.9 42.2 40.0 36.8 Cyprus 62.8 58.7 53.5 45.1 53.8 56.3 65.7 79.7 102.6 107.5 107.5 107.1 Denmark 37.4 31.5 27.3 33.3 40.2 42.6 46.1 44.9 44.0 44.0 39.5 37.7
Estonia 4.5 4.4 3.7 4.5 7.0 6.6 6.1 9.7 10.2 10.7 10.0 9.4
Finland 40.0 38.2 34.0 32.7 41.7 47.1 48.5 53.9 56.5 60.2 63.6 63.1 France 67.1 64.4 64.3 68.0 78.9 81.6 85.2 89.6 92.4 95.0 95.8 96.5 Germany 67.0 66.5 63.7 65.1 72.6 80.9 78.6 79.8 77.4 74.6 70.9 68.1 Greece 107.4 103.6 103.1 109.4 126.7 146.2 172.1 159.6 177.4 179 176.8 180.8 Hungary 60.0 64.1 65.0 71.0 77.2 79.7 79.9 77.6 76.0 75.2 74.7 73.9 Italy 101.9 102.6 99.8 102.4 112.5 115.4 116.5 123.4 129 131.8 131.5 132 Ireland 26.1 23.6 23.9 42.4 61.5 86.1 110.3 119.6 119.4 104.5 76.9 72.8 Latvia 11.4 9.6 8.0 18.2 35.8 46.8 42.7 41.2 39.0 40.9 36.9 40.6 Lithuania 17.6 17.2 15.9 14.6 28.0 36.2 37.2 39.8 38.8 40.5 42.6 40.1 Luxembourg 7.4 7.8 7.7 14.9 15.7 19.8 18.7 22.0 23.7 22.7 22.0 20.8 Malta 70.0 64.5 62.3 62.6 67.6 67.5 70.1 67.8 68.4 63.8 60.3 57.6 Netherlands 49.2 44.7 42.7 54.7 56.8 59.3 61.6 66.3 67.8 68.0 64.6 61.8 Poland 46.4 46.9 44.2 46.3 49.4 53.1 54.1 53.7 55.7 50.2 51.1 54.1 Portugal 67.4 69.2 68.4 71.7 83.6 96.2 111.4 126.2 129 130.6 128.8 130.1 Romania 15.7 12.3 12.7 13.2 23.2 30.2 34.4 37.3 37.8 39.4 37.9 37.6 Slovakia 34.1 31.0 30.1 28.5 36.3 41.2 43.7 52.2 54.7 53.5 52.3 51.8 Slovenia 26.3 26.0 22.8 21.8 34.6 38.4 46.6 53.8 70.4 80.3 82.6 78.5 Spain 42.3 38.9 35.6 39.5 52.8 60.1 69.5 85.7 95.5 100.4 99.4 99.0 Sweden 49.2 44.0 39.3 37.8 41.4 38.6 37.9 38.1 40.8 45.5 44.2 42.2 United Kingdom 39.9 40.8 41.9 49.9 64.1 75.6 81.3 84.5 85.6 87.4 88.2 88.3 Source: Eurostat.
noticing the variability of the reference value, namely lack of specifically defined level of inflation. Meanwhile, with respect to the second fiscal criterion regarding the budgetary balance, the situation was worse. Except for 2007, until 2014 the public sector deficit exceeded 3% of GDP, hence corrective actions in the form of EDP were implemented twice. The first decision to apply it was made in 2004, though the European Council formally adopted it in 2005 (2005/183/EC), when Polish authorities were required to take the necessary corrective actions to reduce the deficit by 2007.
It is interesting that on 8 July 2008, the European Council abrogated the deci- sion taken three years earlier on the existence of an excessive deficit in Poland (2008/622/EC), even though it quickly turned out that, in the end, the budget deficit to GDP stood at 3.6% that year. On the one hand, the evaluators were impressed by the exceptionally low deficit in the previous year, as in 2007 it stood at only 1.9% of GDP; and on the other hand, 2008 marked the beginning of the global economic crisis, which resulted, also in Poland, in a higher-than- average dynamics of expenditure at the end of the year. Let us add that there is no quarterly reporting of the sector deficit as per European System of National and Regional Accounts (ESA), so the data on the condition of public finance is always available with a certain delay.
In 2009, the deficit was growing fast until it doubled, which stemmed mostly from the reduced revenues, with greater part of the deficit generated outside the state budget, in the insurance subsector and by local authorities (local govern- ments). Consequently, in the middle of the year, the Council adopted decision 2009/589/EC (1), where it declared again the existence of an excessive deficit and required its reduction until 2012.
In mid-2013, the European Council concluded that Poland had taken effec- tive actions but after adopting the original recommendation, adverse economic events took place, which had serious negative impact on public finance. These events were related to subsequent waves of global economic crisis reaching also Poland, which could not be without consequences for budgetary revenues and expenditures.
In the convergence program submitted by the government on 30 April 2015, it was assumed that the target deficit values would amount to 2.7% of GDP in 2015 and to 2.3 in 2016. Meanwhile, the EC’s spring 2015 forecast provided for a deficit of 2.8% of GDP in 2015 and 2.6% in 2016. Based on those data, in July 2015 the European Council adopted a decision to abrogate another decision on the existence of excessive deficit.
The size and structure of the excessive general government deficit recorded in Poland were quite varied. On the one hand, in the years from 2004 to 2008, the economic upturn was not sufficiently leveraged to limit the deficit; and on the
other hand, there were structural reasons for it becoming excessive. In the period under discussion, one can observe diverse ways the budget policy addressed the changing external and internal circumstances. The main measures in the area of structural challenges involved the commitment and use of ever increasing EU funds and a systematic though dynamic enough tax streamlining process. In 2009, the social security premium reductions came into force, decreasing the size of the tax wedge and thus the cost of labour. Next, in 2012, a long-term process of extending and equalizing the retirement age was started, which was unfortunately reversed in 2017. Fiscal consolidation has been in place since 2011, involving an increase of some tax rates (VAT, excise duty, personal income tax freeze), as well as limiting part of the pension rate allotted to Open Pension Funds (OFE). The measures intended to streamline public expenditures have also been relatively effective. The changes in the public sector operating system (the new public fi- nance law of 2009) have contributed to an improved quality of public finance.
The convergence program update sent by the Polish government to the EC in April 2017, provided for further reduction of the public sector deficit and of the public debt to GDP ratio.
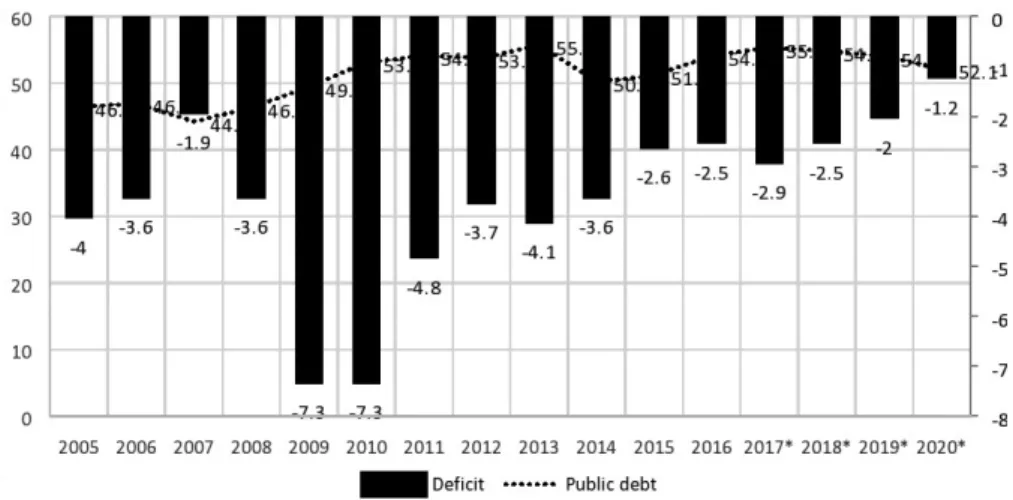
In accordance with the government’s assumptions, the public sector deficit should be reduced to 1.2% of GDP in 2020. This is to be possible due to the sys- tematic decline in the share of expenditures and taxes in GDP.
According to the government’s assumptions, the result of local government sector should be balanced as well.
Figure 1. Budget deficit and public debt, 2005–2020 ( % of GDP) Source: Eurostat data and Convergence Program 2017 Update.
* Forecast.
If we were to trust those assumptions to come true, Poland would undoubtedly not be in danger of having the excessive deficit procedure imposed on it again, and on the contrary: Poland could be an example for others to follow as a coun- try with one of the lowest public sector deficits among the EU member states.
However, we should ask ourselves how feasible the scenario presented in the convergence program update is.
Figure 2. Revenues and expenditures of the public finance sector, 2005–2020 (% of GDP)
Source: Eurostat data and Convergence Program 2017 Update.
* Forecast.
Figure 3. Forecast of the sectors of public finance, 2017–2020 (% of GDP)
Source: Convergence Program 2017 Update.
5. FORECASTS, WARNINGS AND PROPOSALS
The Polish government, when forecasting the macroeconomic developments in the
‘Convergence Program 2017 Update’ until 2020, assumed that the economy would grow twice as fast as the EU as a whole. Thus the gap between Poland and the rich Western countries will be narrowing, with a growing share of Polish production in the gross product of the whole grouping. Currently, it stands at only 2.9% at zloty to euro market rate, while it is 5.3% at purchasing power parity (PPP). The latter measure is more adequate and reflects the actual situation better.
In 2017, GDP grew faster than announced by the government and then ex- pected by various organizations monitoring Polish economy: as much as ca. 4.3%
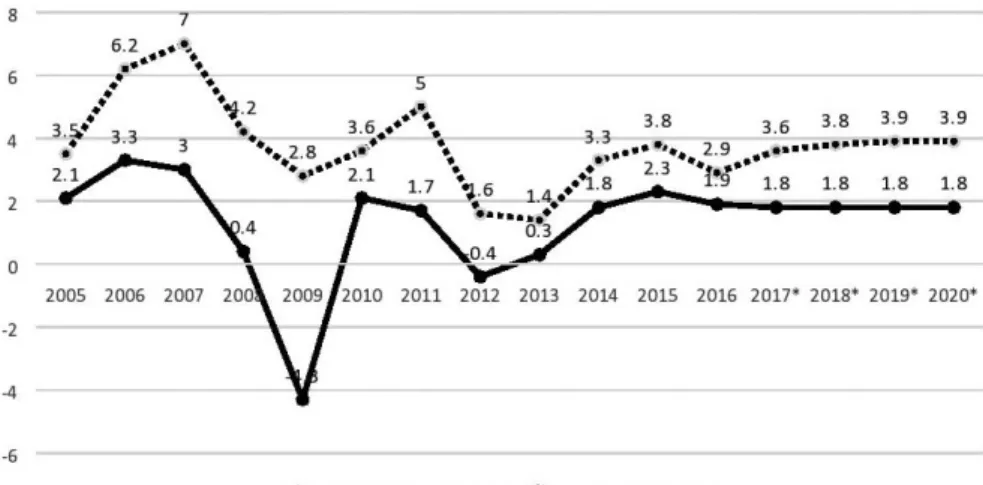
compared to just 3.6% growth provided for in the 2018 draft budget. Neverthe- less, the forecast for the gross product dynamics in the years from 2018 to 2020 were maintained. According to the ‘Convergence Program 2017 Update’, it should amount to 3.8, 3.9 and 3.9 per cent in the subsequent years, while according to the 2018 budget, 3.8% is expected in each of these years (and 3.6% in 2021).
The weakening of the production dynamics, though a minor one, implies a more modest tax base broadening than in 2017. Of course, ceteris paribus, so here we should leave aside the changes in the efficiency of the collection of re- ceivables as well as any changes in the amount of taxes and other forms of fiscal revenues. In this context, one needs to emphasize the risk of tensions related to the fast growing fixed budget expenditures. Many of them, mainly arising out
Figure 4. GDP growth, 2005–2020 (%) Source: Eurostat data and Convergence Program 2017 Update.
Note: * Forecast.
of a significantly widened scope of the state’s social policy, are already legally determined as a result of the adopted legislative solutions; others are possible and may become reality following the unambiguous political declarations of the ruling party, government and president. This is, unfortunately, the case of the an- nouncement on the yearly successive increase of defence spending from the cur- rent 2% of GDP to 2.5% in 2030. The question is how realistic the governmental and non-governmental budget deficit forecasts will prove in the end.
Table 4. Forecasts of the public finance sector balance, 2017–2020 (% of GDP)
Specification 2017 2018 2019 2020
EC –1.7 –1.7 –1.9
OECD –2.3 –2.3 –2.3
World Bank (General Government
Structural Balance) –3.0 –3.1 –3.1 –2.6
S&P –1.7 –2.0 –2.5 –2.5
Convergence Program 2017 Update –2.9 –2.5 –2.0 –1.2
Source: Own compilation based on data provided by particular entities.
It is interesting that the EC expected a much lower deficit in 2017 than the Polish government did, only 1.7% vs. 2.9%. Consequently, it is more optimistic as to the developments in 2018–2019, for which it also assumes lower deficits than those expected by the government: 1.7% and 1.9% respectively vs. 2.5%
and 2.0%.
Meanwhile, there is an optimistic concurrence of opinion between the gov- ernment and international organisations as to the relative size of public debt in the coming years11. Better yet: international organisations and rating agencies are
11 We are passing over some economists’ scare-mongering comments and alarmist warnings (publicized by some media) about the allegedly inevitable and fast approaching collapse of
Table 3. Forecasts for GDP growth in Poland, 2017–2020 (%)
Specification 2017 2018 2019 2020
EC 4.2 3.8 3.4
OECD 4.3 3.5 3.2
IMF 3.8 3.5 3.0 2.8
World Bank 4.5 4.0 3.5 3.1
Commerzbank 4.5 3.8 3.2
Fitch 4.4 3.6 3.2
Convergence Program 2017 Update 3.6 3.8 3.9 3.9
Source: Own compilation based on data provided by the particular entities.
even more optimistic than Polish authorities because while the latter forecast public debt to GDP ratio in 2020 at 54%, Standard & Poor’s, for example, sees it nearly four percentage points lower, at only 50.3% of GDP.
Table 5. Forecasts of public debt, 2017–2020 (% of GDP)
Specification 2017 2018 2019 2020
EC 53.2 53.0 53.0
OECD 53.9 53.9 53.7
IMF 54.2 53.8 53.5 52.9
S&P 49.5 48.7 50.3 50.3
Convergence Program 2017 Update 53.1 54.2 54.6 54.0
Source: Own compilation.
There is much greater disparity of opinion among experts, whether theoreti- cians of finance and economics from Poland and abroad or economic policy prac- titioners. We asked them for relevant forecasts, and the group of distinguished 30 respondents included former prime ministers, deputy prime ministers for eco- nomic affairs, ministers and deputy ministers of finance and economy, members of the Monetary Policy Council, current members of the European Parliament as well as members of public finance and budget committees at both houses of Polish parliament (Sejm and Senate), presidents of large commercial banks and experts of the World Bank and IMF; many of whom are professors.
Table 6. Experts’ forecasts of GDP growth, fiscal deficit and public debt, 2017–2020 Specification GDP growth (%) Budget deficit
(% of GDP) Public debt
(% of GDP)
Year 2017* 2018 2019 2020 2017* 2018 2019 2020 2017* 2018 2019 2020
Minimum 3.6 3.5 1.7 2.0 1.5 2.0 1.5 1.0 50.5 52.0 51.5 51.0
Average 4.0 3.9 3.5 3.2 2.5 2.7 2.8 2.8 54.3 54.4 54.6 54.7
Maximum 4.5 5.0 4.6 4.3 3.3 3.5 4.5 5.0 56.0 57.0 57.5 59.3
Standard
deviation 0.30 0.38 0.47 0.54 0.47 0.37 0.59 0.89 1.23 1.14 1.43 2.06 Variance 0.09 0.14 0.22 0.30 0.22 0.14 0.35 0.79 1.52 1.31 2.04 4.25 Source: Own calculations.
Note: * Expected implementation.
public finance, which, in the coming years, is sure to lead to exceeding the public debt limit of 60% of GDP. Such doom saying is far from being professional as it is politically and ideologi- cally rather than factually motivated.
Low values of standard deviations compared to the means suggest that the spread of experts’ responses around the mean is rather small. This suggests that our panel of 30 specialists was pretty consistent in their responses. One can notice that standard deviations have a tendency to increase across the years which would suggest that our experts are less certain as to their predictions when time horizon increases.
Extreme opinions as to the economic growth rate in the four-year period under discussion are 5.0% in 2018 and 2.0% two years later. Meanwhile, for one time sequence they are highest in 2020, amounting to 4.3% and 2.0%. As for the public debt to GDP ratio, extreme opinions refer to 2020, where the forecast levels range from 50.5% to 59.3%. In the entire time interval under analysis, nobody assumes exceeding the threshold of 60% of GDP.
As regards budget deficit, nobody predicts a surplus, which is understandable in Poland’s realities, with forecasts ranging between 1.0% and as much as 5.0%
of GDP in 2020. For 2018, three people expect the 3% limit to be exceeded, with three others thinking it might amount to exactly 3.0% of GDP. For 2019, there are 10 and 4 people respectively who believe so, and for 2020, 11 and 3.
In other words, only 10% of the respondents from this selected group expect the 3% deficit to be exceeded already in 2018, one third of them in 2019 and 36.7%
in 2020. To emphasize the significance of these figures, we can reverse the pres- entation of results and stress that up to two-thirds of the experienced specialists and responsible economic policymakers do not expect the budgetary Maastricht convergence criterion to be exceeded and hence do not expect the return of the excessive deficit procedure, at least until 2021.
It is more than interesting and quite fascinating that there should be such differ- ences among eminent economists and experienced economic policy practitioners of the highest level. A four-point discrepancy in the budget deficit estimate does not stem from applying fundamentally different prediction models, but from making quite different assumptions as to the scale of fiscalism and efficiency of the state collecting its receivables, on the one hand, and as to the dynamics of budgetary expenditures, on the other hand. As a matter of fact, in the forecast optimistically anticipating a deficit of only 1% of GDP (i.e. even more optimistically than the government) for 2020, its author assumes that the economy will grow by 3.5% in every year of the 2018–2020 period. Meanwhile, the sceptic expecting the deficit to be five times higher at the end of that period, as high as 5.0% of GDP, sees the production growth rate slowing down over that time from 3.9% to 2.2%. In total, with respect to real economy, this makes a 2.3 percentage points difference, over the whole four-year period, between those two forecasts (aggregate GDP growth by 15.2% and by 12.9% of GDP respectively), but also these are two qualitatively different perspectives on the fiscal consequences of the course of events.
Looking into the future in a responsible manner, one needs to be mindful not only of the danger of the debt growing higher than expected by the government due to fiscal deficit being much larger than forecast, but also due to the weaken- ing of the zloty. External debt accounts for one third of Poland’s public debt, hence its nominal value in national currency depends on the foreign exchange rate. When developing forecasts for the years from 2018 to 2021 and planning the 2018 budget, the government assumed that the average annual euro to zloty exchange rate would be stable and in each of those four years it would remain at the level from late 2017, i.e. 4.25. It surely will not happen, even though it is impossible to predict its development in this time horizon. Since there is a free floating currency regime, the exchange rate fluctuates according to the surges of the financial market. Interestingly enough, just in the first half of 2018 it is oscil- lated between 4 and 4.30 zlotys/€.
The Polish government, however, is very optimistic. After a sound economic growth in 2017, as well as the improvement of the state of public finances, the Convergence Program Update adopted at the end of April 2018 has been marked by a highly optimistic picture of the coming years, assuming further systematic decrease in the budget deficit as well as public debt.
Table 7. Government forecast of GDP growth, budget deficit and public debt, 2018–2021
Specification 2018 2019 2020 2021
GDP growth (%) 3,8 3,8 3,7 3,6
Budget deficit (% of GDP) 2,1 1,5 1,1 0,7
Public debt (% of GDP) 50,4 50,4 48,7 46,0
Source: Convergence Program 2018 update.
Reducing the deficit to just 0.7% of GDP in 2021 would be a significant achievement of macroeconomic policy and a reflection of further stabilisation of public finances; however, achieving this goal seems unlikely, given the prolifera- tion of new, additional budget transfers due to vast social policy expansion.
Against this backdrop, the budget policy should be very prudent in the com- ing years. As a top priority, one should show self-restraint in earmarking further expenditures as in the long term they should grow more slowly than revenues and both categories more slowly than the national income in order to gradually reduce the scale of fiscal redistribution. It is doubtful whether the scale of budgetary imbalance can be controlled and the deficit held in check solely through increas- ing the discipline of collecting budgetary receivables. It cannot be ruled out that with the growth of additional expenditures that have already been determined in political and legislative terms, it will be necessary to increase taxes.
However, the government may opt for another path. Since it decided, alas, not to introduce the euro in Poland for the time being, it can be tempted, even though it is obliged to maintain the budget deficit to GDP ratio as set out in the SGP, to exceed the 3% threshold again. Especially in that situation – of course assuming the deficits will not be too high – it could be quite confident that it will not hit the public debt barrier of 60% of GDP. Now, let’s remember that it is not only one of the nominal Maastricht convergence criteria, but there has also been, for twenty years, a relevant provision on that matter in the Constitution of the Republic of Poland. Its Article 216.5 stipulates that ‘It shall be neither permissible to contract loans nor provide guarantees and financial sureties which would engender a na- tional public debt exceeding three-fifths of the value of the annual gross domestic product’ (Konstytucja 1997). This principle means in practice that if the 60%
threshold is exceeded – for example as a result of external debt growing due to the weak zloty – the budget for the next year must be balanced. So far, luckily, this mechanism has not been activated and it would be good if it continued to function only as a warning and preventive instrument.
Considering all real, financial, as well as social determinants, politicians may decide that in the event of acute budget tensions accumulating, and in view of the inability to cut spending as an adjustment measure, combined with the natu- ral unwillingness to increase taxes, a deficit exceeding 3% of GDP is a reason- able choice. Then the excessive deficit procedure would be back, and experience shows (or some say so) that you can live with it, whether inside or outside the euro area. However, it is better to maintain the structural deficit, apart from the cyclical fluctuations, at the lowest possible level to control the state’s bor- rowing needs, and decrease the long term public debt, the burden of which is carried by the society – consumers and producers alike, both households and entrepreneurs .
Sadly, an additional factor has emerged for Poland, unprecedented in the his- tory of the EU. The EC triggered the procedure under Article 7.1 of the EU Treaty in connection with Poland’s alleged breach of the rule of law. According to the Commission, Poland, though now it meets the nominal convergence criteria, does not meet the criteria of membership in the EU as such, as it is in breach not only of some principles and values underlying the integration grouping, but also of its own law, including the constitution. This complicates the situation despite the country’s relatively good economic position. This way a sort of seventh con- vergence criterion has appeared, but in essence the matter boils down to what’s required in criterion sixth, or the compatibility of national legislation with EU regulations codified in the acquis communautaire. It needs to be sorted out.
6. CONCLUSIONS
It is beyond any doubt that the euro single currency area does not represent an optimal currency area the way this issue is presented in the economy theory (McKinnon 2002). It is more interesting to note that the co-author of this concept (Mundell 1961) supported the creation of the EZ at that time (Mundell 2000).
A lot of misunderstandings in the assessment of the euro area functioning, and of the whole single currency project as a factor that cements the integration process stem from confusing the causes of disturbances and crisis phenomena with their manifestations and consequences (Tanzi 2013; Hall 2014). Obviously, there are some feedbacks but, after all, the euro was not the original cause of the finan- cial frictions; the cause was that the disturbances in real economy and in public finance spilled over into the monetary sphere. It was especially the insufficient supervision over the banking sector and capital market that had a negative impact on the condition of the euro (Sandbu 2015).
There are both voices predicting the demise of the euro (Brown 2012) or, in the extreme version, advocating its deliberate abolition (Kawalec – Pytlarczyk 2013), and academic papers (Pisani-Ferry 2011) and professional opinions (European 2017) pointing out directions for its improvement and ways to strengthen it. Oth- er authors, bearing in mind the euro’s imperfection, and also the immense costs of its potential abolition, though not ruling it out, are considering a fundamental institutional reform of the EZ (Moździerz 2015; Dallago 2016). We adopt a prag- matic economic approach, which is taking into account not only the theoretical arguments showing the systemic defects and structural weaknesses of the EZ, but most of all, the practical realities.
We are in the ex post phase; the euro has already been born, though it was con- ceived not without many sins, is alive; and it has already come of age. Therefore, today the right question is: is it more costly to keep and adequately reform the EZ or to dismantle it? Let us emphasise that such dismantling could be a controlled proc- ess only in theoretical digressions or in a computerized model; in practice it would quickly prove to be sheer chaos with disastrous consequences. Therefore when con- templating, in comprehensive terms, the costs and benefits of the euro’s continued existence and reforms versus withdrawing from it and its abolition, it is easy to see a clear advantage of the former solution. And that is why – rather than for political reasons and due to the power of inertia – the euro shall overcome. There is no abso- lute certainty about it but there is a very high likelihood: close to one.
The continuation of the euro project, obviously with its relevant modifications, has its implications and involves specific challenges. Of crucial importance here is the issue of enlarging the euro area by accepting the new states that meet all
the required currency convergence criteria. What speak in favour of joining the EZ are mostly economic reasons but the political ones should not be disregarded, either, in a situation where nationalist resentments and protectionist tendencies are gaining ground (Economist 2016). There is a ground – and the imperative – for both, parallel deepening the integration of the current, through strengthen- ing the relevant institutions and policies, and enlarging it by including the new members.
Replacing national currency with the euro – assuming that the conversion is carried out at the adequate dynamic equilibrium exchange rate – strengthens the economy’s competitiveness, eliminates the exchange risk and reduces transaction costs. At the same time, money becomes relatively cheaper due to Euroland’s lower interest rates than those in the EU member states maintaining their own currencies. Importantly, when joining the EZ, a country’s foreign currency re- serves are liquidated, and only part of them is transferred to the ECB’s common foreign exchange pool. The freed-up funds can be used to pay off some of the foreign debt and to invest in infrastructure (Kolodko 2017).
In this context, it is to be expected that in the 5–10 years horizon the EZ may include all of the 27 European Union member states, of course, by assuming that the Greek syndrome will be solved and Grexit will not happen nor will any other country leave the euro area. It is very unlikely, but not completely impos- sible. Meanwhile, it is not out of the question that in the second half of 2020s the EU population will grow to include new member states from the Balkan region: Albania, Bosnia-Herzegovina, Macedonia, and Serbia. There is also a possibility that Montenegro will become the 28th EU member state (as counted already after the Brexit), automatically enlarging the Euroland area, as the euro is already in circulation there, and, interestingly enough, this may happen earlier than Poland joining the EZ, considering the government’s clear and repeatedly expressed position on that matter12. It would be weirder considering Poland has for many years been treated – and rightly so – first as the leader among post- socialist economies undergoing market reforms (Kolodko 2000), and then as a country whose post-socialist transformation has been the most significant suc- cess (Piatkowski 2018).
It must be emphasised that the requirement of achieving a similar level of economic development, as formulated by some authors and politicians, is too
12 Prime Minister Mateusz Morawiecki in early 2018, when asked about the possibility of Po- land joining the EZ, replied: “We have a long way before we achieve a more real convergence with the hard core of the Eurozone (…). As for Poland’s adoption of the euro, there is no change of our approach, our rhetoric in this respect; this is not a topic today that we take into consideration” (Morawiecki 2018).
far-fetched; and there is no such imperative. Furthermore, the adoption of the euro by subsequent post-socialist countries, with their GDP per capita (accord- ing to PPP) now fluctuating around 50–90% of the average value for the EU as a whole, will speed up the process of bridging the income gap13. Hence those thinking that catching up with the more developed economies should come be- fore the currency convergence are mistaken (Malecki 2018) because the currency convergence itself can become an additional instrument of the real convergence, so badly needed by Europe in its integration efforts.
REFERENCES
Brown, B. (2012): Euro Crash: The Exit Route from Monetary Failure in Europe. Houndmills, Basingstoke, Hampshire: Palgrave-Macmillan.
Dabrowski, M. (2016): The Future of the European Union: Towards a Functional Federalism. Acta Oeconomica, 66(S): 21–48.
Dallago, B. (2016): One Currency, Two Europes: Towards a Dual Eurozone. Singapore: World Scientifi c Publishing.
De Grauwe, P. (2010): Crisis in the Eurozone and How to Deal with It. CEPS Policy Brief, No.
204.
European Commission (2017): Refl ection Paper on the Deepening of the Economic and Monetary Union. Brussels, May 31.
Galbraith, J. K. (2016): Welcome to the Poisoned Chalice: The Destruction of Greece and the Fu- ture of Europe. New Haven, London: Yale University Press.
Hall, P. A. (2014): Varieties of Capitalism and the Euro Crisis. Journal of West European Politics, 37(6): 1223–1243.
IMF (2014): IMF Annual Report. Washington, D. C.
Kawalec, S. – Pytlarczyk, E. (2013): Controlled Dismantlement of the Eurozone: A Strategy to Save the European Union and the Single European Market. German Economic Review, 14(1):
31–49.
Kolodko, G. W. (2000): From Shock to Therapy: Political Economy of Post–Socialist Transforma- tion. Oxford, New York: Oxford University Press.
Kolodko, G. W. (2016): How to Destroy a Country, The Economics and the Politics of the Greek Crisis. Rivista di Politica Economica, 2(IV–VI): 37–61.
Kolodko, G. W. (2017): Economics and Politics of the Currency Convergence: the Case of Poland.
Communist and Post-Communist Studies, 50(3): 183–194.
Kolodko, G. W. (2018): Socialism, Capitalism or Chinism? Communist and Post-Communist Studies , 51(4): 285–298.
Konstytucja Rzeczypospolitej Polskiej (1997): Journal of Laws of 1997, No 78, item 483.
Malecki, W. (2018): Nowe uwarunkowania polityczne i ekonomiczne przystąpienia przez Polskę do strefy euro (New Political and Economic Circumstances Surrounding Polish Accession to the Eurozone). Gospodarka Narodowa, 2: 29–47.
13 Compared to the average GDP per capita of the EU as a whole, calculated at PPP in 11 post- socialist member states, it stands on average at 68%, from 49% in Romania to 88% in Czech Republic. Outside the EU, in the poorest Balkan country, Albania, it’s only 29%.
Marneffe, W. – Van Aarle, B. – Van Der Wielen, W. – Vereeck, L. (2011): The Impact of Fiscal Rules on Public Finances in the Euro Area. CESifo DICE Report, 9(3): 18–26.
McKinnon, R. (2002): Mundell, the Euro and Optimal Currency Areas. In: Courchene, T. E. (ed.):
Money, Markets, and Mobility: Celebrating the Ideas of Robert E. Mundell Nobel Laureate in Economic Sciences. Montreal – Kingston – London, Ithaca: McGill-Queen’s University Press, pp. 41–58.
Morawiecki, M. (2018): Poland’s PM Morawiecki Says Euro Adoption is not under Consideration.
Central European Financial Observer, https://fi nancialobserver.eu/recent-news/polands-pm- morawiecki-says-euro-adoption-is-not-under-consideration [12.08.2018].
Moździerz, A. (2015): Strengthening the Post-Crisis Fiscal Rules – the Case of Spain, Slovakia and Sweden. Equilibrium. Quarterly Journal of Economics and Economic Policy, 10(2): 31–52.
Mundell, R. A. (1961): Theory of Optimum Currency Areas. The American Economic Review, 51(4): 657–665.
Mundell, R. A. (2000): The International Financial Architecture, the Euro Zone and Its Enlargement in Eastern Europe. Distinguished Lectures Series, No. 1, Warsaw: Leon Kozminski Academy of Entrepreneurship and Management.
Pasinetti, L. L. (1998): The Myth (or Folly) of the 3% Defi cit/GDP Maastricht ‘Parameter’. Cam- bridge Journal of Economics, 22: 103–116.
Piatkowski, M. (2018): Europe’s Growth Champion: Insights from the Economic Rise of Poland.
Oxford – New York: Oxford University Press.
Pisani-Ferry, J. (2011): The Euro Crisis and Its Aftermath. Oxford – New York: Oxford University Press.
Podkaminer, L. (2016): Economic Disintegration of the European Union: Not Unavoidable, but Probable. Acta Oeconomica, 66(S): 49-61.
Postula, M. (2012): Possibilities for Optimal Fiscal Policy-Making in the European Union. Re- search in World Economy, 3(2): 42–60.
Postula, M. (2015): Impact of the Council Directive on Requirements for Budgetary Frameworks of the Member States on the Polish Public Finance System. Management and Business Administra- tion, Central Europe, 1 (23): 95–111.
Prasad, E. S. (2014): The Dollar Trap: How the U.S. Dollar Tightened Its Grip on Global Finance.
Princeton (NJ): Princeton University Press.
Sandbu, M. (2015): Europe’s Orphan. The Future of the Euro and the Politics of Debt. Princeton (NJ): Princeton University Press.
Schadler, S. M. (2005): Euro Adoption in Central and Eastern Europe: Opportunities and Chal- lenges. IMF Seminar Volumes, April 18, Washington, D. C.
Schaechter, A. – Kinda, T. – Budina, N. – Weber, A. (2012): Fiscal Rules in Response to the Crisis – Toward the ‘Next-Generation’ Rules. A New Dataset. IMF Working Paper, No. 187.
Schick, A. (2010): Post-Crisis Fiscal Rules: Stabilizing Public Finance while Responding to Eco- nomic Aftershocks. OECD Journal on Budgeting, Vol. 2.
Sławiński, A. (2010): Lessons from the Euro Zone Experiences for the CEE Entrants. Argumenta Oeconomica, 1(24): 49–64.
Stiglitz, J. E. (2018): The Euro: How a Common Currency Threatens the Future of Europe. New York: W. W. Norton & Company.
Tanzi, V. (2013): Dollar, Euros and Debt: How We Got into the Fiscal Crisis and How We Get out of It. Basingstoke, United Kingdom: Palgrave MacMillan.