Full Terms & Conditions of access and use can be found at
https://www.tandfonline.com/action/journalInformation?journalCode=rael20
Applied Economics Letters
ISSN: 1350-4851 (Print) 1466-4291 (Online) Journal homepage: https://www.tandfonline.com/loi/rael20
FDI according to ultimate versus immediate
investor countries: which dataset performs better?
Imre Fertő & Magdolna Sass
To cite this article: Imre Fertő & Magdolna Sass (2019): FDI according to ultimate versus immediate investor countries: which dataset performs better?, Applied Economics Letters, DOI:
10.1080/13504851.2019.1659925
To link to this article: https://doi.org/10.1080/13504851.2019.1659925
© 2019 The Author(s). Published by Informa UK Limited, trading as Taylor & Francis Group.
Published online: 05 Sep 2019.
Submit your article to this journal
Article views: 90
View related articles
View Crossmark data
ARTICLE
FDI according to ultimate versus immediate investor countries: which dataset performs better?
Imre Fertőand Magdolna Sass
Centre for Economic and Regional Studies, Hungarian Academy of Sciences, Budapest, Hungary
ABSTRACT
Foreign direct investment (FDI) plays an ever-increasing role in the world economy; however, empirical research on many aspects of FDI is hindered by data problems. New data on FDI stocks, broken down according to the nationality of the ultimate owner company, are available for a few countries. Based on the example of three Central and Eastern European countries, we show that these new data give better results when analysing the main drivers of bilateral FDI, than the up till now available FDI data, which were broken down according to the nationality of the immediate investorfirm. Furthermore, we present evidence on the main drivers of FDI into three former transition economies: distance, relative country size and trade costs.
KEYWORDS
Foreign direct investment;
ultimate and immediate investor countries; the Czech Republic; Hungary; Poland JEL CLASSIFICATION F21; C19
I. Introduction
There is a wealth of literature on foreign direct investment (FDI). They focus mainly on the direc- tion and driving forces of FDIflows and their impact on the home and host economies (Li, Liao, and Sun 2018). Data problems and the impact of data selec- tion on study results were often underlined as important barriers to this analysis (Iwasaki and Tokunaga2014). Up till now, one approach to over- come this problem was to use detailed firm-level data (El-Sahli, Gullstrand, and Olofsdotter 2018).
We investigate whether new FDI stock data based on the principle of ultimate beneficiary owner’s nationality as opposed to the immediate or direct owner of FDI perform better in analysing the most important factors affecting bilateral FDI stocks.
We selected three Visegrad countries (the Czech Republic, Hungary and Poland) as a case study for our analysis. FDI had an important role for these countries in their transition process and later on in their convergence process with developed econo- mies. After a long period of isolation during the planned economy, these countries opened up to FDI more or less abruptly as their transition to market economy started. Thus, they became inter- esting‘laboratories’(Meyer and Peng2016) for eco- nomic and business analysis, resulting in a set of
investigations about the various aspects of FDI.
Their similarity due to their common economic history, structure, geographic location and size pro- vides us with a relatively homogeneous group of countries.
Our main aim is to show on a sample of three Central European countries that the new FDI data provide better results when analysing the main drivers of bilateral FDI, than the up till now avail- able FDI data, which were broken down according to the nationality of the immediate investorfirm.
II. Methods and data
Our analysis is based on the knowledge-capital model of multinational activity (Markusen 2002) which explains the co-existence of horizontal and vertical FDI in a general equilibrium framework and takes into account both home and host countries’
characteristics and the increased international frag- mentation of production. Following earlier studies (e.g. Perez, Brada, and Drabek 2012), we estimate the following benchmark models.
FDIij¼β0þβ1FACTOR1ijþβ2ADJij þβ3DISTijþβ4SUMijþβ5GDP2ij
þβ6TCHostjtþβ7TCHomeitþεij
(1a)
CONTACTMagdolna Sass sass.magdolna@krtk.mta.hu
© 2019 The Author(s). Published by Informa UK Limited, trading as Taylor & Francis Group.
This is an Open Access article distributed under the terms of the Creative Commons Attribution-NonCommercial-NoDerivatives License (http://creativecommons.org/licenses/by-nc- nd/4.0/), which permits non-commercial re-use, distribution, and reproduction in any medium, provided the original work is properly cited, and is not altered, transformed, or built upon in any way.
FDIij¼β0þβ1FACTOR1ijþβ2ADJijþβ3DISTij þβ4SUMijtþβ5GDP2ijþβ6TCHostj þβ7TCHomeiþβ7FACTOR2ij þβ8 GDPiGDPj
FACTOR2ij þβ9TCHostFACTOR2ijþεij
(1b) The independent variables are the following:
FACTOR1 represents the factor endowment differ- ences, using the absolute value of the differences between home and host country per capita GDP.
ADJ takes the value of 1 if the host and home countries have a common border and 0 otherwise.
DIST is the distance between the respective capital cities. SUM controls for relative country size, follow- ing Egger and Winner (2006), and GDP2 is that of the home country. TCHOST is the trade cost of the host country, proxied by imports in % of GDP.
TCHOME is the trade costs of the home country, proxied by balance of goods and services in % of GDP. FACTOR2 represents the difference in skill endowments, by using the difference between the Human Development Index of home and host coun- tries, following Perez, Brada, and Drabek (2012).
We use a newly available data set on FDI stocks for the year 2016, broken down according to the nation- ality of the ultimate owner company. In tracing the
‘real origin’of FDI in a host country, a new oppor- tunity is provided by these data, which should be compiled by the national banks according to the latest balance of payments manual (BPM6) and the new benchmark definition of FDI (BMD4) (IMF 2009; OECD2015). The new methodology complies with the reality of FDI, where the ultimate control- ling investor of an investment project may differ from the direct investor and thus also their nation- alities differ. Multinationals increasingly use their foreign subsidiaries for channelling FDI to third (or fourth,fifth and so on) countries, for various reasons, among which tax optimization through using tax havens (Bojnec and Fertő 2018) or tax-friendly developed countries clearly stands out. Further rea- sons include organizational ones or higher familiar- ity of subsidiary staffwith the new location of FDI in a third country.
Two FDI data sets are available for each coun- try: one based on the nationality of the immediate investor and another one based on the nationality
of the ultimate investor. The task of tracing the ultimate investor multinational company is in cer- tain cases problematic and requires substantial knowledge and resources, even if there are detailed guidelines published on identifying them (OECD 2015). That may be the reason why up until now only a few national banks published two data sets. From the OECD, FDI position (stock) data were available at the time of our research for 17 countries, including our sample countries.
We use the latest available data (2016) for the three selected economies. (At present, the data are available for maximum four years: 2014–2015–2016 and for a few countries for 2017. As of 6 July 2019, 17 countries present their data at the OECD website:https://stats.
oecd.org/Index.aspx?QueryId=64220: FDI positions by partner country BMD4: Inward FDI by immediate and by ultimate investing country.) For the Czech Republic, we use bilateral FDI stock data for 45 coun- tries, for Hungary, 56 countries and for Poland 45 countries, where data are different from zero and contain the most important investing countries. Our sample covers more than 95% of the total FDI stock (both immediate and ultimate) of these countries.
Note that the two FDI data sets are rather similar (correlation coefficient of 0.732 and Spearman corre- lation coefficient of 0.727), but there are some impor- tant differences between them. We use OLS regression with heteroscedastic robust SEs.
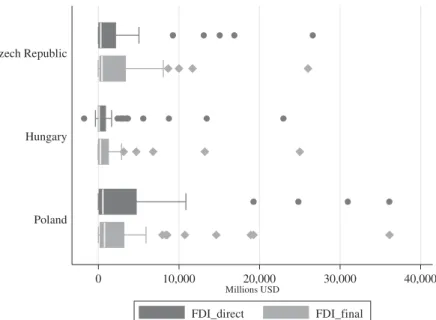
Figure 1 shows that there is a clear dominance of one investor country according to final inves- tors (in this case Germany). According to direct investors, there is still a dominant investor, but the distribution among investing countries is more even. Furthermore, smallfinal investors compared to direct ones are more numerous in the Czech Republic and Hungary, while the case is the oppo- site in Poland.
Our results are mixed in terms of reinforcing the basic model (Table 1). For KK1 model,five variables are significant with ultimate FDI data, three of them:
SK1, DIST and SUM with the expected sign. With immediate FDI data, there are only three significant variables, two of them with the expected sign. For the augmented KK2 model, the ultimate FDI yielded in a higher number of significant variables compared to the immediate FDI one, with the interaction effect of Sk2difgdp and Tchostsk2 significant and positive with ultimate FDI data.
2 I. FERTŐAND M. SASS
Our results suggest that ultimate FDI data per- form basically better in each case compared to when FDI data according to the nationality of the immediate owners are used. This is under- standable, as many multinationals ‘sandwich’ a subsidiary in third (fourth, etc.) countries between the parent and thefinal destination country of the direct investment, introducing substantial distor- tion in the country composition of inward FDI stock according to the immediate investor’s nationality in a given economy. This distortion is corrected to a significant extent by the new BPM6/
BMD4 FDI data.
Furthermore, distance is an important factor influ- encing FDI between a Visegrad country and the
individual investor countries, performing well with both ultimate and immediate investors. This is in line with the results of previous studies (e.g.
Brenton, Di Mauro, and Lücke1999). Relative coun- try size performs well as an explanatory factor of bilateral FDI with ultimate FDI data indicating the importance of‘similarity’in FDI flows. Trade costs, especially those of the home country and the host country with ultimate investors, are significant. This suggests that while both horizontal and vertical FDI are present in the region, the latter dominates. Relative factor endowment differences, however, gave ambig- uous results: their nonexpected signs may indicate the changing position of the three countries in this respect as a result of their increasing wage levels. Surprisingly, common border is not significant, offering various explanations. First, Germany is the leading investor in Hungary, without a common border between the two countries, second, in the case of ultimate FDI data, US, and in the case of direct data, countries with beneficial tax regulations (Netherlands, Luxemburg, Ireland) but without common border with the analysed countries are the leading investors.
Furthermore, intraregional FDI has remained low so far.
III. Conclusion
We show that new FDI data, broken down according to the nationality of the ultimate investor company,
0 10,000 20,000 30,000 40,000
Millions USD
Poland Hungary Czech Republic
FDI_direct FDI_final
Figure 1.Differences between FDI stock data according to the nationality of the direct and ultimate investor.
Source: own calculations.
Table 1.Results of OLS regressions.
OLS KK1 KK2
Variable
FDI immediate
FDI
ultimate FDI immediate FDI ultimate
FACTOR1 0.040** 0.021** 0.036* 0.015*
border 78.760 2186.309 396.134 2492.316
lndist −1.9e+03*** −1.4e+03*** −1.8e+03*** −1.3e+03***
sum 0.000 0.001*** 0.000 0.000**
gdp2 −726.689 −470.185 −1.0e+03 −910.013
Tchost −3.048 −22.508** −18.560 −37.594**
Tchome 276.350** 234.755** 262.034** 237.931*
FACTOR2 −9.6e+03 −9.7e+03
FACTOR2difgdp 0.002 0.005***
tchostFACTOR2 361.187* 320.122**
constant 1.4e+04*** 1.1e+04*** 1.5e+04*** 1.1e+04***
N 138 138 135 135
R2 0.216 0.336 0.227 0.402
* significant at 0.10 level, ** significant at 0.05 level, *** significant at 0.01 level.
give better results when analysing the main drivers of bilateral FDI data, than the up till now available FDI data according to the nationality of immediate inves- torfirms. Furthermore, we show that distance, rela- tive country size and trade costs are the main drivers of FDI into three former transition economies.
Further research can expand the country group analysed to include not only former transition economies but other OECD countries as well.
When data for further years will be available, a panel data analysis may yield better results allowing to analyse the dynamics of FDI and the impacts of changes in the institutional environment onFDI.
Furthermore, the role of intermediary countries can be analysed: what are the main determining factors (besides tax optimization) in the selection of intermediary third countries.
Disclosure statement
No potential conflict of interest was reported by the authors.
References
Bojnec, S., and I. Fertő. 2018. “Globalization and Outward Foreign Direct Investment.”Emerging Markets Finance and Trade54 (1): 88–99. doi:10.1080/1540496X.2016.1234372.
Brenton, P., F. Di Mauro, and M. Lücke. 1999. “Economic Integration and FDI: An Empirical Analysis of Foreign
Investment in the EU and in Central and Eastern Europe.”
Empirica26 (2): 95–121. doi:10.1023/A:1007006429600.
Egger, P., and H. Winner.2006.“How Corruption Influences Foreign Direct Investment: A Panel Data Study.”
Economic Development and Cultural Change54 (2): 459–
486. doi:10.1086/497010.
El-Sahli, Z., J. Gullstrand, and K. Olofsdotter. 2018.
“Exploring Outward FDI and the Choice of Destination: Evidence from Swedish Firm-level Data.”
Applied Economics Letters 25 (17): 1222–1225.
doi:10.1080/13504851.2017.1412068.
IMF.2009.Balance of Payments and International Investment Position Manual, Sixth ed. (BPM6), Washington DC:
International Monetary Fund.
Iwasaki, I., and M. Tokunaga. 2014. “Macroeconomic Impacts of FDI in Transition Economies: A Meta- Analysis.” World Development 61: 53–69. doi:10.1016/j.
worlddev.2014.03.022.
Li, B., Z. Liao, and L. Sun.2018.“Evolution of FDI Flows in the Global Network: 2003–2012.”Applied Economics Letters25 (20): 1440–1446. doi:10.1080/13504851.2018.1430306.
Markusen, J. R.2002.Multinational Firms and the Theory of International Trade. Cambridge, MA: MIT Press.
Meyer, K. E., and M. W. Peng.2016.“Theoretical Foundations of Emerging Economy Business Research.” Journal of International Business Studies 47 (1): 3–22. doi:10.1057/
jibs.2015.34.
OECD. 2015. Measuring International Investment by Multinational Enterprises. Implementation of the OECD’s Benchmark Definition of Foreign Direct Investment. 4th ed.
Paris: OECD.
Perez, M. F., J. C. Brada, and Z. Drabek.2012.“Illicit Money Flows as Motives for FDI.” Journal of Comparative Economics40 (1): 108–126. doi:10.1016/j.jce.2011.03.007.
4 I. FERTŐAND M. SASS