C E N T R A L A N D E A S T E R N E U R O P E I S S U E S
Drivers of Regional Competitiveness in the Central European Countries
Imre Lengyel•Ja´nos Rechnitzer
Published online: 22 October 2013 CEEUN 2013
Abstract The examination of regional competitiveness has become a research question of outstanding importance in the Central European post-socialist countries since joining the EU. In our study we will proceed to analyse the competitiveness of 93 NUTS2 level regions of 8 Central European countries with the help of an empirical data base, using multivariable statistical methods. After introducing the database, we are going to investigate into the common revealed competitiveness indicator. Not only revealed competitiveness categories shall be analysed with the help of multivariable statistical procedures, but also the background processes described by the factor analysis and the multivariable linear regression model.
Keywords Regional competitiveness Pyramidal modelDrivers of competitivenessMultivariable linear regression model
JEL Classification C10 O18R10
Introduction
In the course of the years many concepts of regional competitiveness were formed which spring from diverse opinions (Barkley2008; Bristow 2010; Dijkstra et al.
2011; Kitson et al. 2004; Lukovics 2009). From an economic point of view, the competitiveness of territorial units, i.e. countries and regions can be measured by the total factor productivity, as Krugman (1994) says. Porter (2008, 3) states
I. Lengyel (&)
Faculty of Economics and Business Administration, University of Szeged, Szeged, Hungary e-mail: ilengyel@eco.u-szeged.hu
J. Rechnitzer
Faculty of Kautz Gyula Economics, Sze´chenyi Istva´n University, Gy}or, Hungary e-mail: rechnj@sze.hu
DOI 10.1007/s11300-013-0294-2
‘‘Competitiveness depends on the productivity with which a location uses its human, capital, and natural resources. Productivity sets the sustainable standard of living’’.
In regional science it can be considered generally accepted that the competitiveness of regions, cities is more than the productivity of inputs, since it essentially means a regional economic development, as a result of which the average standard of living in the region improves (Camagni2002; Camagni and Capello2010; Malecki2002).
Competitiveness of regions and cities may be well described by the widely recognized definition of Storper (1997, 20): ‘‘The ability of an (urban) economy to attract and maintain firms with stable or rising market shares in an activity while maintaining or increasing standards of living for those who participate in it.’’ Built on this approach, the standard notion of competiveness is widely accepted as (EC 1999, 75): ‘‘the ability of companies, industries, regions, nations and supra-national regions to generate, while being exposed to international competition, relatively high income and employment levels’’. In other words ‘‘high and rising standards of living and high rates of employment on a sustainable basis’’ (EC2001, 37). The European Competitiveness Reports also adopt this approach (EC 2008, 15):
‘‘competitiveness is understood to mean a sustained rise in the standards of living of a nation or region and as low a level of involuntary unemployment, as possible.’’
Since the notion of regional competitiveness can be seen as refining that of economic development, it can be often be observed that proposals for improved competitiveness combine traditional means of endogenous development with strategies based on regional policies. There are a number of attempts to define the model of regional competitiveness (Huggins2003; Martin et al.2006; Porter2007;
Snieska and Bruneckiene´2009).
The pyramidal model of regional competitiveness seeks to provide a systematic account of this standard means of EU and to describe the drivers of improved competitiveness (Lengyel2004). This model has been adopted by many authors in international literature (Berumen2008; Gardiner et al.2004; Parkinson et al2006;
Resch2008; Sinabell2011), since ‘‘this model is useful to inform the development of the determinants of economic viability and self-containment for geographical economies’’ (Pike et al.2006a, 26). As it can be perceived in the pyramidal model,
‘‘more recent analytical review has sought to identify the interrelated factors that driver competitiveness’’ (Pike et al.2006b, 112).
The pyramidal model is established on the basis on the inputs–outputs–outcomes relationships (Lengyel2009; Gardiner et al.2004; Parkinson et al2006). Outcomes are the standard of living, the prosperity of any region depends on its competi- tiveness. Outputs are the revealed competitiveness indicators: labor productivity, employment rate and household income (wages). Sources of competitiveness, inputs are drivers of competitiveness with a direct and short-term influence on economic output. In the renewed pyramidal model there are five drivers of regional competitiveness (Lengyel and Rechnitzer 2013): research and technological development, human capital, productive capital and FDI, traded sectors and clusters, social capital and institutes.
In our study we will proceed to analyse the competitiveness of 93 NUTS2 level regions of 8 Central European countries with the help of an empirical database, using multivariable statistical methods. After introducing the database, we are going
to investigate into the common revealed competitiveness indicator. Not only revealed competitiveness categories shall be analysed with the help of multivariable statistical procedures, but also the background processes described by the factor analysis and the multivariable linear regression model.
Database and Methodology
In the course of the empirical study1 the competitiveness of the NUTS2 level regions of eight countries has been analysed, altogether 93 regions: Austria 9 regions, Czech Republic 8 regions, Germany 39 regions, Hungary 7 regions, Poland 16 regions, Romania 8 regions, Slovakia 4 regions, Slovenia 2 regions (see Appendix1).
The objectives of the empirical study:
• the comparison of regions according to their revealed competitiveness,
• the demonstration of the extent to which the utilized indicators, indicator groups influence regional competitiveness.
Our study follows the rationale of the renewed pyramidal model. In many cases the supply of data is also incomplete, or in case of the appearance of new regions there are no older data. A part of soft type information (e.g. information related social capital) is not included in public and verifiable databases. As a result of the above we were not able to conduct a full-scale analysis of all the drivers of competitiveness with indicators following the rationale of the pyramidal model. In the course of the gathering of data we primarily relied on the Eurostat database and the publicly released indicators of Cohesion Reports no. 4 (CR4) and no. 5 (CR5).
For the computerized investigations the SPSS-18 program pack was used.
We tried to compile the database of the empirical analysis according to the five drivers of competitiveness according to redefined pyramidal model. Our database utilized for the empirical study consists of (Appendix2):
• 3 indicators expressing revealed competitiveness categories;
• 21 indicators describing drivers of competitiveness.
In the course of the examination of empirical data more methods were used:
• principal component analysis: to form a common scale from the 3 revealed competitiveness categories;
• factor analysis: to filter dominant factors on the basis of the drivers of competitiveness;
• multivariable linear regression: to demonstrate the factors influencing regional competitiveness.
1 This research was supported by project entitled TAMOP-4.2.1/B-09/1/KONV-2010-0003: Mobility and Environment: Car industry, Energetic and Environmental Researches in the Central- and West-Duna´ntu´l Region.
Revealed Competitiveness of Regions
Revealed competitiveness is measured by three categories (labour productivity, employment rate and the available income of the households, which shows the level of welfare, standard of living of those living in the given region). These indicators determine competitiveness not separately, but together (Lengyel and Rechnitzer 2013).
To perform further calculations a common competitiveness indicator is formed from the three revealed competitiveness categories, and to contract the information contained by these categories principal component analysis is applied: labour productivity (labprod07), the employment rate of people aged 25–64 (empr1509) and the available income of households (dispinc07). The revealed competitiveness (RC) principal component (an indicator of common revealed competitiveness) is used shall later be considered as a dependent variable:
• RC contains 92.8 % of the information of the 3 revealed competitiveness indicators;
• Communalities: labprod07: 0.938; empr1509: 0.883 and dispinc07: 0.961.
The RC values are dispersed around the interval of zero, therefore the regions of negative values may be regarded as regions of weak competitiveness, while those of positive values are considered as regions of strong competitiveness.
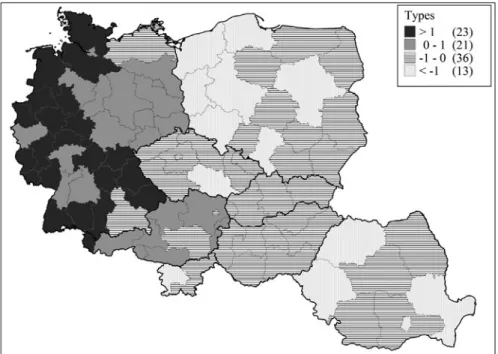
The values of regions according to the RC competitiveness principal component, as types specified by factor values, show sharp spatial characteristics (Fig.1). A coherent area, the’Alps-area’ can be observed, which consists of South-German and North-Austrian regions of the strongest competitiveness. The other German and Austrian (and one of the Slovenian) regions, which may be regarded as the ‘‘middle mountains’’ connected to the Alps, constitute the second group (including Prague and Bratislava), which can still be regarded as being of strong competitiveness. The
‘‘hill-country’’ situated east from the Alps comprise the third group, consisting of mainly Czech regions, which means just one or two smaller hills the further we get from the Alps. The fourth group is the plain, with regions of very weak competitiveness. The RC competitiveness principal component shows that the competitiveness of the regions depends strongly on their geographical proximity and distance from the ‘‘core’’ of Europe.
The majority of the post-socialist countries’ regions (except Slovenia and the Czech Republic), comprising a coherent area, can be found in the fourth type of regions with the weakest competitiveness, only the capitals and some industrial regions could make it into the third type (Farkas2011; Lengyel and Cadil2009).
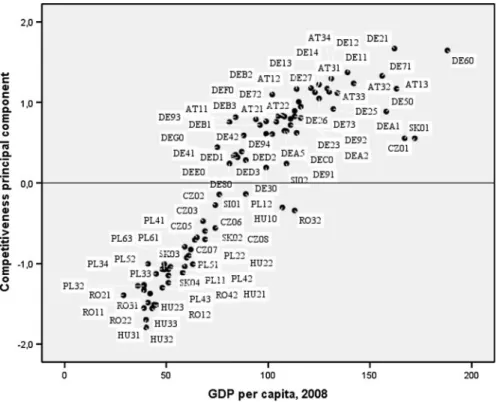
The RC and the level of economic development (GDP per capita) are strongly related (Fig.2): the linear correlation of the two data rows is?0.8752, showing that they move strongly together. The regression curve fitting to the points is:
y¼2:0706 lnðxÞ 9:0873; whereR2¼0:8752:
Examining the regions together on the basis of the two indicators, the RC and the GDP per capita can be also pointed out that the German and Austrian regions detach themselves from the other regions. The least developed regions of the weakest
competitiveness include both Central-Hungary and the other six Hungarian regions, located in the bottom left quarter in the company of Romanian and Polish regions.
Up to now we have demonstrated the competitiveness of regions on the basis of data available for last year, i.e. from a static approach. It is worth to examine the change of the three revealed competitiveness categories, as dynamic indicators (Appendix 3): the changes in the employment rate of people aged 20–64, in 2000–2008 (empl08-00); the growth of productivity within the sector (in the EU27’s average), in 2007/2000 (prodgr07/00); the available income of households (PPCS, on the basis of the final consumption per capita), in 2007/2000 (disp07/00). A dynamic principal component was generated by principal component analysis, which we regard as dynamic dependent variable:
• The principal component contains 75,4 % of the information of the 3 dynamic indicators;
• Communalities: empl08-00: 0,66; prodgr07/00: 0,777 and disp07/00: 0,826.
In the upper left quarter there are German and Austrian regions of strong position, but weak dynamics (Fig.3). The change of the indicators of German and Austrian regions with strong competitiveness is much less than that of the other regions, which is understandable, because high level employment for instance cannot be continuously increased. The regions of Prague and Bratislava are located in the upper right quarter, which can be considered strong according to both
Fig. 1 Types of regions by RC competitiveness principal component
dimensions, but the regions of Warsaw and Budapest (Central-Hungary) are not far from the border of this quarter either. The bottom left quarter, which is considered weak according to both dimensions, includes the Polish regions and Central- Duna´ntu´l (although on the edge of the quarter), the positions of which worsened in the past decade, as it was shown by several studies. The Romanian regions are the most dynamic, who started obviously at a very low value, but their growth accelerated in 2000–2008.
Factors Influencing Regional Revealed Competitiveness
The five drivers of competitiveness according to pyramidal model could be characterised by a very different number of indicators, therefore the relations between these drivers and revealed competitiveness shall not be examined separately. It may be noted that multicollinearity can also occur among the indicators of the five competitiveness drivers, which makes correct statistical analyses more difficult (Lengyel and Szaka´lne´ Kano´2012).
Instead of considering which indicator belongs to which drivers of competitive- ness, independent factors were formed by compacting the information included in the 21 indicators by factor analysis, among which there is no multicollinearity, the
Fig. 2 Connection between competitiveness principal component and GDP per capita
remaining members are distributed normally, and there is no homoscedasticity either. Then a multivariable linear regression analysis was performed with these factors, taking into consideration the RC competitiveness principal component, as dependent variable calculated from the three revealed competitiveness categories.
Its disadvantage is that the meaning of the individual factors generated in the process has to be explained afterwards with the help of the indicators included in them, and the factor structure can differ from the drivers of competitiveness according to the pyramidal model.
By performing a factor analysis on the basis of the 21 indicators five factors were generated, which contain 81.5 % of the information included in the indicators.
Varimax rotation was applied on the factors to form the components of the individual indicators. From among the rotated components of the factors in the absolute value the values above 0.5 were taken into consideration (Appendix4).
The economic interpretation and factor weight of the 5 factors are the following:
Factor 1: Human capital: human development, workforce attraction and patents (HCD), factor weight: 18,873. Human development, people moving in, high patent announcements shape this factor positively, while the proportion of people of active age and the number of hours worked affect it negatively.
Factor 2: Research and technological development (RTD), factor weight: 17,901.
The high share of the expenses spent on R&D, the high proportion of people
Fig. 3 Connection between static and dynamic competitiveness principal component
employed in the high-tech sector, and high fixed capital generation constitute this factor.
Factor 3: Social capital: poverty (SCP), factor weight: 17,224. The factor comprising high poverty ratio, low education.
Factor 4: Social capital: unemployment (SCU), factor weight: 15,265. This factor is made up of the unemployed, among them the high ratio of permanently unemployed and young unemployed people.
Factor 5: Human capital: high education (HCH), factor weight: 12,306. The high ratio of highly qualified people has a positive effect on this factor, while the ratio of people employed in industry has a negative effect on it.
From the 21 indicators 19 are connected to one of the factors, two were left out:
the proportion of the people employed in services and the proportion of people participating in education and courses from the population aged 25–64. The three drivers of competitiveness by pyramidal model appeared also in the factors:
research and technological development (R&D), human capital and social capital (the latter divided into two–two parts respectively). From the drivers of compet- itiveness those two were not represented to which the appropriate number of measurable indicators was not found: productive capital and FDI, and the traded sectors and clusters (one of their indicators joined a connected factor). Only Factor 1, human capital: human development and the proportion of people of inactive age factor became ‘‘mixed’’, into which one indicator of social capital and one of research and technological development were also included besides the character- istics of human capital. Consequently, the pyramidal model seems to be appropriate for the systemization of factors influencing competitiveness.
The results of the factor analysis can be analysed in themselves as well, however, our main aim at present is to demonstrate to what extent the competitiveness principal component (RC) as dependent variable is explained by the 5 factors as independent variables. In case of the multivariable linear regression the 5 factors explain 93.5 % (R2=0.935) of the dependent variable’s (RC) standard deviation.
On the basis of the calculations the following model was generated:
RCi¼ 0:691 HCDiþ0:439 RTDiþ0:322 SCPi0:334 SCUi
þ0:22 HCHiþei
The regression coherence shows what effect a factor has on regional compet- itiveness, e.g. one unit improvement of HCD results in 0.691 improvement of the dependent variable (RC). The equation demonstrates that regional competitiveness is largely determined by human capital and R&D. While in case of social capital poverty moves in a similar direction to competitiveness, it moves in inverse ratio to unemployment. This relationship also shows that regional competitiveness is really close to the field of endogenous development, since it is moved by slow spatial social processes. While the proportion of people with high qualifications may improve in a decade or two, the modification of more characteristics of the social capital in a given case requires a time period of more generations.
Factor 1 (human capital: human development, workforce attraction and patents) exerts the greatest influence on regional competitiveness. This means the high
standard of human capital, since in Europe the developed metropolises are generally the destinations of migration, which provide workplaces and high income. However, Factor 1 is influenced in inverse direction by the proportion of active aged people (25–64 years old) and the average weekly hours worked, probably because there are less working hours in the competitive regions, and the proportion of young and elderly people is higher.
The spatial distribution of the values of Factor 1 (human capital: human development, workforce attraction and patents) shows a west-east slope (Fig.4).
Here, too, the German regions are at the top, but in a different way compared to that of the RC competitiveness principal component: almost two-thirds of the German regions constitute the strongest group, especially in the western and southern parts of the country. The second group also includes German and Austrian regions, while in the third group Austrian regions (Vienna and Carinthia) appear besides the regions of post-socialist countries. The weakest type consists of Polish and Romanian regions, but Czech and the Slovenian regions also belong here. It becomes also apparent that there is hardly any difference between the 7 Hungarian regions according to Factor 1, from the international point of view regional differences perceived in Hungary (and Slovakia, too) are less conspicuous in this indicator group.
Factor 2 also has a serious impact on regional competitiveness: assistances won from the EU research funds, gross expenses spent on R&D, the number of people employed in the high-tech sectors. It can be unequivocally stated that regional competitiveness depends largely on the magnitude of R&D, the expansion of
Fig. 4 Types of regions by human capital factor
knowledge-based, innovative economies (Lengyel and Leydesdorff2011; Szaka´lne´
Kano´ and Vas2013). The types of regions according to the human capital factor are spatially much more dispersed than they used to be (Fig.5). It can be observed here as well, that the German and Austrian regions are at the top (with Prague and one Slovenian region), but they are much less in number, and form an ‘‘island’’, not a block. The German and Austrian regions dominate also in case of type 2, plus out of the 7 Hungarian regions 5 are listed here (together with Bucharest and Vienna), and 2 out of 4 Slovakian regions, too. The third type can be found almost consistently in all countries, while the fourth group includes Polish and German regions.
It is a characteristic feature of the R&D activities that they are spatially concentrated, and with their global connections they are connected not to their direct neighbours, but to professionally outstanding partners located anywhere in space.
Consequently, in those German and Austrian regions where there is a high portion of assistance won from EU research funds, gross expenses spent on R&D, and there are significantly more people employed in the high-tech sectors.
The investigation of the 21 drivers of competitiveness with the help of factor analysis and regression analysis points out that human capital and research and technological development have a very serious influence on regional competitive- ness and development. Whereas considering human capital the German and Austrian regions excel, on the basis of research and technological development more regions of the post-socialist countries reach the middle field. According to these two factors the Hungarian regions belong to the middle field, the leading group of the post-socialist countries’ regions.
Fig. 5 Types of regions by R&D factor
Conclusions
In our study the newest trends connected to regional competitiveness were reviewed.
The renewed pyramidal model was introduced to interpret, measure the concept of regional competitiveness and demonstrate its influencing factors, in which besides human and social capital, traded sectors are also included. Multivariable statistical procedures were applied to demonstrate the correspondences, examine the database compiled from the data of the 93 regions of the 8 Central European countries. Due to the difficulty of obtaining international data, the database generally contains data from the years 2008 and 2007, i.e. shows the situation before the global crisis.
From the results we point out that the competitiveness of the German, Austrian and Slovenian regions is in every respect considerably stronger than that of the other countries’ regions, only the capital regions may be numbered among them. Regions of strong competitiveness cluster spatially, and the regions of the following type are located in their neighbourhood, in their geographical proximity.
A powerful spatial separation can be observed; the regions making up the individual clusters constitute ‘‘bands’’ from west to east. The regions of the post- socialist countries, including the East-German provinces, detach themselves from the rest, with the only exceptions of Slovenia and Romania. The effect of the urbanization agglomeration advantages can also be observed (Capello2007), on the one hand, the capital regions of the post-socialist countries constitute a separate group, and on the other hand the German (Hamburg, Bremen etc.) and Austrian (Vienna) metropolises also detach themselves from the rest.
The results of the factor and the regression analysis show that although the competitiveness of the post-socialist regions is weak, on the basis of human capital and R&D, the factors determining future competitiveness, there is hope for their situation to improve quickly. In other words, although both employment and labour productivity are of a low level in these regions, the network of research institutes and the preparedness of the work force would enable a significantly quicker rated economic growth. Consequently, the potential conditions of the improvement of regional competitiveness are given; the question is whether the national economic, regional development policy can properly take advantage of them.
Appendix 1 Codes and Names of the NUTS2 Regions
Code Regions Code Regions Code Regions
CZ01 Praha DE94 Weser-Ems AT34 Vorarlberg
CZ02 Strˇednı´ Cˇ echy DEA1 Du¨sseldorf PL11 Ło´dzkie
CZ03 Jihoza´pad DEA2 Ko¨ln PL12 Mazowieckie
CZ04 Severoza´pad DEA3 Mu¨nster PL21 Małopolskie
CZ05 Severovy´chod DEA4 Detmold PL22 S´la˛skie
CZ06 Jihovy´chod DEA5 Arnsberg PL31 Lubelskie
Appendix continued
Code Regions Code Regions Code Regions
CZ07 Strˇednı´ Morava DEB1 Koblenz PL32 Podkarpackie
CZ08 Moravskoslezsko DEB2 Trier PL33 S´wie˛tokrzyskie
DE11 Stuttgart DEB3 Rheinhessen-Pfalz PL34 Podlaskie
DE12 Karlsruhe DEC0 Saarland PL41 Wielkopolskie
DE13 Freiburg DED1 Chemnitz PL42 Zachodniopomorskie
DE14 Tu¨bingen DED2 Dresden PL43 Lubuskie
DE21 Oberbayern DED3 Leipzig PL51 Dolnos´la˛skie
DE22 Niederbayern DEE0 Sachsen-Anhalt PL52 Opolskie
DE23 Oberpfalz DEF0 Schleswig–Holstein PL61 Kujawsko-Pomorskie
DE24 Oberfranken DEG0 Thu¨ringen PL62 Warmin´sko-Mazurskie
DE25 Mittelfranken HU10 Ko¨ze´p-Magyarorsza´g PL63 Pomorskie DE26 Unterfranken HU21 Ko¨ze´p-Duna´ntu´l RO11 Nord-Vest
DE27 Schwaben HU22 Nyugat-Duna´ntu´l RO12 Centru
DE30 Berlin HU23 De´l-Duna´ntu´l RO21 Nord-Est
DE41 Brandenburg-Nordost HU31 E´ szak-Magyarorsza´g RO22 Sud-Est DE42 Brandenburg-Su¨dwest HU32 E´ szak-Alfo¨ld RO31 Sud-Muntenia
DE50 Bremen HU33 De´l-Alfo¨ld RO32 Bucures¸ti-Ilfov
DE60 Hamburg AT11 Burgenland (A) RO41 Sud-Vest Oltenia
DE71 Darmstadt AT12 Niedero¨sterreich RO42 Vest
DE72 Gießen AT13 Wien SI01 Vzhodna Slovenija
DE73 Kassel AT21 Ka¨rnten SI02 Zahodna Slovenija
DE80 Mecklenburg-Vorpommern AT22 Steiermark SK01 Bratislavsky´ kraj DE91 Braunschweig AT31 Obero¨sterreich SK02 Za´padne´ Slovensko
DE92 Hannover AT32 Salzburg SK03 Stredne´ Slovensko
DE93 Lu¨neburg AT33 Tirol SK04 Vy´chodne´ Slovensko
Appendix 2 Indicators of Empirical Investigation by Renewed Pyramidal Model
Code Denomination Source
Revealed competitiveness
eugdp08 Regional gross domestic product (PPS per inhabitant in % of the EU-27 average), 2008, %
Eurostat empr1509 Employment rate of the age group 15–64, 2007, % Eurostat dispinc07 Disposable income of private households (purchasing power standard based on
final consumption per inhabitant), 2007
Eurostat labprod07 Labour productivity in industry and services (GVA per employee, in the
average of EU27), 2007, %
CR5 Research and technological development
Appendix continued
Code Denomination Source
gerd07 Total intramural R&D expenditure (GERD), percentage of GDP, 2007, % Eurostat emphigh08 Employment in high-technology sectors within the number of total employed,
2008, %
CR5 fp707 7th framework program, average funding per head (EU27=100), % CR5 pat1607 Patent applications to the European patent office (EPO), average 2006–2007,
per inhabitant
CR5
lisbind08 Lisbon index (0–100), 2008 CR5
Human Capital
adedu08 Population aged 25–64 with tertiary education (ISCED 5–6), 2008, % CR5 tertedu34 Population aged 30–34 with a tertiary education (ISCED 5–6), 2008, % CR5 age25–64 The proportion of people aged 25–64 in the total population, 2004, % CR4 weeklyh10 The number of average weekly hours worked (in full-time job), 2010, hour Eurostat mwork78 That proportion of people from the active age population who moved into the
region from outside in the past 2 years (from within the EU, 2007–2008, % CR5 Productive Capital and FDI
gfcf07 Gross fixed capital formation per inhabitant (all NACE activities), 2007, Euro Eurostat Traded sectors and clusters
indust05 Employment in industry (% of total employment), 2005, % CR4 serv05 Employment in services (% of total employment), 2005, % CR4 Social capital and institutes
adedutr08 Participation of adults aged 25–64 in education and training, 2008, % CR5
eudev07 EU Human Development Index (0–100), 2007, % CR5
povrisk08 The proportion of the population subjected to poverty even after receiving social benefits, 2008, %
CR5
unempr09 Unemployment rate, 2009, % Eurostat
lowedu08 Population aged 25–64 with low education, (ISCED 1–2), 2008, % CR5 lunempr09 Share of long-term unemployment (12 months and more), percentage of total
unemployment, 2009, %
Eurostat
unempy08 Youth unemployment rate, 2008, % CR5
unhump07 UN Human Poverty Index (between 0–100), 2007 CR5
Appendix 3 Indicators of Dynamic Revealed Competitiveness
Code Denomination Source
empl08-00 Change of the employment rate of the age group 20–64, 2000–2008 CR5 disp07/00 Change of the disposable income of private households (purchasing
power standard based on final consumption per inhabitant), 2007/2000, %
Eurostat
prodgr07/00 Change of the labour productivity in industry and services (GVA per employee, in the average of EU27), 2007/2000, %
CR5
Appendix 4 Factors and their Components
Factors Denomination Components
Factor 1: HCD Human capital: human development, workforce attraction and patents
eudev07 EU Human Development Index (0–100), 2007, % 0.701
mwork78 That proportion of people from the active age population who moved into the region from outside in the past 2 years (from within the EU, 2007–2008, %
0.684
pat1607 Patent applications to the European patent office (EPO), average 2006–2007, per inhabitant
0.614 age25–64 The proportion of people aged 25–64 in the total population, 2004, % -0.819 weeklyh10 The number of average weekly hours worked (in full-time job), 2010,
hour
-0.906 Factor 2: RTD Research and technological development
fp707 7th framework programme, average funding per head (EU27=100),
%
0.866 gerd07 Total intramural R&D expenditure (GERD), percentage of GDP, 2007,
%
0.820 emphigh08 Employment in high-technology sectors within the number of total
employed, 2008, %
0.642
lisbind08 Lisbon Index (0–100), 2008 0.602
gfcf07 Gross fixed capital formation per inhabitant (all NACE activities), 2007, Euro
0.544 Factor 3: SCP Social capital: poverty
povrisk08 The proportion of the population subjected to poverty even after receiving social benefits, 2008, %
-0.733 lowedu08 Population aged 25–64 with low education (ISCED 1–2), 2008, % -0.869 unhump07 UN Human Poverty Index (between 0–100), 2007 -0.915 Factor 4: SCU Social capital: unemployment
lunempr09 Share of long-term unemployment (12 months and more), percentage of total unemployment, 2009, %
0.965
unempr09 Unemployment rate, 2009, % 0.955
unempy08 Youth unemployment rate, 2008, % 0.688
Factor 5: HCH Human capital: high education
tertedu34 Population aged 30–34 with a tertiary education (ISCED 5–6), 2008, % 0.741 adedu08 Population aged 25–64 with tertiary education (ISCED 5–6), 2008, % 0.684 indust05 Employment in industry (% of total employment), 2005, % -0.881
References
Parkinson M et al (2006) State of the English Cities. A research study. Volume 1. Office of the Deputy Prime Minister, London
Barkley DL (2008) Evaluations of regional competitiveness: making a case for case studies. The review of regional studies 2:212–143
Berumen SA (ed) (2008) Cambio tecnolo´gico e innovacio´n en las empresas. ESIC Editorial, Madrid Bristow G (2010) Critical reflections on regional competitiveness. Routledge, London
Camagni R (2002) On the concept of territorial competitiveness: sound or misleading? Urban Stud 13:2395–2411
Camagni R, Capello R (2010) Macroeconomic and territorial policies for regional competitiveness: an EU perspectives. Reg Sci Policy Pract 1:1–19
Capello R (2007) Regional economics. Routledge, London
Dijkstra L, Annoni P, Kozovska K (2011) A new regional competitiveness index: theory, methods and findings. Working papers no. 02/2011, European Commission, Directorate-General for Regional Policy, Brussels
EC (1999) Sixth periodic report on the social and economic situation and development of regions in the European Union. European Commission, Luxembourg
EC (2001) Second report on economic and social cohesion. European Commission, Brussels EC (2008) European competitiveness report 2008. European Commission, Brussels
Farkas B (2011) The Central and Eastern European model of capitalism. Post-Commun Econo 23:15–34 Gardiner B, Martin R, Tyler P (2004) Competitiveness, productivity and economic growth across the
European Regions. Reg Stud 9:1045–1068
Huggins R (2003) Creating a UK competitiveness index: regional and local benchmarking. Reg Stud 1:89–96
Kitson M, Martin R, Tyler P (2004) Regional competitiveness: an elusive yet key concept? Reg Stud 9:991–999
Krugman P (1994) Competitiveness: a dangerous obsession. Foreign Aff 2:28–44
Lengyel I (2004) The pyramid model: enhancing regional competitiveness in Hungary. Acta Oecono 3:323–342
Lengyel I (2009) Knowledge-based local economic development for enhancing competitiveness in lagging areas of Europe: the case of the University of Szeged. In: Varga A (ed) Universities, knowledge transfer and regional development: Geography, Entrepreneurship and Policy. Edward Elgar, Cheltenham–Northampton, pp 322–349
Lengyel B, Cadil V (2009) Innovation policy challenges in transition countries: foreign business R&D in the Czech Republic and Hungary. Trans Stud Rev 16:174–188
Lengyel B, Leydesdorff L (2011) Regional innovation systems in Hungary: the failing synergy at the national level. Reg Stud 5:677–693
Lengyel I, Rechnitzer J (2013) The competitiveness of regions in the Central European transition countries. Macrotheme Rev 2:106–121
Lengyel I, Szaka´lne´ Kano´ I (2012) Competitiveness of Hungarian urban microregions: localization agglomeration economies and regional competitiveness function. Regional statistics, vol. 52, special issue 2: 27–44
Lukovics M (2009) Measuring regional disparities on competitiveness basis. In: Bajmo´cy Z, Lengyel I (eds) Regional competitiveness, innovation and environment. JATE Press, Szeged, pp 39–53 Malecki EJ (2002) Hard and soft networks for urban competitiveness. Urban Stud 5–6:929–945 Martin R, Kitson M, Tyler P (eds) (2006) Regional competitiveness. Routledge, Abingdon
Pike A, Champion A, Coombes MG, Humphrey L, Tomaney J (2006a) The economic viability and self- containment of geographical economies: a framework for analysis. Office of the Deputy of Prime Minister, London
Pike A, Rodrı´gues-Pose A, Tomaney J (2006b) Local and regional development. Routledge, New York Porter ME (2007) Competitiveness: implications for Central Europe and the Czech Republic. Paper
presented in Prague, 22 October
Porter ME (2008) On competition Updated and expanded edition. Harvard Business Press, Boston Resch J (eds) (2008) Handbuch Lernende Regionen Grundlagen. O¨ sterreichisches Institut fu¨r
Erwachsenenbildung (O¨ IEB), Wien
Sinabell F (ed) (2011) Indikatoren fu¨r die Auswirkungen des Programms der La¨ndlichen Entwicklung 2007/2013 in O¨ sterreich. O¨sterreichisches Institut fu¨r Wirtschaftsforschung. Statistik Austria, Universita¨t fu¨r Bodenkultur Wien, Wien
Snieska V, Bruneckiene´ J (2009) Measurement of Lithuanian regions by regional competitiveness index.
Eng Econ 1:45–57
Storper M (1997) The regional world. The Guilford Press, New York
Szaka´lne´ Kano´ I, Vas Z (2013) Spatial distribution of knowledge-intensive industries in Hungary. Trans Stud Rev 19(4):431–444