THE EFFECT OF FOREIGN DIRECT INVESTMENT ON FIRM LABOR PRODUCTIVITY: DOES THE
COUNTRY OF ORIGIN OF THE FDI MATTER?
LÁSZLÓ TŐKÉS
Department of Macroeconomics, Corvinus University of Budapest, Hungary Email: laszlo.tokes@uni-corvinus.hu
Many papers have analyzed the effects of foreign acquisition on fi rm productivity, articulat- ing its positive impacts. However, an important issue remains: is there a general foreign acquisi- tion effect, or is there any heterogeneity in the effects? This paper reports on the analysis of over 3,400 majority foreign acquisitions in Hungary. The main result (which exists in a propensity score matching sample as well) of the difference-in-differences analysis is that only acquirers from higher income countries foster labor productivity signifi cantly – and this effect increases with the income gap between Hungary and the country of origin –, while acquirers from lower income countries do not induce statistically signifi cant effects.
Keywords: foreign acquisition, productivity, country of origin, heterogeneity JEL-codes: F21, D24
1. INTRODUCTION
Globalization and increasing international integration of economies gained mo- mentum at the end of the 20th century, and have been shaping the world since then.
One important aspect of this global phenomenon is the appearance and spread of foreign direct investment (FDI). Since the 1990s, an increasing trend can be seen in worldwide movements of FDI: enterprises started to move across the borders.
Figure 1 shows the importance of foreign-owned enterprises in the Visegrad Four (V4) economies (the Czech Republic, Hungary, Poland and Slovakia).
Figure 1 shows that based on their numbers, foreign-owned companies could be considered irrelevant in the host economy in the V4 countries. Only 10% of the enterprises are owned by foreigners in Poland, and the share is even smaller in the other three countries. Only 3.5% of the firms are owned by foreigners in Hungary. Although, considering other aspects, the message is different: foreign- owned companies do play a huge role in the V4 economies contrary to their low numbers. In all four countries foreign enterprises employ 25–30% of the employees, create 40–50% of value added, and account for 30–40% of gross
Figure 1. The role of foreign-owned companies in the V4 countries (2014) Source: calculations of the author based on date from OECD Stat.
Notes: Data is for 2014. Unit of measurement: figures of foreign-owned entities (number of firms, number of persons employed, value added, and gross investment) as a share of the national total (in percentages).
investments. Summing up, foreign-owned companies are relevant factors in the host countries, making their analysis worthwhile.
It is important to consider the differences between foreign firms and domestic ones. An extensive review of the literature reveals that foreign firms are more productive, pay higher wages and employ more workers. While the recent em- pirical literature is convincing, some relevant issues still remain unexplored. For example, only a few papers examine the heterogeneity of FDI. In this paper the question of whether the country of origin matters is addressed. Is there a general effect of foreign acquisitions on firm-level productivity, or do acquiring firms from high-income countries have a stronger impact, while acquirers from low- income countries smaller effect?
The main hypothesis of this paper is that the country of origin does matter:
acquirers from highly developed and high-income countries can transfer supe- rior technologies and advanced managerial practices, so they can improve la- bor productivity of the acquired firm. While, on the other hand, acquirers from underdeveloped and low-income countries cannot significantly improve the ac- quired firm’s labor productivity. I test this hypothesis using difference-in-differ- ences (DiD) methodology with propensity score matching. Both the full and the matched samples confirm my hypothesis: acquirers from a low-income country do not significantly improve labor productivity, while acquirers from a high- income country have a significant positive effect on the acquired firm’s labor productivity. Moreover, the effect of the “high-income acquirer” grows with the income of the country of origin.
The remainder of this paper is organized as follows. Section 2 gives a brief and selective literature review, presents the conclusions of the main papers. Section 3 describes the data in detail and the methodology used to examine the hypothesis.
Section 4 presents the results, and Section 5 puts forward conclusions.
2. RELATED LITERATURE
The topic of this paper was analyzed first from a theoretical and macro-empir- ical point of view: the foreign direct investment and economic growth nexus is investigated by a huge strand of literature, see for example Borensztein et al.
(1998), De Mello (1999), Choe (2003), or the surveys of Görg and Greenaway (2004), Faeth (2009), and Benacek et al. (2000) for Central and Eastern Europe.
As firm-level data became available, the research issue gained momentum: many researchers started to analyze the differences between foreign and domestic firms in order to develop deeper understanding of the FDI-growth nexus.
Foreign firms perform better: they are more productive and they pay higher wages. The productivity advantages of foreign firms have been the focus of the literature since the 1990s. Early papers show the superiority of foreign firms, but measure only correlation, not causality. Globerman et al. (1994) shows that for- eign-owned firms in Canada present higher value added per worker, although this difference vanishes with controlling for other firm characteristics, such as size and capital intensity. Howenstine and Zeile (1994) analyze US companies and find higher labor productivity in the case of foreign-owned companies. However, their results are not robust either, because when controlling for other characteris- tics, the productivity differences greatly shrink.
Early papers using small sample sizes and limited cross-sectional data are flawed by econometric problems, such as omitted variable bias and selection bias. The literature gained momentum with the appearance of panel data. Griffith (1999) studies the British car industry, and showes that foreign ownership and productivity growth appear hand in hand, but this is rooted in the diverse behav- ior of foreign firms – they invest more in physical capital and use more interme- diate goods. Conyon et al. (2002) also study British firms and show that there is a significant growth in labor productivity after foreign acquisitions of domestic firms. Javorcik (2004) studies spillover effects on Lithuanian firm-level data.
The use of panel data made it possible to control for time-invariant firm char- acteristics which can also have an impact on productivity. The spread of panel data and panel techniques was undoubtedly a great advance, but other problems still remained. One really acute question was the problem of selection. Many papers, such as Criscuolo and Martin (2009) or Balsvik and Haller (2010), docu- ment the cherry-picking behavior of foreign capital. Matching procedures and treating the selection bias were another milestone in the history of the literature.
Most of the papers using matching techniques and difference-in-differences anal- yses find significant foreign acquisition effects on productivity – see for example Petkova (2009) for India, Arnold and Javorcik (2009) for Indonesia, and Girma et al. (2007) for the UK.
Most previous studies make a moderately imprecise assumption, namely the homogeneity of foreign capital. Is it a realistic presumption that all FDI is the same? There are some papers in which heterogeneity by country of origin is not the focal theme, but is somehow touched upon. For example, Schiffbauer et al.
(2017), analyzing UK firms, find some evidence that acquirers from the USA have positive effects on total factor productivity, while foreign investment from EU countries does not have a significant impact. Similarly, Earle et al. (2017), working with Hungarian data, provide a thorough analysis on the effects of FDI on wages, and in a brief section they also investigate what happens with labor productivity after a foreign acquisition. They find a significant acquisition effect,
moreover they show some evidence that acquirers from more developed coun- tries have a stronger positive effect on labor productivity.
Chen (2011) uses firm-level data from the USA and checks the acquisition effects of FDI on financial performance. Chen shows that FDI increases profit- ability of the firms and the effect is larger when FDI comes from an industrial country rather than a developing country. Chari et al. (2012) also investigate US firms and show that FDI from emerging economies significantly increases the profitability of domestic firms, so not only does the traditional view remain that FDI from developed countries brings superior technology to developing markets, but also that FDI from developing countries can also generate positive changes.
Kamal (2015) analyzes two kinds of Chinese firms: firms which were acquired by OECD-based firms, and companies which were acquired by HMT (Hong Kong, Macao, and Taiwan) firms. That paper finds that OECD-acquisitions outperform HMT-acquisitions in total factor productivity (TFP) growth, concluding that the country of origin is relevant.
This paper’s contribution to the literature is the following: it uses a relatively large sample of Hungarian firms with detailed data on the country of origin and it analyzes the heterogeneity in the effects of foreign acquisition on firm productiv- ity, instead of financial indicators, as is the case in papers such as Chen (2011), Chari et al. (2012) and Kamal (2015). Also, it uses the most up-to-date economet- ric techniques – difference-in-differences analysis with firm fixed effects, rein- forced by kernel matching – to make results as robust as possible.
3. DATA AND METHODOLOGY
3.1. Data source
The main source of the data used here is the annual reports of double-entry book- keeping firms, collected by the National Tax Administration of Hungary and processed by the Databank of the Centre for Economic and Regional Studies, Hungarian Academy of Sciences. Annual data between 1993 and 2013 was com- piled into a 21-year-long panel for analysis. The data about the country of origin1 of the acquiring firms comes from three different sources: (1) the Ministry of Public Administration and Justice, (2) the Zephyr dataset of a private company, Bureau van Dijk, which specializes in publishing business information and pri- vate company data, and (3) CEU Balance data. Merging the data created a unique
1 Country of origin means the nationality of the immediate investor, since, unfortunately, data for the ultimate beneficial owner is not available.
dataset containing nationality information for about 3,000 acquired companies.
A firm is defined in this paper as foreign-owned if the proportion of foreign own- ership is at least 50%. Finally, GDP data comes from the World Bank: the GDP per capita, PPP (constant 2011 international $) indicator was used.
Before the analysis some parts of the sample were dropped. Those firms which were foreign-owned throughout the entire sample period (since they cannot be used for identification in a difference-in-differences framework), or those which had more than two ownership changes, were dropped. So, firms with the follow- ing ownership patterns were kept: always domestic (at least 50% of the issued capital is owned by a domestic owner), domestic – foreign (acquisition), and domestic – foreign – domestic (acquisition, followed by a divestment). Only the industry and service sectors were analyzed, not the agricultural sector. The fol- lowing special sectors (according to Nace Rev. 2) were also dropped from the sample: public administration and defense (O), education (P), human health and social work activities (Q), other service activities (S), activities of households as employers (T), and activities of extraterritorial organizations and bodies (U).
Firms with zero employment or with missing estimation data were also dropped.
Figure 2. The role of foreign-owned companies in the Hungarian economy
Source: calculations by the author based on the Databank of the Centre for Economic and Regional Studies, Hungarian Academy of Sciences.
The final estimation sample contains 427,987 firms with 2,540,188 firm-years.
Detailed information is provided in Tables 1 and 2 in section 3.4.
3.2. The relevance of FDI according to the data
Is FDI important for the Hungarian economy? Considering foreign-owned firms and their activities, the answer is a definite yes. Figure 2 shows the weight of foreign-owned companies: the foreign share in the number of firms, in total em- ployment, and in total value added.
Considering all the double-entry bookkeeping firms in Hungary, it is clear that foreign-owned companies play a dominant role. The proportion of foreign firms has not been so significant, starting at 10% at the beginning of the 1990s, decreasing to 7% by the beginning of the 2010s. On the other hand, this relatively small number of firms currently employs about 25 to 30% of the workforce, and produces about 45 to 50% of the total value added.
3.3. Estimation methods and the main variables
The dependent variable of the estimations is the log of labor productivity (LP), which is defined as total sales divided by the total number of employees.2 The key independent variable is a measure of acquisition, or foreign direct investment (FDI). Finally, it was also necessary to control for time periods, firm fixed effects and different firm characteristics. Considering the following model:
0 1 1 2 3 ,ln LPit β β FDIit β dfd3it β Xit YIt αi εit (1) where i indexes firms and t indexes years, FDI is a dummy variable which takes the value of 1 if the firm is controlled by foreign owners and 0 if not, and β1 is the foreign effect, the parameter of interest. In most specifications FDI is detailed and subsampled based on the country of origin, which is detailed later in this paper. Dfd3 is a dummy variable which equals 1 if a foreign-owned firm is sold to a domestic owner, so β2basically measures the difference between the pre- acquisition and post-divestment labor productivity. X is the vector of the follow- ing firm characteristics:
2 As a robustness check, another definition of LP was also used: total value added divided by the total number of employees. Using this definition of the dependent variable makes the coef- ficients smaller (and in some cases statistically insignificant), but the main messages still hold both in the full, and the matched samples.
• The logarithm of capital intensity, which is measured as the fraction of the total value of tangible assets and the total number of employees. Capital equips employees with tools to make them productive, so higher capital in- tensity should result in higher productivity.
• Size measurement dummy variables: small, when the total number of em- ployees is between 1 and 19, medium (this is the reference category), when the total number of employees is between 20 and 99, and large when the total number of employees is over 100. The relationship between the size of a firm and its labor productivity is well documented: the literature shows that there is a significant connection between these two characteristics, see for example Leung et al. (2008).
• Firm age dummy variables from 1, 2, … to 20+. Firm age is measured in years and calculated as the difference between the particular year and the year of foundation. Productivity can be influenced by firm age. On the one hand, as the vintage capital theory – see for example Nelson (1964) – sug- gests, younger firms can produce with greater efficiency than older ones.
On the other hand, productivity may increase with age through learning-by- doing, as Jovanovic and Nyarko (1996) documented.
• Region dummy variables, with the following seven big geographical regions of Hungary: Northern Hungary, Northern Great Plain, Southern Great Plain, Central Hungary, Central Transdanubia, Western Transdanubia, and South- ern Transdanubia. A strand of literature emphasize the spatial dimensions of productivity, there can be regions where firms gain productivity advan- tages due to spillover effects and externalities. See for example the survey of Rosenthal and Strange (2004).
Finally, YIt represents industry – year interactions to capture industry-specific shocks, αi are firm fixed effects to capture time-invariant firm-specific character- istics which could also influence labor productivity, and εit is an error term.
Four different specifications are considered. In the first specification (SPEC1) the effect of majority foreign acquisitions is measured using an FDI dummy vari- able, which equals 1 if the particular firm has foreign owners, and 0 if not. This is a benchmark specification, since this is the one which is estimated in most cases in the literature – of course, with different control variables. According to previous research, we expect a positive and statistically significant FDI coef- ficient here. In the second specification (SPEC2) the null hypothesis is tested as to whether the effect of the acquisition positively depends on the income of the country of origin. Many papers (for example Wagner 2006) document that the most productive firms serve foreign markets via foreign direct investment. These firms also export their superior technologies and management practices, so the acquired firms can absorb this knowledge. It is thus possible to assume that from
a highly productive country better (that is more productive) firms are involved in FDI-activities than from an economy with lower productivity. Since country- level productivity data is not so widely available, I proxy it with GDP per capita.
As many papers document, for example Goni and Maloney (2014), countries with higher incomes are involved more in R&D activities. Hence, the higher the income in a country, the better the available technologies and the access to superior production techniques, thus increasing an acquired firm’s productivity.
Here, instead of a simple FDI dummy as in SPEC1, a continuous variable, GDP per capita distance, is used, which measures the difference between the GDPs of Hungary and the FDI’s country of origin. In the third specification (SPEC3) the heterogeneity in the effects of the acquisition are measured in two distinct sub- samples. Instead of a simple FDI dummy as in SPEC1, a low income FDI dummy variable is used which equals 1 if the FDI comes from a low income country, that is, the country’s GDP per capita is less than Hungary’s. A high income FDI dummy variable is also used, which equals 1 if the FDI comes from a high in- come country, that is, the country’s GDP per capita is greater than Hungary’s. In specification four (SPEC4) SPEC2’s GDP distance variable is decomposed into two variables based on the two dummies of SPEC3. See the definition of the two key variables below:
1,
0 for foreign firms FDI otherwise
'
ln ,
0
GDP per capita of the FDI s country of origin
for foreign firms GDP per capita of Hungary
otherwise
GDP distance
These two variables are decomposed into subcategories in Specifications 3 to 4.
In Specification 3, two kinds of FDI are distinguished: (1) low income FDI, which is acquisition from a country poorer than Hungary, namely its GDP per capita is smaller than that of Hungary, and (2) high income FDI, which is acquisition from a country which is richer than Hungary, namely its GDP per capita is bigger than that of Hungary.3 The following equation holds for Specification 3:
it Low income it High inco it.
FDI FDI meFDI
3 There are a few acquisitions which change category (from high income to low income, of from low income to high income) over time. In these cases, their first position was used.
In Specification 4, there are two distance variables:
(1) , 1
0
GDP distance if FDI
GDP distance
otherwi
low income Low income
se
(2) , 1
0 GDP distance ifh FDI GDP distance
otherwis
igh income High incom
e e
3.4. Descriptive statistics
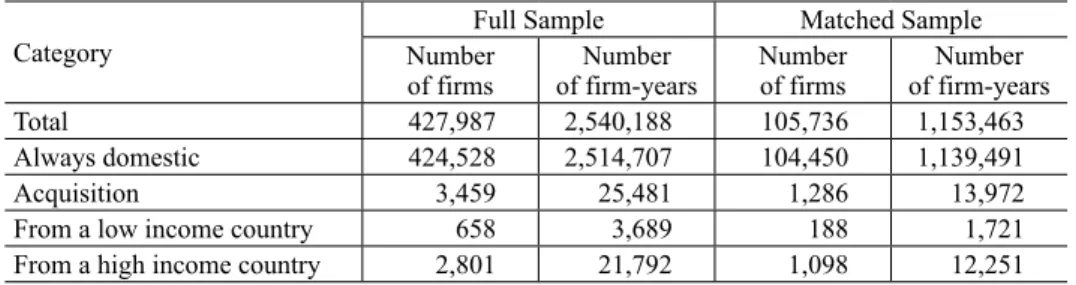
The full regression sample includes 3,459 firms that were at some time acquired by foreigners and 424,528 firms that have always been domestically owned.
Table 1 shows the number of firms and firm-years.
Table 1. Number of firms and firm-years in the full and matched samples
Category
Full Sample Matched Sample
Number
of firms Number
of firm-years Number
of firms Number of firm-years
Total 427,987 2,540,188 105,736 1,153,463
Always domestic 424,528 2,514,707 104,450 1,139,491
Acquisition 3,459 25,481 1,286 13,972
From a low income country 658 3,689 188 1,721
From a high income country 2,801 21,792 1,098 12,251
Source: compiled by the author.
Notes: a low income country is one where GDP per capita is smaller than that of Hungary; a high income country is one where GDP per capita is larger than that of Hungary.
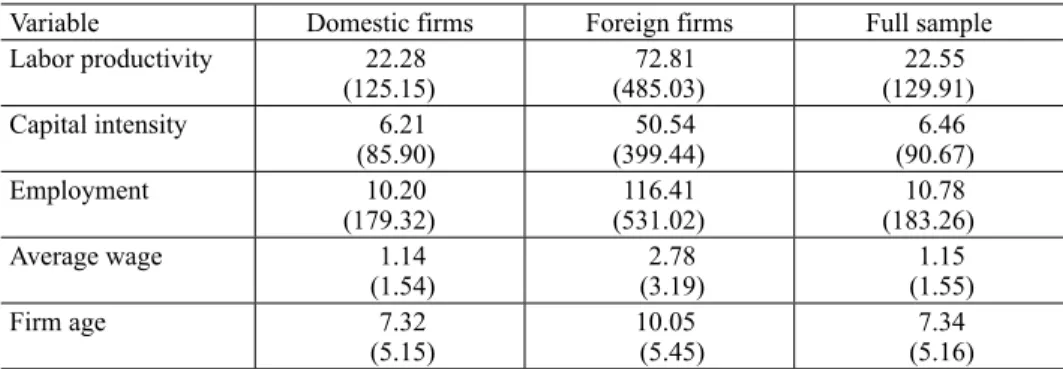
Table 2 shows the most important firm characteristics of the full sample. For- eign firms are more productive, use more capital intensive production procedures, employ more staff and pay higher wages on average. From this perspective, for- eign-owned firms stand apart from their domestic counterparts.
3.5. Matching procedure
Considering the full sample, as Table 2 shows, foreign-owned and domestic firms are notably different. Foreign-owned firms are more productive, use more capi- tal-intense production procedures, employ more staff and on average pay higher wages. If potential foreign acquirers are looking for firms with more potential and more opportunities, then this so-called cherry-picking behavior creates a selection bias and distorts the results. To control for this potential problem, a
difference-in-differences method was used with propensity score matching,4 as described in Rosenbaum and Rubin (1983). Constructing a control group (always domestic firms) as similar as possible to the treated group (firms acquired by foreigners) reduced the selection bias, since we are comparing treated firms with similar (based on their propensity score) control firms.
The matching process includes those firms which existed (with non-missing data) for at least one year before and also two years after the treatment period.
Subject to these restrictions, the following probit model (2) is used to predict the propensity scores.
0 1 1 2 1 3 1
5 1 6 1 7 1
1
{ l
Pr( ) n ln ln
ln }
it it it it
it
LP avgw emp
Ca ns CQ
I A
p
β β β β
Ö
β Dyearit β Dindit β Dageit
(2) where LP is the labor productivity, avgw is the average wage (equal to total wage bill per total employment), emp is the number of employees, CapIns is the capital intensity, Dyear is a vector of year dummy variables, Dind is a vector of industry (21 broad industry categories were constructed) dummy variables and Dage is a vector of firm-age dummy variables. The dependent variable, ACQit is a dummy variable which takes the value of 1 if firm i is acquired by foreigners in that particular year, t and 0 otherwise. So, the probit model in (2) measures the prob- ability of being acquired by foreigners in year t.
4 Matching was implemented in Stata, using the psmatch2 command of Leuven and Sianesi (2003).
Table 2. Main characteristics of the firms in the full sample
Variable Domestic firms Foreign firms Full sample
Labor productivity 22.28
(125.15) 72.81
(485.03) 22.55
(129.91)
Capital intensity 6.21
(85.90) 50.54
(399.44) 6.46
(90.67)
Employment 10.20
(179.32) 116.41
(531.02) 10.78
(183.26)
Average wage 1.14
(1.54) 2.78
(3.19) 1.15
(1.55)
Firm age 7.32
(5.15) 10.05
(5.45) 7.34
(5.16) Source: compiled by the author.
Notes: Averages and standard deviations (in parentheses) are presented. N = 2,540,188 firm-years. Labor produc- tivity (total sales revenue per employee), capital intensity (total value of tangible assets per employee) and aver- age wage (total wage bill per employee) are in million HUF, employment is in capita, and firm age is in years.
The (2) probit estimation gives the result that firms with higher labor produc- tivity, higher average wages, larger staff and more capital intense production are more likely to be acquired by foreigners. All coefficients are statistically highly significant.5 In order to check the quality of the matching procedure, as suggest- ed by Imbens and Wooldridge (2009), a calculation was made of the normal- ized mean differences in the matching variables between the treated and control groups one year before the treatment, and all of the differences are below the threshold of 0.25, so they are acceptable.6
After computing the propensity scores using the (2) probit model, common support was enforced by dropping the treated (control) observations with high- er (smaller) propensity score than the largest (smallest) control (treated) firm’s score. On this common support a propensity score matching was implemented, forcing an exact year and industry match. This means that a foreign acquisition from year t and industry j is matched only with controls (that are always domestic firms) from year t and industry j. Two more restrictions were applied to make the matching procedure stricter: (1) the labor productivity of (t-1) of the controls should lie within a 10% bandwidth of that of the matched firm, and (2) the pro- pensity scores of the controls should lie within a 10% bandwidth of that of the matched firm.
The matching procedure permits multiple controls for the treated firms, and as- signs weights to controls based on distance, according to propensity scores, from the treated counterparts. Matches were found for 1,286 acquisitions, which is less (about 40%) than the number of acquisitions in the full sample. This decrease in the numbers is due to two factors: first, no restrictions of any kind were applied to the full sample, apart from the requirement of non-missing regression variables, while matching includes firms only with at least three non-missing years; and second, the matching procedure also contains restrictions, such as the common support, the exact industry and year matching, and the distance in propensity scores and labor productivity. So, the matched sample contains 1,286 treated and 104,450 control firms.
5 The coefficients and standard errors are the following: 0.103 (0.027) for the labor productivity, 0.343 (0.051) for the average wage, 0.302 (0.024) for the number of employees, and 0.112 (0.018) for the capital intensity.
6 The normalized mean differences are the following: 0.050 for the log labor productivity, 0.093 for the log average wage, 0.061 for the log employment, and 0.018 for the log capital inten- sity.
4. RESULTS
To check the effects of majority foreign acquisition on labor productivity, the full sample was used first, and equation (1) was estimated with the four different speci- fications, described in Section 3. Table 3 shows the results for Specifications 1 to 4.
Table 3. Full sample results, specifications 1 to 4
Variables SPEC1 SPEC2 SPEC3 SPEC4
Key variables
FDI 0.171***
(0.023) – – –
GDP distance – 0.141***
(0.030) – –
Low income FDI – – 0.119**
(0.057) –
High income FDI – – 0.179***
(0.025) –
Low income GDP
distance – – – –0.055
(0.061) High income GDP
distance – – – 0.221***
(0.032) Main control variables
Capital intensity 0.159***
(0.001) 0.159***
(0.001) 0.159***
(0.001) 0.159***
(0.001) Size: small 0.181***
(0.005) 0.181***
(0.005) 0.181***
(0.005) 0.181***
(0.005) Size: large –0.241***
(0.016) –0.241***
(0.016) –0.241***
(0.016) –0.241***
(0.016)
R2 0.102 0.102 0.102 0.102
Notes: Fixed-effect estimations of Specifications 1 to 4 of equation (1), described in Section 3. N = 2,540,188 firm-years. Standard errors (corrected for firm clustering) are shown in parentheses. *** = significant at 0.01;
** = significant at 0.05. All models include a divestment effect dummy, year-industry interactions, region and firm-age controls.
Considering Specification 1, a significant foreign effect is shown – a foreign acquisition increases labor productivity by about 19%. It can also be seen that this effect grows with the income of the country of origin, as Specification 2 shows.
There is a coefficient of 0.141, and the effect is statistically significant: the higher the income in the country of origin the higher the productivity effect.
However, it seems that there is a kind of threshold below which FDI has weak- er effect: Specification 3 shows that acquisition has a smaller (and also, statisti- cally weaker) effect on labor productivity when it comes from a country poorer
than Hungary.7 Low income countries’ FDI has a coefficient of 0.119, while the effect of high-income countries’ FDI is higher and statistically more significant:
a foreign acquisition from a high-income country increases labor productivity by about 20%. Specification 4 shows that if a country is not richer than Hungary then the GDP distance does not matter, as we can see the statistically insignificant coefficient of –0.055. On the other hand, when FDI comes from a high income country, then the GDP distance matters – the bigger the distance, in other words, the higher income the country of origin has, the bigger the effect of acquisition on labor productivity as well, as the coefficient of 0.221 shows.
Considering the control variables, it can be concluded that firms with more capital intense production are characterized by higher labor productivity, and la- bor productivity shrinks with size and age.
So, as the results of Table 3 show, acquisitions from low income countries have a smaller effect on the acquired firm’s labor productivity, while acquisitions from high income countries have a bigger one.
As explained before, a selection bias could have distorted the results of the full sample, so a matched sample was created to reduce this potential bias. Table 4 shows the estimation results on the matched sample.
Considering Tables 3 and 4, some evidence of selection can be seen, since the coefficients are smaller in Table 4 than in Table 3. This implies that the results of Table 3 could be distorted by selection bias. However, only a part of the effects is due to selection, since all the key coefficients of Table 4 remained statistically significant. Considering Specification 1, foreign acquisition increases labor pro- ductivity by about 9%, and the effect seems to increase with income (SPEC2) – as it was in the full sample, as well. Distinguishing between acquisitions from low income and high income countries, it can be seen that FDI from low income countries does not increase labor productivity, while FDI from high income coun- tries has a significant effect of about 9%. Moreover, in the case of the FDI from high income countries, the GDP distance matters: the richer the country the big- ger the effect, as the coefficient of 0.115 shows8.
Summing up the results, it is clear that foreign acquisitions increase firm pro- ductivity in general. However, this effect is heterogeneous since only acquisi- tions from high income countries increase labor productivity significantly. Com- paring full and matched samples, there is some evidence of selection bias and cherry-picking, but there is a true acquisition effect, as well. Acquisitions from
7 The coefficient becomes statistically insignificant when LP is defined based on total value added.
8 The coefficients of GDP distance both in Specification 2 and 4 become statistically insignifi- cant when LP is defined based on the total value added.
high-income countries have a large and significant effect, but acquirers from low- income countries also increase labor productivity, although the effect is smaller and statistically insignificant.
5. CONCLUSION
Since Hungary’s transition to democracy in 1989 and its subsequent involvement in global relationships, foreign direct investment has been a relevant issue. The importance of foreign-owned companies in the Hungarian economy is beyond question. Many papers have shown that the presence of foreign ownership is very advantageous for the host country – foreigners import superior technologies and good management practices, which can also produce spillover effects. The present paper also confirms the positive productivity impact: the average effect of majority foreign acquisition on firm labor productivity is 19% in the full, and 9% in the matched sample.
Table 4. Matched sample results: Specifications 1 to 4
Variables SPEC1 SPEC2 SPEC3 SPEC4
Key variables
FDI 0.085***
(0.025) – – –
GDP distance – 0.080**
(0.037) – –
Low income FDI – – 0.058
(0.071) –
High income FDI – – 0.089***
(0.027) –
Low income GDP
distance – – – –0.018
(0.088) High income GDP
distance – – – 0.115***
(0.036) Main control variables
Capital intensity 0.167***
(0.007) 0.166***
(0.007) 0.167***
(0.007) 0.167***
(0.007)
Size: small 0.178***
(0.025) 0.179***
(0.025) 0.179***
(0.025) 0.179***
(0.025)
Size: large –0.170***
(0.039) –0.168***
(0.039) –0.170***
(0.039) –0.169***
(0.039)
R2 0.153 0.153 0.153 0.153
Notes: Fixed-effect estimations of Specifications 1 to 4 of equation (1), described in Section 3. N = 1,153,450 firm-years. Standard errors (corrected for firm clustering) are shown in parentheses. *** = significant at 0.01;
** = significant at 0.05. All models include a divestment effect dummy, year-industry interactions, region and firm-age controls.
Moreover, an important aspect of this phenomenon is also answered in this paper: there is heterogeneity in the effects of acquisitions based on the acquirer’s country of origin. The analysis of about 3,400 acquisitions revealed that acquisi- tions from low income countries do not significantly increase labor productivity (the effect is small and statistically less significant). Acquirers from countries which have higher income than Hungary have a positive and statistically signifi- cant effect of about 20% on the acquired firms’ labor productivity.
In order to manage the selection bias that can occur due to the potential cherry- picking behavior of foreign acquirers, a propensity score-based matching sample was made to execute difference-in-differences analysis on a subsample of similar domestic and acquired firms. Some evidence for selection bias was shown, as the coefficients of the matched sample decreased compared to the full sample, but the main messages still hold: only acquisitions from high-income countries have statistically significant positive effect on firm productivity, and this effect grows with the income of the country of origin.
REFERENCES
Arnold, J. M. – Javorcik, B. S. (2009): Gifted Kids or Pushy Parents? Foreign Direct Investment and Plant Productivity in Indonesia. Journal of International Economics 79(1): 42–53.
Balsvik, R. – Haller, S. A. (2010): Picking “Lemons” or Picking “Cherries”? Domestic and Foreign Acquisitions in Norwegian Manufacturing. The Scandinavian Journal of Economics 112(2):
361–387.
Benacek, V. – Gronicki, M. – Holland, D. – Sass, M. (2000): The Determinants and Impact of FDI in Central and Eastern Europe: A Comparison of Survey and Econometric Evidence. Transna- tional Corporations 9(3): 163–212.
Borensztein, E. – De Gregorio, J. – Lee, J-W. (1998): How does Foreign Direct Investment Affect Economic Growth? Journal of International Economics 45(1): 115–135.
Chari, A. – Chen, W. – Dominguez, K. M. E. (2012): Foreign Ownership and Firm Performance:
Emerging-Market Acquisitions in the United States. IMF Economic Review 60(1): 1–42.
Chen, W. (2011): The Effect of Investor Origin on Firm Performance: Domestic and Foreign Direct Investment in the United States. Journal of International Economics 83(2): 219–228.
Choe, J. I. (2003): Do Foreign Direct Investment and Gross Domestic Investment Promote Eco- nomic Growth? Review of Development Economics 7(1): 44–57.
Conyon, M. J. – Girma, S. – Thompson, S. – Wright, P. W. (2002): The Productivity and Wage Effects of Foreign Acquisition in the United Kingdom. The Journal of Industrial Economics 50(1): 85–102.
Criscuolo, C – Martin, R. (2009): Multinationals and U.S. Productivity Leadership: Evidence from Great Britain. The Review of Economics and Statistics 91(2): 263–281.
De Mello, L. R. (1999): Foreign Direct Investment-Led Growth: Evidence from Time Series and Panel Data. Oxford Economic Papers 51(1): 133–151.
Earle, J. S. – Telegdy, Á. – Antal, G. (2017): Foreign Ownership and Wages: Evidence from Hun- gary, 1986-2008. ILR Review 71(2): 458–491.
Faeth, I. (2009): Determinants of Foreign Direct Investment – A Tale of Nine Theoretical Models.
Journal of Economic Surveys 23(1): 165–196.
Girma, S. – Kneller, R. – Pisu, M. (2007): Do Exporters Have Anything to Learn from Foreign Multinationals? European Economic Review 51(4): 981–998.
Globerman, S. – Ries, J. – Vertinsky, I. (1994): The Economic Performance of Foreign Affi liates in Canada. Canadian Journal of Economics 27(1): 143–156.
Goni, E. – Maloney, W. F. (2014): Why don’t Poor Countries Do R&D? Policy Research Working Paper No. WPS 6811, Washington, DC: World Bank Group.
Görg, H. – Greenaway, D. (2004): Much Ado about Nothing? Do Domestic Firms Really Benefi t from Foreign Direct Investment? The World Bank Research Observer 19(2): 171–197.
Griffi th, R. (1999): Productivity and Foreign Ownership in the UK Car Industry. The Institute for Fiscal Studies Working Paper W99/11.
Howenstine, N. G. – Zeile, W. J. (1994): Characteristics of Foreign-Owned U.S. Manufacturing Establishments. Survey of Current Business 74(1): 34–59.
Imbens, G. W. – Wooldridge, J. M. (2009): Recent Developments in the Econometrics of Program Evaluation. Journal of Economic Literature 47(1): 5–86.
Javorcik, B. S. (2004): Does Foreign Direct Investment Increase the Productivity of Domestic Firms? In Search of Spillovers through Backward Linkages. American Economic Review 94(3):
605–627.
Jovanovic, B. – Nyarko, Y. (1996): Learning by Doing and the Choice of Technology. Economet- rica 64(6): 1299–1310.
Kamal, F. (2015): Origin of Foreign Direct Investment and Firm Performance: Evidence from For- eign Acquisitions of Chinese Domestic Firms. The World Economy 38(2): 286–314.
Leung, D. – Meh, C. – Terajima, Y. (2008): Firms Size and Productivity. Bank of Canada Working Paper 2008–2045.
Leuven, E. – Sianesi, B. (2003): PSMATCH2: Stata Module to Perform Full Mahalanobis and Propensity Score Matching, Common Support Graphing, and Covariate Imbalance Testing. Sta- tistical Software Components S432001, Boston College Department of Economics, revised 01 Feb 2018.
Nelson, R. R. (1964): Aggregate Production Functions and Medium-Range Growth Projections.
The American Economic Review 54(5): 575–606.
Petkova, N. (2009): Essays on Firm Ownership, Performance and Value. A dissertation paper, University of Michigan, https://deepblue.lib.umich.edu/bitstream/handle/2027.42/62412/
npetkova_1.pdf?sequence=1, accessed 16/02/2019.
Rosenbaum, P. R. – Rubin, D. B. (1983): The Central Role of the Propensity Score in Observational Studies for Causal Effects. Biometrika 70(1): 41–55.
Rosenthal, S. S. – Strange, W. C. (2004): Evidence on the Nature and Sources of Agglomeration Economies. In: Henderson, J. V. – Thiesse, J. F. (eds): Handbook of Regional and Urban Eco- nomics Vol. 4. Amsterdam: North Holland Publishing Co.
Schiffbauer, M. – Siedschlag, I. – Ruane, F. (2017): Do Foreign Mergers and Acquisitions Boost Firm Productivity? International Business Review 26(6): 1124–1140.
Wagner, J. (2006): Exports, Foreign Direct Investment, and Productivity: Evidence from German Firm Level Data. Applied Economics Letters 13(6): 347–349.
Open Access. This is an open-access article distributed under the terms of the Creative Commons Attribution 4.0 International License (https://creativecommons.org/licenses/
by/4.0), which permits unrestricted use, distribution, and reproduction in any medium, provided the original author and source are credited, a link to the CC License is provided, and changes – if any – are indicated. (SID_1)