Croatia Country report
Authors:
REKK: László Szabó, András Mezősi, Zsuzsanna Pató, Ágnes Kelemen (external expert), Enikő Kácsor and Péter Kaderják
TU Wien: Gustav Resch and Lukas Liebmann
We would like to thank József Feiler and Dries Acke (ECF), Christian Redl and Matthias Buck (Agora Energiewende), Dragana Mileusnić (CAN Europe), Dimitri Lalas (FACETS), Todor Galev and Martin Vladimirov (CSD) and Radu Dudau (EPG) and Neven Duić (Uni- versity of Zagreb) for their valuable insights and contributions to the SEERMAP reports.
ISBN 978-615-80939-1-0
Kosovo*, former Yugoslav Republic of Macedonia, Montenegro, Romania and Serbia.
Modelling for Croatia was carried out later, after the SEERMAP project was finalised. The implications of different investment strategies in the electricity sector are assessed for affordability, energy security, sustainability and security of supply. In addition to analyti- cal work, the project focuses on trainings, capacity building and enhancing dialogue and cooperation within the SEE region.
* This designation is without prejudice to positions on status, and it is in line with UNSCR 1244 and the ICJ Opinion on the Kosovo declaration of independence.
Further information about the project is available at: www.seermap.rekk.hu
Funding for the additional modelling for Croatia was provided by the European Climate Foundation.
The project was carried out by a consortium of 5 partners, and involved 9 local partners as subcontractors. The consortium was led by the Regional Centre for Energy Policy Research (REKK).
The Regional Centre for Energy Policy Research (REKK) is a Budapest Based think tank, and consortium leader of the SEERMAP project. The aim of REKK is to provide pro- fessional analysis and advice on networked energy markets that are both commercially and environmentally sustainable. REKK has performed comprehensive research, consult- ing and teaching activities on the fields of electricity, gas and carbon-dioxide markets since 2004, with analyses ranging from the impact assessments of regulatory measures to the preparation of individual companies' investment decisions.
The Energy Economics Group (EEG), part of the Institute of Energy Systems and Electrical Drives at the Technische Universität Wien (TU Wien), conducts research in the core areas of renewable energy, energy modelling, sustainable energy systems, and energy markets.
EEG has managed and carried out many international as well as national research projects founded by the European Commission, national governments, public and private clients in several fields of research, especially focusing on renewable- and new energy systems. The EEG of TU Wien is based in Vienna since 2001.
List of figures 4
List of tables 5
1 Executive summary 6
2 Introduction 8
2.1 Policy context 8
2.2 The SEERMAP project at a glance 8
2.3 Scope of this report 9
3 Methodology 10
4 Scenario descriptions and main assumptions 12
4.1 Scenarios 12
4.2 Main assumptions 13
5 Results 16
5.1 Main electricity system trends 16
5.2 Security of supply 18
5.3 Sustainability 20
5.4 Affordability and competitiveness 20
5.5 Sensitivity analysis 24
6 Policy conclusions 26
6.1 Main electricity system trends 26
6.2 Security of supply 27
6.3 Sustainability 28
6.4 Affordability and competitiveness 28
7 References 30
Annex 1: Model output tables 34
Annex 2: Assumptions 42
Assumed technology investment cost trajectories: RES and fossil 42 Infrastructure 42
Generation units and their inclusion in the core scenarios 44
Figure 1: The three models used for the analysis 11
Figure 2: The core scenarios 13
Figure 3: Installed capacity in the 3 core scenarios until 2050 (GW) in Croatia, 2020-2050 17 Figure 4: Electricity generation and demand (TWh) and RES share (% of demand) in Croatia, 2020-2050 17 Figure 5: Utilisation rates of conventional generation in Croatia, 2020-2050 (%) 18 Figure 6: Generation and system adequacy margin for Croatia, 2020-2050 (% of load) 19 Figure 7: CO₂ emissions under the 3 core scenarios in Croatia, 2020-2050 (mt) 21 Figure 8: Wholesale electricity price in Croatia, 2020-2050 (€/MWh) 21 Figure 9: Cumulative investment cost for 5 and 10 year periods, 2016-2050 (bn€) 22 Figure 10: Long term cost of renewable technologies in Croatia (€/MWh) 23 Figure 11: Average RES support per MWh of total electricity consumption and average wholesale price,
2016-2050 (€/MWh) 23
Figure 12: Cumulative RES support and auction revenues for 5 and 10 year periods, 2016-2050 (m€) 24 Figure 13: Generation mix (TWh) and RES share (% of demand) in the sensitivity runs in 2030 and 2050 25 Figure A1: New gas infrastructure investment assumed to take place in all scenarios 42
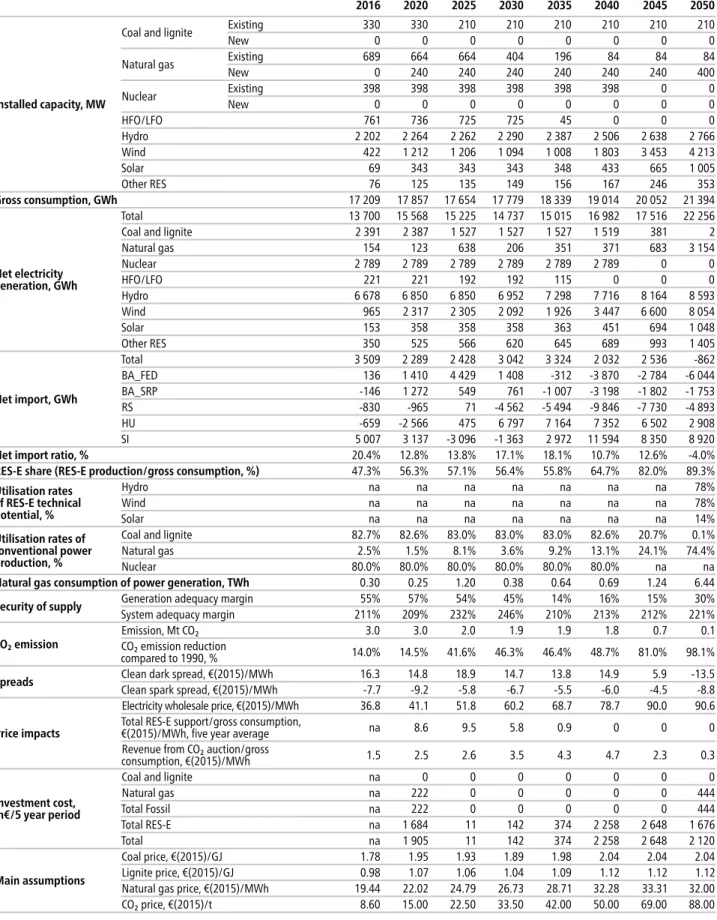
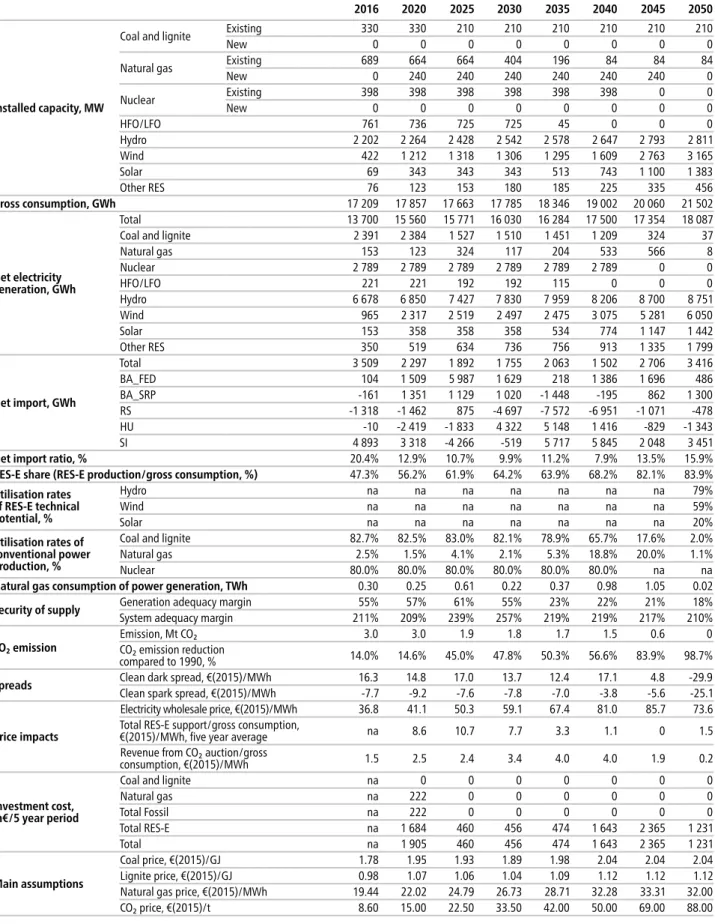
Table A1: ‘No target’ scenario 34
Table A2: ‘Delayed’ scenario 35
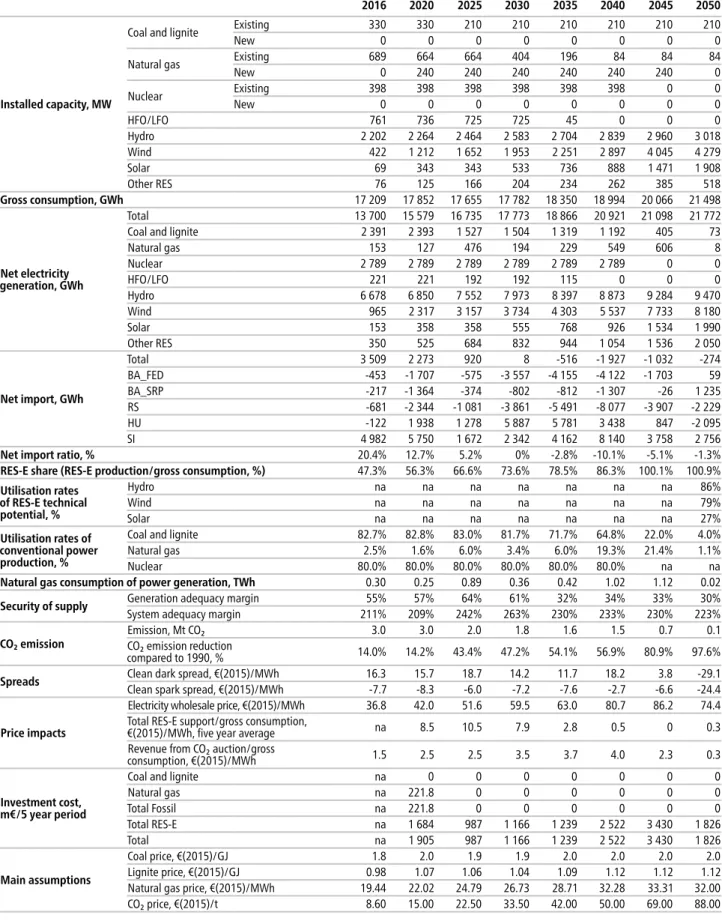
Table A3: ‘Decarbonisation’ scenario 36
Table A4: Sensitivity analysis – Low carbon price 37
Table A5: Sensitivity analysis – Low demand 38
Table A6: Sensitivity analysis – High demand 39
Table A7: Break down of cumulative capital expenditure by RES technology (m€) 40 Table A8: Development of support expenditures (for RES total) over time (5-year time periods) 40 Table A9: Assumed specific cost trajectories for RES technologies (2016 €/kW) 41
Table A10: New gas infrastructure in the Region 41
Table A11: Cross border transmission network capacities 42
Table A12: List of generation units included exogenously in the model in the core scenarios 43
1 | Executive summary
South East Europe is a diverse region with respect to energy policy and legislation, with a mix of EU member states, candidate and potential candidate countries. Despite this diversity, shared challenges and opportunities exist among the countries of the region. The electricity network of the South East Europe region is highly interconnected, energy policies are increasingly harmonised and the electricity market is increasingly integrated as a result of the EU accession process, the Energy Community Treaty and more recently the Energy Union initiative warranting a regional perspective on policy development.
A model-based assessment of different long term electricity investment strategies was carried out for the region within the scope of the SEERMAP project. The project builds on previous work in the region, in particular IRENA (2017), the DiaCore and BETTER EU research projects and the SLED project, as well as on EU level analysis, in particular the EU Reference Scenario 2013 and 2016. The current assessment shows that alternative solutions exist to replace current generation capacity by 2050, with different implications for affordability, sustainability and security of supply.
In Croatia, the current fossil fuel generation fleet is relatively new, so less than 25%
of this capacity will need to be decommissioned by the end of 2030. However, almost 85% of fossil fuel capacity is expected to be decommissioned by 2050. This provides a long term challenge to ensure a policy framework which will incentivise needed new investment, and an opportunity to shape the electricity sector over the long term in-line with a broader energy transition unconstrained by the current generation portfolio.
Three models covering the electricity and gas markets were used to assess the impact of 3 core scenarios:
•
The ‘no target’ scenario reflects the implementation of current energy policy (including implementation of renewable energy targets for 2020) combined with a CO₂ price (applied from 2030 onwards for non-EU states), but no 2050 CO₂ target in the EU and Western Balkans and a phasing out of RES support by 2025;•
The ‘decarbonisation’ scenario reflects a long-term strategy to significantly reduce CO₂ emissions according to indicative EU emission reduction goals for the electricity sector as a whole by 2050, driven by the CO₂ price and strong, continuous RES support;•
The ‘delayed’ scenario envisages initially low levels of RES support followed by a change in policy from 2035 onwards that leads to the same emission reduction target by 2050 as the ‘decarbonisation’ scenario. The attainment of the target is driven by the CO₂ price and increased RES support from 2035 onwards.The modelling work carried out under the SEERMAP project identifies the following key findings with respect to the different electricity strategy approaches that Croatia can take:
•
Croatia is expected to meet the overall decarbonisation target for the EU28 even without active support for renewable energy according to the model results. However, in the absence of support there will be delayed uptake and little growth in the share of renewables before 2040;•
If a long-term effort is implemented to achieve decarbonisation of the electricity sector RES support will be relatively high initially, slightly above 10 EUR/MWh, but will fall near to zero as RES technologies mature and the electricity wholesale price rises;•
Coal electricity production becomes insignificant under all scenarios by 2050. Although 210 MW coal capacity remains in the system in all scenarios, its share in electricity production drops to 0.3% or lower. The decline of coal from power generation is con- tinuous throughout the modelled time horizon, driven by the rising price of carbon and growing competitiveness of renewables. The coal capacity is therefore mostly idle by 2050.•
Throughout all scenarios, traditional gas and oil power plants have only a minor role in electricity production. Oil is phased out completely before 2040 and gas does not serve as a bridging fuel on the path towards decarbonisation in either of the modelled scenarios.•
One gas plant equipped with carbon capture and storage technology (CCS) comes online in 2050 in the ‘no-target’ scenario, suggesting that this technology will be com- petitive towards the end of the modelled time horizon under projected technology and fuel costs.•
Installed domestic generation capacity enables Croatia to satisfy its demand in all hours of the year in all scenarios despite high levels of renewables in the system. Thus Croatia’s system adequacy margin is also positive throughout the entire period.•
Compared to a scenario with no emission reduction target, decarbonisation policies do not drive up wholesale electricity prices. The price of electricity follows a similar trajectory under all scenarios and only diverges after 2045, when prices with more RES in the electricity mix are lower as a result of the low marginal cost of RES electricity production.•
There is a significant rise in the wholesale electricity price compared with current (albeit historically low) price levels. This occurs across the entire SEE region, and in fact the EU as a whole, in all scenarios for the modelled time period, driven by the increasing price of carbon and natural gas. Higher wholesale prices may adversely affect affordability, but also make investment in electricity generation more attractive to investors, thereby addressing the current underinvestment in the sector.•
Required investment levels are higher in the ‘decarbonisation’ scenario than in the ‘no target’ scenario, but only by 38%.A number of no regret robust policy recommendations across all scenarios can be provided based on the results:
•
The high penetration of RES in all scenarios suggests a policy focus on enabling RES integration; investing in transmission and distribution networks, enabling demand side management and RES production through a combination of technical solutions and appropriate regulatory practices, and promoting investment in storage solutions including hydro and small scale storage.•
RES potential can be maximized with the help of policies eliminating barriers to RES investment; de-risking policies that reduce high financing and high capital costs are especially relevant in the region and for Croatia, as it would allow for cost-efficient renewable energy investments.•
Regional level planning improves system adequacy compared with national plans emphasizing reliance on domestic production capacities.2 | Introduction
2.1 Policy context
Over the past decades EU energy policy has focused on a number of shifting priorities.
Beginning in the 1990s, the EU started a process of market liberalisation in order to ensure that the energy market is competitive, providing cleaner and cheaper energy to consumers. Three so-called energy packages were adopted between 1996 and 2009 addressing market access, transparency, regulation, consumer protection, interconnec- tion, and adequate levels of supply. The integration of the EU electricity market was linked to the goal of increasing competitiveness by opening up national electricity markets to competition from other EU countries. Market integration also contributes to energy security, which had always been a priority but gained renewed importance again during the first decade of the 2000s due to gas supply interruptions from the dominant supplier, Russia. Energy security policy addresses short and long term security of supply challenges and promotes the strengthening of solidarity between member states, completing the internal market, diversification of energy sources, and energy efficiency. (EC 2014)
Climate mitigation policy is inextricably linked to EU energy policy. Climate and energy were first addressed jointly via the so-called ‘2020 Climate and energy package’
initially proposed by the European Commission in 2008 (EC 2008). This was followed by the ‘2030 Climate and energy framework’ (EC 2014b), and more recently by the new package of proposed rules for a consumer centred clean energy transition, referred to as the ‘winter package’ or ‘Clean energy for all Europeans’ (EC 2016b). The EU has repeatedly stated that it is in line with the EU objective, in the context of necessary reductions according to the IPCC by developed countries as a group, to reduce its emissions by 80-95% by 2050 compared to 1990, in order to contribute to keeping global average temperature rise below 2°C compared with pre-industrial levels. The EU formally committed to this target in the ‘INDC of the European Union and its 28 Member States’. The 2050 Low Carbon and Energy Roadmaps reflect this economy-wide target.
The impact assessment of the Low Carbon Roadmap shows that the cost-effective sectoral distribution of the economy-wide emission reduction target translates into a 93-99% emission reduction target for the electricity sector (EC 2011a). The European Commission is in the process of updating the 2050 roadmap to match the objectives of the Paris Agreement, possibly reflecting a higher level of ambition than the roadmap published in 2011.
2.2 The SEERMAP project at a glance
The South East Europe Electricity Roadmap (SEERMAP) project develops electric- ity sector scenarios until 2050 for the South East Europe region. Geographically the SEERMAP project initially focused on 9 countries in South East Europe: Albania, Bosnia and Herzegovina, Kosovo* (in line with UNSCR 1244 and the ICJ Opinion on the Kosovo declaration of independence), former Yugoslav Republic of Macedonia (Macedonia), Montenegro and Serbia (WB6) and Bulgaria, Greece and Romania (EU3).
The modelling for Croatia was done separately within the framework of a follow-up
project. The SEERMAP region consists of EU member states, as well as candidate and potential candidate countries. For non-member states some elements of EU energy policy are translated into obligations via the Energy Community Treaty, while member states must transpose and implement the full spectrum of commitments under the EU climate and energy acquis.
Despite the different legislative contexts, the countries in the region have a number of shared challenges. These include an aged electricity generation fleet in need of investment to ensure capacity replacement, consumers sensitive to high end user prices, and challenging fiscal conditions. At the same time, the region shares opportu- nity in the form of large potential for renewables, large potential of hydro generation which can be a valuable asset for system balancing. South East Europe has a high level of interconnectivity, and high fossil fuel reserves, in particular coal, which is an important asset in securing electricity supply.
Taking into account the above policy and socio-economic context, and assuming that the candidate and potential candidate countries will eventually become member states, the SEERMAP project provides an assessment of what the joint processes of market liberalisation, market integration and decarbonisation mean for the electric- ity sector of the South East Europe region. The project looks at the implications of different investment strategies in the electricity sector for affordability, sustainability and security of supply.
The aim of the analysis is to show the challenges and opportunities ahead and the trade-offs between different policy goals. The project can also contribute to a better understanding of the benefits that regional cooperation can provide for all involved countries. Although ultimately energy policy decisions will need to be taken by national policy makers, these decisions must recognise the interdependence of invest- ment and regulatory decisions of neighbouring countries. Rather than outline specific policy advise in such a complex and important topic, our aim is to support an informed dialogue at the national and regional level so that policymakers can work together to find optimal solutions.
2.3 Scope of this report
This report summarises the contribution of the SEERMAP project to the ongoing policy debate on how to enhance the decarbonisation of the electricity sector in Croatia.
It presents the key results, offers a summary of key findings and formulates recom- mendations for policy makers in the region. Please note that further information on the analysis conducted on other SEERMAP countries can be found in the individual SEERMAP country reports, and a Regional Report (which does not include results for Croatia) is also produced.
3 | Methodology
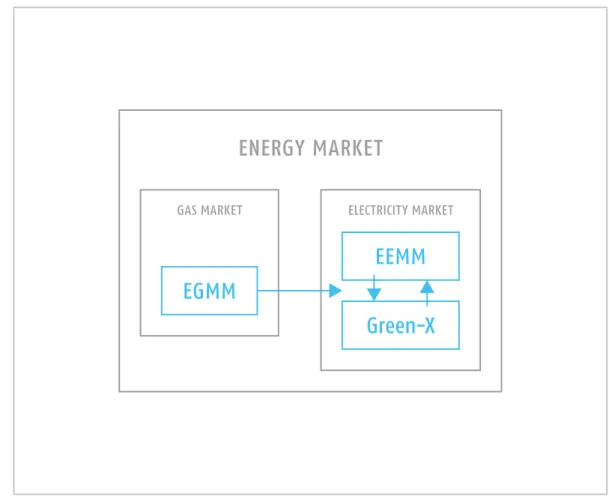
Electricity sector futures are explored using a set of three high resolution models incor- porating the crucial factors which influence electricity policy and investment decisions.
The European Electricity Market Model (EEMM) and the Green-X model together assess the impact of different scenario assumptions on power generation investment and dispatch decisions.
The EEMM is a partial equilibrium microeconomic model. It assumes that the elec- tricity market is fully liberalised and perfectly competitive. In the model, electricity generation as well as cross border capacities are allocated on a market basis without gaming or withholding capacity: the cheapest available generation will be used, and if imports are cheaper than domestic production, demand will be satisfied with imports.
Both production and trade are constrained by the available installed capacity and net transfer capacity (NTC) of cross border transmission networks respectively. Due to these capacity constraints, prices across borders are not always equalised. Investment in new generation capacity is either exogenous in the model, or endogenous (based on official policy documents). Endogenous investment is market-driven; power plant operators anticipate costs over the upcoming 10 years and make investment decisions based exclusively on profitability. If framework conditions (e.g. fuel prices, carbon price, available generation capacities) change beyond this timeframe then the utilisa- tion of these capacities may change and profitability is not guaranteed. The EEMM models 3400 power plant units in 40 countries, including the EU, Western Balkans, and countries bordering the EU. Power flow is ensured by 104 interconnectors between the countries, where each country is treated as a single node. The fact that the model includes countries beyond the SEERMAP region incorporates the impact of EU market developments on the SEERMAP region.
The EEMM model has an hourly time step, modelling 90 representative hours with respect to load, covering all four seasons and all daily variations in electricity demand.
The selection of these hours ensures that both peak and base load hours are repre- sented, and that the impact of volatility in the generation of intermittent RES technolo- gies on wholesale price levels is captured by the model. The model is conservative with respect to technological developments and thus no significant technological break- through is assumed (e.g. battery storage, fusion, etc.).
One shortcoming of the EEMM 90-hour modelling is when high share of volatile RES production (VRES) takes place, some of the extreme price volatility is not captured under specific weather conditions, when VRES is in power deficit. An additional short- coming is to ensure the balancing of the system, when VRES cannot produce electric- ity. Strong interconnection can ease this situation, as geographic smoothing would reduce the correlation between more distant producers, and trade can alleviate weather impacts. Although dispatchable hydro can also reduce this problem, a longer term drought can cause problems to hydro production as well. These problems can be reduced by demand response technologies, especially power to heat and electrification of transport, but these were not within the scope of the study. Also, for deep decar- bonisation full integration of power, heating, cooling, water and transport systems will be necessary. That would probably have to include power to e-fuels and power to gas technologies, needed to cover residual transport and balancing needs, which cannot be covered by renewable electricity, but that was out of the scope of this study.
The Green-X model complements the EEMM with a more detailed view of renewable electricity potential, policies and capacities. The model includes a detailed and harmo- nised methodology for calculating long-term renewable energy potential for each tech- nology using GIS-based information, technology characteristics, as well as land use and power grid constraints. It considers the limits to scaling up renewables through a technology diffusion curve which accounts for non-market barriers to renewables.
It also assumes that the cost of these technologies decrease over time, in line with global deployment (learning curves). The model also considers the different costs of capital in each country and for each technology by using country and technology specific weighted average cost of capital (WACC) values. Green-X models RES use in the heating and cooling sector as well, so the interaction of these sectors with the power sector is captured in the model, but in the EEMM modelling only the electricity produc- tion part is used for the scenario assessment. Thus, the interaction with the heating and cooling sector is only partially captured in the SEERMAP modelling.
An iteration of EEMM and Green-X model results ensures that wholesale electricity prices, profile based RES market values and capacities converge between the two models.
In addition to the two market models, the European Gas Market Model (EGMM) was used to provide gas prices for each country up to 2050. These modelled gas prices are then used as inputs for EEMM, as fuel price for natural gas based generators.
FIGuRE 1 THE THREE MODELS USED FOR THE ANALYSIS A detailed description of the models is provided in a separate document (“Models used in SEERMAP”)
4 | Scenario descriptions and main assumptions
4.1 Scenarios
From a policy perspective, the main challenge in the SEE region in the coming years is to ensure sufficient replacement of aging power plants within increasingly liberalised markets, while at the same time ensuring affordability, security of supply and a sig- nificant reduction of greenhouse gas emissions. There are several potential long-term capacity development strategies which can ensure a functioning electricity system. The roadmap assesses 3 core scenarios:
•
The ‘no target’ scenario reflects the implementation of current energy policy, with a phasing out of RES support by 2025 and no CO₂ target in the EU and Western Balkans for 2050;•
The ‘decarbonisation’ scenario reflects a continuous effort to reach significant reduc- tions of CO₂ emissions, in line with long term indicative EU emission reduction goal of 93-99% in the electricity sector as a whole by 2050;•
The ‘delayed’ scenario involves an initial low level of RES support followed by a change in policy direction from 2035 onwards, resulting in the realisation of the same emission reduction target in 2050 as the ‘decarbonisation’ scenario.The modelling work does not take into account the impacts of the new Large Combus- tion Plant BREF (Commission Implementing Decision of 2017/1442), as it entered into force in July 2017. As this Decision sets new standards for air pollutants also for fossil based electricity generators, it will influence the technical and economic lifetime of the existing power plant fleet, increasing the closure rates amongst outdated power plants.
The same emission reduction target of 94% was set for the EU28+WB6 region in the
‘delayed’ and ‘decarbonisation’ scenarios. This implies that the emission reductions will be higher in some countries and lower in others, depending on where emissions can be reduced most cost-efficiently.
The scenarios differ with respect to the entry of new technologies, included in the model in one of two ways: (i) the new power plants entered exogenously into the model based on policy documents, and (ii) the different levels and timing of RES support resulting in different endogenous RES investment decisions. The assumptions of the three core scenarios are the following:
•
In the ‘no target’ scenario we have assumed the continuation of current renewable support policies up to 2020 and the gradual phasing out of support between 2021 and 2025. The scenario assumes countries meet their 2020 renewable target but do not set a CO₂ emission reduction target for 2050. Although a CO₂ target is not imposed, producers face CO₂ prices in this scenario, as well as in the others.•
In the ‘decarbonisation’ scenario, a 94% reduction in CO₂ emissions is reached by 2050 for the whole EU+WB6. RES support in the model was calculated endogenously toenable countries to reach their decarbonisation target by 2050 with the necessary renewable investment. RES targets are not fulfilled nationally in the model, but are set at a regional level, with separate targets for the SEERMAP region and for the rest of the EU.
•
The ‘delayed’ assumes the continuation of current RES support policies up to 2020 with a slight increase until 2035. This RES support is higher than in the ‘no target’ scenario, but lower than the ‘decarbonisation’ scenario. Support is increased from 2035 to reach the same CO₂ emission reduction target as the ‘decarbonisation’ scenario by 2050.The scenarios result in different generation mixes and corresponding levels of CO₂ emissions, but also in different investment needs, wholesale price levels and patterns of trade.
4.2 Main assumptions
All scenarios share common framework assumptions to ensure the comparability of scenarios with respect to the impact of the different investment strategies over the next few decades. The common assumptions across all scenarios are described below.
Demand:
•
Projected electricity demand is based – to the extent possible – on data from official national strategies. Where official projections do not exist for the entire period until 2050, electricity demand growth rates were extrapolated based on the EU Reference scenario for 2013 or 2016 (for non-MS and MS respectively) (EC 2013, 2016). The PRIMES EU Reference scenarios assume low levels of energy efficiency and low levels FIGuRE 2THE CORE SCENARIOS
of electrification of transport and space heating compared with a decarbonisation scenario. The average annual electricity growth rate for the SEERMAP region as a whole is 0.74% over the period 2015 and 2050. The annual demand growth rate for countries within the region is varies significantly, with the value for Greece as low as 0.2%, and for Bosnia and Herzegovina as high as 1.7%. For Croatia, demand figures indicate an average annual growth rate between 0.64 – 0.66 % for the period of 2015 and 2050.
•
Demand side management (DSM) measures were assumed to shift 3.5% of total daily demand from peak load to base load hours by 2050. The 3.5% assumption is a con- servative estimate compared to other projections from McKinsey (2010) or TECHNOFI (2013). No demand side measures were assumed to be implemented before 2035. As the SEERMAP project models the electricity sector, the synergies between the power production sector and transport and heating and cooling is not fully captured in the results. However, concerning RES deployment, GREEN-X takes into account the various use of renewable resources in the heating and cooling sector.Factors affecting the cost of investment and generation:
•
Fossil fuel prices: Natural gas prices are derived from the EGMM model. The price of oil and coal were taken from IEA (2016) and EIA (2017) respectively. The price of coal is expected to increase by approximately 15% between 2016 and 2050; in the same period oil prices increase by around 250%, because of historically low prices in 2016.Compared to 2012-2013 levels this would mean an only 15-20% increase by 2050.
The gas price is differentiated by country, the increase in the price of gas in Croatia according to the EGMM is 65% between 2016 and 2050. The driving forces behind this significant price increase is the rising gas demand in the region (mainly in neighbour- ing countries, but having spill-over effect on Croatia) and the oil price trend assump- tions. The EU reference scenario also assumes over 50 % price increase in crude oil between 2016 to 2050, which is followed by a similar increase in natural gas prices (EC 2016)
•
Cost of different technologies: Information on the investment cost of new generation technologies is taken from EIA (2017).•
Weighted average cost of capital (WACC): The WACC has a significant impact on the cost of investment, with a higher WACC implying a lower net present value and therefore a more limited scope for profitable investment. The WACCs used in the modelling are country-specific, these values are modified by technology-specific and policy instru- ment-specific risk factors. The country-specific WACC values in the region are assumed to be between 10 and 15% in 2016, decreasing to between 9.6 and 11.2% by 2050.The value is highest for Greece in 2016, and remains one of the highest by 2050. In contrast, the WACC values for the other two EU member states, Romania and Bulgaria, are on the lower end of the spectrum, as are the values for Kosovo* and Macedonia. An 11.2% country-specific WACC was applied to Croatia for 2015, falling to 10.8% by 2050,
which is situated in the middle of the range in the region. Other studies estimating WACC values across the region confirm high values. (DIACORE, 2016)
•
Carbon price: a price for carbon is applied for the entire modelling period for EU member states and from 2030 onwards in non-member states, under the assumption that all candidate and potential candidate countries will implement the EU Emissions Trading Scheme or a corresponding alternative by 2030. The carbon price is assumed to increase from 33.5 EUR/tCO₂ in 2030 to 88 EUR/tCO₂ by 2050, in line with the EUReference Scenario 2016. (EC 2016) This Reference Scenario reflects the impacts of the full implementation of existing legally binding 2020 targets and EU legislation, but does not result in the ambitious emission reduction targeted by the EU as a whole by 2050. The corresponding carbon price, although significantly higher than the current price, is therefore a medium level estimate compared with other estimates of EU ETS carbon prices by 2050. For example, the Impact Assessment of the Energy Roadmap 2050 projected carbon prices as high as 310 EUR under various scenarios by 2050 (EC 2011b). The EU ETS carbon price is determined by the marginal abatement cost of the most expensive abatement option, which means that the last reduction units required by the EU climate targets will be costly, resulting in steeply increasing carbon price in the post 2030 period.
Infrastructure:
•
Cross-border capacities: Data for 2015 was available from ENTSO-E with future NTC values based on the ENTSO-E TYNDP 2016 (ENTSO-E 2016) and the 100% RES scenario of the E-Highway projection (ENTSO-E 2015b).•
New gas infrastructure: In accordance with the ENTSO-G TYNDP 2017 both the Transadriatic (TAP) and Transanatolian (TANAP) gas pipelines (see Annex II) are built between 2016 and 2021, and the expansion of the Revithoussa and the establishment of the Krk LNG terminals are taken into account. No further gas transmission infrastruc- ture development was assumed in the period to 2050.Renewable energy sources and technologies:
•
Long-term technical RES potential is estimated based on several factors including the efficiency of conversion technologies and GIS-based data on wind speed and solar irra- diation, and is reduced by land use and power system constraints. It is also assumed that the long term potential can only be achieved gradually, with renewable capacity increase restricted over the short term. A sensitivity analysis measured the reduced potential of the most contentious RES capacities, wind and hydro. The results of the sensitivity analysis are discussed in section 5.5.•
Capacity factors of RES technologies were based on historical data over the last 5 to 8 years depending on the technology.Annex II contains detailed information on the assumptions.
5 | Results
5.1 Main electricity system trends
Across all scenarios in Croatia for the modelled time horizon there is a gradual shift away from carbon intensive generation technologies. Croatia will significantly increase its current share of RES generation (including hydro), reaching between 84-101% by 2050 as a share of consumption in the different scenarios modelled. Fossil fuel based power generation mostly disappears except for a new gas power plant equipped with CCS in 2050 in the ‘no target’ scenario.
Coal generation capacity will not change significantly until 2050, falling from the current 330 MW to 210 MW in all scenarios. However, electricity production will decrease significantly under all scenarios from current levels, making up 0.3% or less of total electricity generation, primarily driven by the rising price of carbon.
The role of gas without CCS in the electricity mix is transitory. Gas capacity without CCS falls from the current 689 MW to 84 MW in all scenarios by 2050. The model does not add any new gas generation capacities during the modelled time horizon – only a single gas power plant equipped by CCS is added in the 2050 ‘no target’ scenario, accounting for 14% of electricity generation.
Croatia has a high renewable energy potential, and renewables become the dominant mode of electricity production by 2050, irrespective of the phasing out of renewable support. This is due to the increase in both the price of carbon and the price of gas. Around half of the approximately 8300 MW renewable generation capacity which is online by 2050 is wind and a third hydro in the ‘no target’ scenario. Both the
‘no target’ and ‘decarbonisation’ scenarios have similar levels of wind capacity by 2050, indicating that it is not primarily renewable energy support which drives investment for this technology. However, there is a notable difference between solar capacity in the two scenarios, which is almost double in the ‘decarbonisation’ scenario compared with the ‘no target’ scenario. Decentralised PV plays a major role in this capacity increase.
Investment in small scale solar installations is encouraged by the fact that these compete against end-user electricity prices, while other large scale renewables such as wind technology compete with the wholesale electricity price.
It is noteworthy that higher values of wind capacity and generation emerge in the
‘no target’ than the ‘delayed’ scenario. This is due to the higher market value of wind in the scenario with no renewable energy support scheme in the EU, as in this scenario there is more wind in the electricity system Europe-wide than in the ‘delayed’ scenario.
For the existing nuclear capacity (Krško nuclear power plant, shared with Slovenia), the assumption is that its lifetime will be extended to 2043 as stated by Slovenia’s government.
Croatia is a net importer of electricity in both the ‘no target’ and ‘delayed’ scenarios for most of the modelled time period with the exception of 2050, when the commis- sioning of the CCS-equipped gas capacity enables Croatia to export electricity. From 2030 in the ‘decarbonisation’ scenario, Croatia to is a net exporter due to its relative advantage in renewable energy potential. The following figure does not include the electricity import from the nuclear plant Krško, as it is treated as domestic production in the model.
FIGuRE 3 INSTALLED CAPACITY IN THE 3 CORE SCENARIOS UNTIL 2050 (GW) IN CROATIA, 2020-2050
FIGuRE 4 ELECTRICITY GENERATION AND DEMAND (TWh) AND RES SHARE (% OF DEMAND) IN CROATIA, 2020-2050
The decrease in the utilisation rates of fossil fuel plants reflects the eroding com- petitiveness of these technologies. Coal utilisation rates remain high until 2040, when they drop sharply to commercially unviable levels. Utilisation rates are above 80% in the ‘no target’ scenario until 2040 and above 70% in the ‘delayed’ and ‘decarbonisation’
scenarios until 2035. Gas utilisation rates are relatively low throughout the modelled period, with utilisation rates remaining below or around 20% in all scenarios in all years until 2050. In 2050 utilisation rates of gas without CCS drop to around 1% in the two scenarios with a decarbonisation target. However, in the ‘no target’ scenario, where a CCS-equipped gas plant is installed in 2050, gas utilisation rates increase to the very high level of around 75% in 2050.
5.2 Security of supply
Even though the physical and commercial integration of national electricity markets improves security of supply, concerns of decision makers often remain regarding the extent and robustness of this improvement, particularly in the context of a high share of renewables. In order to assess the validity of such concerns three security of supply indices were calculated for all countries and scenarios: the generation capacity margin, the system adequacy margin, and the cost of increasing the generation adequacy margin to zero.
The generation adequacy margin is defined as the difference between available capacity and hourly load as a percentage of hourly load. If the resulting value is negative then the load cannot be satisfied with domestic generation capacities alone FIGuRE 5
UTILISATION RATES OF CONVENTIONAL GENERATION IN CROATIA, 2020-2050 (%)
in a given hour, and imports are needed. The value of the generation adequacy margin was calculated for all of the modelled 90 representative hours, and of the 90 calculated values, the lowest generation adequacy margin value was taken into account in the generation adequacy margin indicator. For this calculation, assumptions were made with respect to the maximum availability of different technologies: fossil fuel based power plants are assumed to be available 95% of the time, hydro storage 100% of the time and for other RES technologies historical availability data was used. System adequacy was defined in a similar way, but net transfer capacity available for imports was considered in addition to available domestic capacity. This is a simplified version of the methodology formerly used by ENTSO-E. (See e.g. ENTSO-E, 2015, and previous SOAF reports)
For Croatia, the generation adequacy margin is positive throughout the whole modelling period in all scenarios, i.e. domestic generation capacity is sufficient to satisfy domestic demand in all hours of the year for all of the years modelled. The system adequacy margin is even higher.
In addition to the adequacy margin indicators, the cost of increasing the generation adequacy margin to zero was calculated for countries with initially negative values.
The cost of the required capacity was defined as the yearly fixed cost of an open cycle gas turbine (OCGT) which has the capacity to ensure that the generation adequacy margin reaches zero. This can be interpreted as a capacity fee, provided that capacity payments are only made to new generation, and that the goal of the payment is to improve generation adequacy margin to zero. Since the generation adequacy margin for Croatia was positive for all years across all scenarios, this cost is zero.
FIGuRE 6 GENERATION AND SYSTEM ADEqUACY MARGIN FOR CROATIA, 2020-2050
(% OF LOAD)
5.3 Sustainability
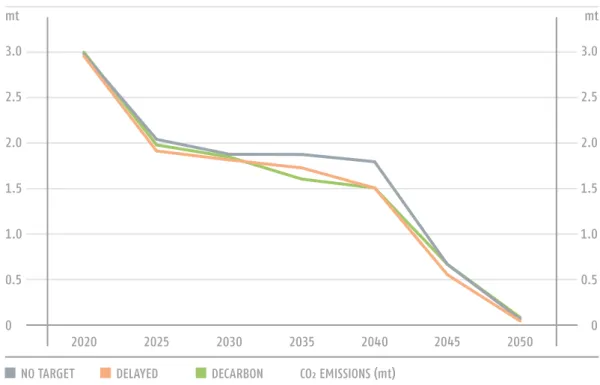
The CO₂ emissions of the three core scenarios were calculated based on representative emission factors for the region. Due to data limitations this calculation did not account for greenhouse gases other than CO₂ nor include emissions related to heat production from cogeneration.
The 94% overall decarbonisation target for the EU28+Western Balkans region translates into a higher than average level of decarbonisation in the Croatian electric- ity sector in all scenarios due to the high renewable energy potential of the country combined with the fact that in the ‘no target’ scenario CCS-equipped gas plants will be commercially viable by 2050 under the modelled market conditions.
The share of renewable generation as a percentage of gross domestic consumption is already high mostly as a result of hydro generation, with contribution from wind and other renewable sources. By 2030 the share of renewables reaches 56% in the ‘no target’ scenario, representing only a small increase from current levels. However, in the ‘decarbonisation’ scenario, the RES share is more than 73% in 2030, indicating the important role of renewable support early in the modelled period. By 2050 the share of renewables is 89% in the ‘no target’ and 101% in the ‘decarbonisation’ scenario. The utilisation of technical potential for hydro and wind is highest in the ‘decarbonisation’
scenario in 2050, reaching 86% and 79% respectively. The utilisation rate of technical potential for solar is only at 27% in 2050, indicating potential for further growth in the long term.
5.4 Affordability and competitiveness
In the market model (EEMM) the wholesale electricity price is determined by the highest marginal cost of the power plants needed to satisfy demand. The price trajec- tories are independent of the level of decarbonisation and similar in all scenarios, only diverging after 2045 when the two scenarios with decarbonisation targets result in lower wholesale prices. This is due to the fact that towards 2050 the share of renewa- bles is high enough to satisfy demand in most hours at a low cost, driving the average annual price down.
The price development has several implications for policy makers. Retail prices depend on the wholesale price as well as taxes, fees and network costs. It is therefore difficult to project retail price evolution based on wholesale price information alone, but it is an important determinant of end user prices and could affect affordability for consumers. The average annual price increase over the entire period is 2.68% in the
‘no target’, 2.06% in the ‘delayed’ and 2.09% in the ‘decarbonisation’ scenario, with lower growth in the latter two scenarios attributable to a fall in wholesale prices over the last 5 years of the modelled time period. Although the price increase is high, prices in Europe were at historical lows in 2016 for the starting point of the analysis and are projected to rise to approximately 60 EUR/MWh by 2030, similar to price levels 10 years ago. The price increase also has three positive implications, incentivising invest- ment for new capacities, incentivising energy efficiency and reducing the need for RES support.
The investment required for new capacities is around 38% higher in the ‘decarboni- sation’ scenario than in the ‘no target’ scenario. In all scenarios investment is highest towards the end of the modelled time horizon.
FIGuRE 8 WHOLESALE ELECTRICITY PRICE IN CROATIA, 2020-2050
(€/MWh) FIGuRE 7 CO₂ EMISSIONS UNDER THE 3 CORE SCENARIOS IN CROATIA, 2020-2050 (mt)
Investments are assumed to be financed by private actors based on a profitability requirement (apart from the capacities planned in the national strategies), factoring in the different cost structure of renewables, i.e. higher capital expenditure and low operating expenditure in their investment decisions.
Despite the significant investment needs associated with the ‘decarbonisation’
scenario, the renewables support needed to incentivise these investments remains low, initially at 8.5 EUR/MWh and rising to 10.5 EUR/MWh, and then 0.3 EUR/MWh towards the end of the modelled time horizon. The RES support relative to electricity cost (wholesale price plus RES support) is 16.8% at its highest level in the ‘decarboni- sation’ scenario. In the ‘delayed’ scenario, the rapid deployment of additional capaci- ties towards the end of the modelled time horizon that are needed to achieve 2050 decarbonisation targets will require slightly higher support than in the ‘decarbonisa- tion’ scenario.
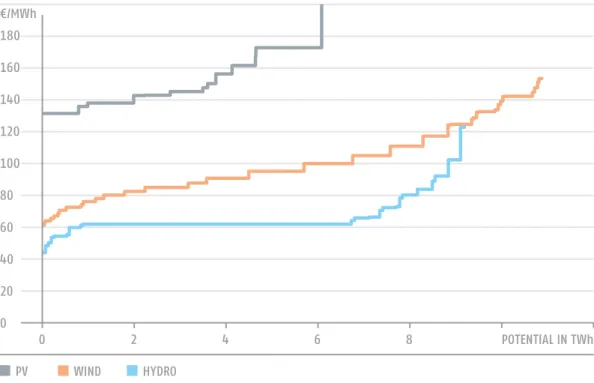
Although RES technologies are already at grid parity in some locations with costs falling further, some minimal amount of support will still be needed in 2050 to incen- tivise new investment. This is partly due to the locational impact: as the best locations with highest potential are used first, the levelised cost of new RES capacities might increase over time. The relationship between the cost of RES technologies and installed capacity is shown in Figure 10. The figure does not account for the learning curve impacts which were also considered in the Green-X model, but it accounts for the country specific capital cost of the various technologies (WACC).
In the ‘no target’ scenario, RES-support for new capacities is completely phased out by 2026. The need for support in the two other scenarios is partly explained by the fact that a relatively high utilisation rate of technical RES potential is foreseen by the FIGuRE 9
CUMULATIVE INVESTMENT COST FOR 5 AND 10 YEAR PERIODS, 2016-2050 (bn€)
FIGuRE 10 LONG TERM COST OF RENEWABLE TECHNOLOGIES IN CROATIA (€/MWh)
FIGuRE 11 AVERAGE RES SUPPORT PER MWh OF TOTAL ELECTRICITY CONSUMPTION AND AVERAGE WHOLESALE PRICE, 2016-2050
(€/MWh)
end of the period. This suggests that the locational effect, which increases the need for support, is greater than the effect of increasing wholesale electricity price, which reduces the need for additional support.
Renewable energy investments may be incentivised with a number of support schemes using funding from different sources; in the model sliding feed-in premium equivalent values are calculated. Revenue from the auction of carbon allowances under the EU ETS is a potential source of financing for renewable investment. Figure 12 contrasts cumulative RES support needs with ETS auction revenues, assuming 100%
auctioning, and taking into account only allowances to be allocated to the electricity sector.
Auction revenues are quite similar across all scenarios, sharing similar initial invest- ment levels in fossil fuel generation capacity. From a budgetary perspective, the ‘no target’ scenario is the most advantageous, with low RES support falling to zero after 2025 against auction revenues over 70 mEUR from 2031-40 and above 40 mEUR from 2041-50. On the other hand, the budgetary balance is especially favourable after 2030
when auction revenues are expected to exceed support needs.
5.5 Sensitivity analysis
In order to assess the robustness of the results, a sensitivity analysis was carried out with respect to assumptions that were deemed most controversial by stakeholders during consultations and tested for the following assumptions:
FIGuRE 12 CUMULATIVE RES SUPPORT AND AUCTION REVENUES FOR 5 AND 10 YEAR PERIODS, 2016-2050 (m€)
•
Carbon price: to test the impact of a lower CO₂ price, a scenario was run which assumed that CO₂ prices would be half of the value used for the three core scenarios for the entire period until 2050;•
Demand: the impact of higher and lower demand growth was tested, with a +/-0.25%change in the growth rate for each year in all the modelled countries (EU28+WB6), resulting in a 8-9% deviation from the core trajectory by 2050;
The changes in assumptions were only applied to the ‘decarbonisation’ scenario since it represents a significant departure from the current policy for many countries, and it was important to test the robustness of results in order to convincingly demonstrate that the scenario could realistically be implemented under different framework conditions.
The most important conclusions of the sensitivity analysis are the following:
•
The CO₂ price is a key determinant of wholesale price, with a 50% reduction in carbon price resulting in an approximately 33% decline in the wholesale price over the long term. However, to ensure that the same decarbonisation target is met higher RES support is required in the ‘low carbon value’ sensitivity scenario, and as a result the sum of the wholesale price and RES support is only about 5 EUR/MWh lower in this run than in the ‘decarbonisation’ scenario.•
A low CO₂ price does not change the outlook for coal and gas. These capacities both make an insignificant contribution towards electricity generation by 2050, as well as in the ‘decarbonisation’ scenario.FIGuRE 13 GENERATION MIX (TWh) AND RES SHARE (% OF DEMAND) IN THE SENSITIVITY RUNS IN 2030 AND 2050
•
In case of high demand increasing gas based generation substituting coal (not only in Croatia but in the whole region) less RES generation (wind and PV) is required to reach the emissions target. In the low demand scenario, the opposite effect occurs.6. | Policy conclusions
The modelling work carried out under the SEERMAP project identifies some key findings with respect to the different electricity strategy approaches that Croatia can choose.
We review these findings and suggest some policy relevant insights. The analysis has uncovered some robust findings which are relevant for all scenarios, based on which no regret policy options can be identified.
Main policy conclusions
Regardless of whether or not Croatia pursues an active policy to decarbonise its electricity sector, RES-based capacities will expand significantly:
•
Croatia is set to achieve a minimum of 84% of RES-share in electricity consumption under all modelled scenarios, reaching 101% in the ‘decarbonisation’ scenario;•
Conventional fossil fuel electricity production is largely phased out by 2050; gas and oil play a marginal role while coal loses its relevance over time. However, gas fired gen- eration equipped with CCS becomes a feasible low carbon technology by 2050 under certain market conditions;•
The high penetration of RES in all scenarios suggests that Croatia’s energy policy should focus on enabling RES integration;•
The ‘decarbonisation’ scenario demonstrates that an energy mix based on renewables only is feasible;•
Decarbonisation does not drive up wholesale prices relative to other less ambitious RES policy scenarios but, on the contrary, reduces them after 2045;•
Decarbonisation, resulting in a high share of RES and zero fossil fuel based genera- tion, does not pose a security of supply risk. Installed domestic generation capacity is capable of satisfying Croatia’s demand in all modelled seasons and hours of the day in all scenarios;•
‘Decarbonisation’ requires a 38% higher investment level than the ‘no target’ scenario over the entire time horizon until 2050. This implies that de-risking measures which can lower the cost of investment are important for Croatia.•
Choice of investment in gas network capacity will depend on whether Croatia pursues CCS-equipped gas fired generation capacity.6.1 Main electricity system trends
Croatia’s energy mix will shift significantly towards RES and away from fossil fuels by 2050 in all scenarios, with a significantly reduced role for (traditional,
non-CCS) coal, oil and gas. Hydro and wind capacities are likely to dominate the country’s renewable generation fleet throughout the projected time horizon.
Coal is phased out of electricity generation in all scenarios. Although 210 MW of coal capacity is remains in the electricity fleet, utilization approaches zero in all scenarios by 2050. Assuming strong interconnections with its neighbours, Croatian production will compete with other power plants in the region and the EU, markets driven by wholesale electricity and carbon price. This leaves coal power plants idle for most of the year by 2050 due to high carbon costs.
The country will face a policy choice regarding the role of natural gas. Gas is projected to play a very minor role in the ‘delayed’ and ‘decarbonisation’ scenarios.
However, in the ‘no target’ scenario a CCS plant comes online in 2050. This is, however, a long term development, with technology, fuel costs and carbon costs impossible to know with high certainty at this point in time. It is clear from the modelling that expansion of gas capacity will not be required over the short to medium term, allowing policymakers to delay decisions concerning gas development.
In all scenarios Croatia relies heavily on hydro, accounting for more than 40% of power generation by 2050, but the role of wind also increases significantly with wind reaching similar generation levels to hydro by 2050. The contribution from solar and other RES (mainly biomass) is near 5% and 6% respectively in the ‘no target’ scenario by 2050 and 8-10% in the two scenarios with a decarbonisation target.
The high penetration of RES in all scenarios suggests that a robust, no-regret action for Croatian energy policy should focus on enabling RES integration. This involves:
•
investing in transmission and distribution networks,•
enabling demand side management and RES production through a combination of technical solutions and appropriate regulatory practices, and•
promoting investment in storage solutions including hydro and small scale storage.6.2 Security of supply
Croatia is a net importer of electricity in both the ‘no target’ and ‘delayed’
scenarios for most of the modelled time period, until 2050 when the CCS-equipped gas power plant allows Croatia to export electricity. The ‘decarbonisation’ scenario enables Croatia to become a net exporter of electricity from 2030 onwards due to its relatively high renewable energy potential.
Croatia’s generation adequacy margin is positive for all years in all scenarios, meaning that the country has sufficient generation capacity to satisfy demand using only domestic capacity in all hours of all years.
In order to address challenges associated with intermittency that will characterize a large share of the installed RES generation capacity, Croatia should work on the no regret measures discussed above to enable a high share of RES penetration without compromising security of supply, involving demand side measures, increased network connections and storage solutions.
6.3 Sustainability
Croatia has high renewable potential, especially hydro and wind, and thus can make a higher than average contribution to Europe’s 2050 emission reduction targets compared to other countries. In Croatia CO₂ emissions in the electricity sector are reduced by close to 100% in all scenarios by 2050 compared with 2016.
Renewable potential can be harvested with policies eliminating barriers to RES invest- ment. A no-regret step involves de-risking policies addressing high financing costs and high cost of capital to allow for cost-efficient renewable energy investment.
6.4 Affordability and competitiveness
Decarbonisation of the electricity sector does not drive up wholesale electricity prices compared to a scenario with no emission reduction target. The wholesale price of electricity is not driven by the level of decarbonisation but by the CO₂ price, applied across all scenarios, and the price of natural gas, since natural gas based production is the marginal production unit (in the region) needed to meet demand in a significant number of hours of the year.
The wholesale price of electricity follows a similar trajectory under all scenarios and only diverges after 2045, when high levels of low marginal cost RES production puts downward pressure on wholesale electricity prices.
under all scenarios there is a significant rise in wholesale electricity prices compared with current (albeit historically low) price levels. This increase is driven by the price of carbon and natural gas, both of which increase significantly by 2050. While higher wholesale prices will likely transmit through to end user prices, affecting afford- ability, it will help to attract investment needed to replace outgoing capacity.
Ambitious decarbonisation policy will require higher levels of investment in generation capacity, with total investment in the ‘decarbonisation’ scenario 37%
more than the ‘no target’ scenario. However, the cost structure will change with higher up-front investment costs in exchange for lower operation (including fuel) and mainte- nance costs.
Although not modelled in full hourly detail, wholesale price volatility of electricity is also expected to increase, ceteris paribus, in a world with a high share of intermittent renewables. Demand and supply side measures such as increased storage capacity may mitigate volatility. Over the long term policy decisions will need to be made on how to deal with price volatility, and what the acceptable level of price volatility is consid- ering the costs of supply and demand side measures.
Due to the high initial investment costs of RES technologies, profitability is very sensitive to the cost of capital, which is higher in Croatia than in Western European member states.
Although much of the value of the cost of capital depends on country risk linked to the general macroeconomic performance of a country, the cost of capital can be reduced to some extent through interventions by policymakers. This begins with a stable policy framework and the rollout of de-risking measures. As outlined above, such measures should be considered no-regret steps minimising system costs and consumer expenditures.
While the need for RES support is initially high, reaching around 10 EuR/MWh, it is significantly reduced over the modelled time horizon due to increasing electricity wholesale prices that incentivise RES investment even without support over the long term.
DIACORE (2016): The impact of risks in renewable energy investments and the role of smart policies, Project Coordinator Fraunhofer ISI. EU Intelligent Energy Europe Programme, Contract N°: IEE/12/833/SI2.645735
Dominković, Dominik Franjo; Bačeković, Ivan; Ćosić, Boris; Krajačić, Goran; Pukšec, Tomislav; Duić, Neven; Markovska, Nataša, Zero carbon energy system of South East Europe in 2050 // Applied Energy 184; 1517–1528 (2016)
Duić, Neven, Is the success of clean energy guaranteed? // Clean Technologies and Environmental Policy, 17, 8, 2093-2100 (2015)
EC (2008) Communication of the Commission: Europe's climate change opportunity COM (2008) 30 final, and the Joint Impact Assessment on the Package of Implemen- tation measures for the EU's objectives on climate change and renewable energy for 2020, SEC(2008) 85/3
EC (2011) Communication from the Commission to the European Parliament, the Council, the European Economic and Social Committee and the Committee of the Regions. A Roadmap for moving to a competitive low carbon economy in 2050. COM(2011) 112 final
EC (2013) EU Energy, Transport and GHG Emissions Trends to 2050. Reference Scenario 2013.
(https://ec.europa.eu/transport/sites/transport/files/media/publications/doc/trends-to- 2050-update-2013.pdf)
EC (2014) Communication of the Commission: European Energy Security Strategy, COM (2014) 330 final
EC (2014b) Communication of the Commission: A policy framework for climate and energy in the period from 2020 to 2030 COM(2014) 15 final
EC (2016) EU Reference Scenario 2016. Energy, transport and GHG emissions Trends to 2050.
(https://ec.europa.eu/energy/sites/ener/files/documents/ref2016_report_final-web.pdf) EC (2016b) Communication of the Commission: Clean Energy For All Europeans, COM (2016) 860 final
Ecofys & Eclareon (2017): Mapping the cost of capital for wind and solar energy in South Eastern European Member States. (http://www.ecofys.com/files/files/ecofys-eclareon- 2016-wacc-wind-pv-south-east-europe.pdf)
7 | References
EIA (2017) Annual Energy Outlook 2017 with Projections to 2050. US energy Information Administration, January 2017. (https://www.eia.gov/outlooks/aeo/pdf/0383(2017).pdf) ENTSO-E (2015) Scenario Outlook and Adequacy Forecast 2015. Brussels, 2015. (https://
www.entsoe.eu/Documents/SDC%20documents/SOAF/150630_SOAF_2015_publication_
wcover.pdf)
ENTSO-E (2016) Ten-Year Network Development Plan 2016. (http://tyndp.entsoe.eu/) ENTSO-G (2017) Ten-Year Network Development Plan 2017. (https://www.entsog.eu/public/
uploads/files/publications/TYNDP/2017/entsog_tyndp_2017_main_170428_web_xs.pdf) Fraunhofer ISI (2016) Policy Dialogue on the Assessment and Convergence of RES Policy in EU Member States. Final Report of the DiaCore project. (http://www.diacore.
eu/images/files2/DIACORE_Final_Report.pdf)
IEA (2017) World Energy Outlook. Paris, France. IEA/OECD.
IRENA, Joanneum Research and University of Ljubljana (2017), Cost-Competitive Renewable Power Generation: Potential across South East Europe, International Renewable Energy Agency (IRENA), Abu Dhabi.
McKinsey (2010) Transformation of Europe's power system until 2050. Summary of findings. September 2010. Düsseldorf. (http://www.mckinsey.com/~/media/mckinsey/
dotcom/client_service/epng/pdfs/transformation_of_europes_power_system.ashx)
TECHNOFI (2013) E-Highway 2050. Selection and characterization of the most impacting demand-side technologies. Paris, 2013, (http://www.e-highway2050.eu/fileadmin/
documents/Results/D3/report_demand_technologies_selection_a.pdf and http://
www.e-highway2050.eu/fileadmin/documents/Results/D3/report_demand_technolo- gies_selection_b.pdf)
CIEMAT (2015) Bringing Europe and Third countries closer together through renewable energies. BETTER project Summary Report (http://better-project.net/sites/default/files/
BETTER_Summary%20Report_0.pdf)
Regional Centre for Energy Policy Research (2015) Decarbonisation modelling in the electricity sector. Regional report. Support for Low Emission Development in South East Europe (SLED) project. (http://sled.rec.org/documents/SLED_Regional_ELEC_ENG.pdf)
1 | Executive summary
The South East Europe region is a diverse region with respect to energy policy and leg- islation, with a mix of EU member states, accession and candidate countries. Despite this diversity, shared challenges and opportunities exist among the countries of the region. High interconnectedness and an increasingly harmonised and integrated elec- tricity sector resulting from the EU accession process warrants a regional outlook. A model-based assessment of different long term electricity investment strategies was carried out for the region within the scope of the SEERMAP project. The assessment shows that different possible solutions exist to replacing current generation capacity by 2050, with different implications for affordability, energy security, sustainability and security of supply.
Greece will need to replace approximately 40% of its current generation capacity by the end of 2030, and around 95% by 2050. This provides both a challenge in terms of the need to ensure a policy framework which will result in the necessary new invest- ment, but also an opportunity to shape the electricity sector over the long term without being constrained by the current capacity mix.
A set of five models covering the electricity and gas markets, the transmission network and economic system was used to assess the impact of 3 core scenarios:
•
The ‘no target’ scenario reflects implementation of current energy policy and no CO2 target in the EU or Western Balkans;•
The ‘decarbonisation’ scenario reflects a continuous effort to reach significant reduc- tions of CO2 emissions, in line with EU emission reduction goals for the electricity sector as a whole by 2050;•
The ‘delayed’ scenario involves an initial implementation of current investment plans followed by a change in policy direction from 2035 onwards, resulting in the attain- ment of the same emission reduction target in 2050 as under the ‘decarbonisation’scenario.
The modelling work carried out under the SEERMAP project identifies some key findings with respect to the different electricity strategy approaches that Greece can take:
•
By 2050 Greece will have an electricity mix with close to 100% renewable generation, mostly solar and wind, and some hydro, under scenarios with an ambitious decarbonisation target and corresponding RES support schemes. If renewable subsidies are phased out and no CO2 emission target is set, the share of RES in electricity consumption will reach 64.6% in 2050;this is insufficient compared with decarbonisation levels targeted by the EU by 2050, but still a significant increase compared to current levels.