LAND POLICY AND FARM STRUCTURE: CHALLENGES AND OPPORTUNITIES FOR AGRICULTURE IN THE
WESTERN BALKAN
TAMÁS MIZIK1
1Associate professor, Corvinus University of Budapest E-mail: tamas.mizik@uni-corvinus.hu
Although Western Balkan countries are quite different, they can all be characterised by their one shared goal, to achieve the quickest possible accession to the European Union. Even though agriculture plays an important key role within all Western Balkan states, it’s share is the highest in Albania and only Serbia has a trade surplus. Land is a key production factor but all the analysed countries can be characterized by fragmented land structure and low average farm sizes. Mostly based on land ownership issues, a land reform index can be calculated. The major contribution of this paper to the literature is the reevaluated land reform index for the Western Balkans.
Keywords: Western Balkans’ agriculture, agricultural trade, farming structure, land reform index JEL-codes: Q15, Q17
1. Introduction
The aim of this paper is to give a detailed analysis on one of the key problems facing Western Balkans’ agriculture, land issue. This covers farming issues (farm structure and sizes) and the actual state of land reform. Major research questions are the following:
What is the present situation of farming issues in the Western Balkans?
What are the major differences among these countries?
Which countries within the Western Balkans have leading positions or are lagging behind? What are the reasons behind these differences?
What is the actual state of land reform in these countries?
As Croatia already joined the European Union in 2013, it will be excluded from the analysis.
Regarding the other Western Balkan countries, at this moment negotiations already started with Montenegro; the former Yugoslav Republic of Macedonia (FYROM) and Serbia is waiting to start, while Albania and Bosnia and Herzegovina (BiH) need to carry out significant actions in order to open accession talks (EC 2013).
The Western Balkans have a long history of research that has been carried out by academics or research institutes. Regarding basic information on these countries’ agriculture, the USDA Global Agricultural Information Network (GAIN) reports can be useful. The majority of scientific research is based on social and political analyses. It reflects on the higher, but not vital role of agriculture in these countries. World Bank studies focus on specific issues like the state and problems of land and land rental markets (Swinnen et al. 2006), or the difficulties of the health and pension systems (Bredenkamp et al. 2008). The European Bank for Reconstruction and Development (EBRD) and the United Nations Food and Agricultural Organization (FAO) carried out country specific analyses (e.g. EBRD 2007 and FAO 2005). In addition to these, FAO recently published two studies on agriculture by specific regions in its regional studies series. The first one was about the new member states of the EU (Csáki – Jámbor 2009), while the second one was on the Western Balkans (Mizik 2010).
Academic and research institutes, which are either geographically close to or located in these countries, have also carried out in depth analyses on this region. As a member of a European consortium, the Hungarian Agricultural Research Institute gave a detailed overview of the agriculture and food industry of the Western Balkans (Arcotrass 2006). It highlighted the lack of consistent and comparable data. In 2010, the Leibniz Institute of Agricultural Development in Transition Economies (IAMO) published a study titled “Agriculture in the Western Balkan Countries” which gave a detailed picture on the actual state of agriculture and agricultural policy of the Western Balkan countries by national experts and researchers (Volk 2010). One of its messages was similar to the aforementioned one, as it was not always possible to gather reliable and precise data even for national actors. It is a common phenomenon found in these countries and therefore limits research opportunties. Beside data issues, low and not adequately balanced agricultural budgets also seem to be a general problem of this region, proven on the country level
(eg. Thomaj 2015 for Albania, Zurovec et al. 2015 for Bosnia and Herzegovina, Gordana – Bulatovic 2014 for Montenegro or Pejanović et al. 2013 for Serbia). In the case of Serbia, with less than 5 percent of the national budget being allocated to agriculture for an extended period of time, Vhapi and Sabotic (2015) found that the lack of funds was one of the greatest weaknesses of agricultural and economic policy. Erjavec has analysed the integration of the Western Balkan countries, especially the agricultural aspects (Erjavec 2010). Bojnec and Fertő also need to be mentioned for assessing the competitiveness of the agricultural and food industrial products of the region (Bojnec – Fertő 2009, 2010). Bojnec (2013) compared three EU candidate countries (Croatia, FYROM and Turkey) and found evidence of legal convergence toward EU norms.
However this process needs to be intensified because insufficient policies may slow down the accession process (Bexheti – Eshtrefi 2014).
Methodological tools used in this paper include a literature review, desk research, comparative analysis based on different datasets. The major contribution to the literature is the reevaluated land reform index for the Western Balkan countries based on a World Bank working paper (Csáki – Kray 2005).
2. Overview of agriculture in the Western Balkans
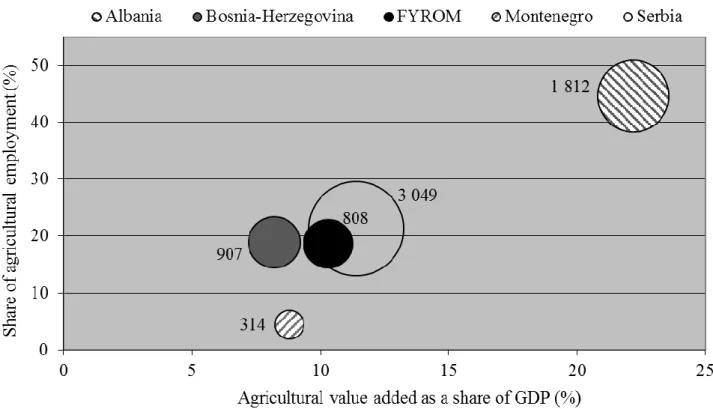
Three indicators were used to measure the importance of agriculture: agricultural value added as a share of GDP (%), share of agricultural employment (%) and the size of agricultural production (constant 2004-2006 million USD). The following comparative diagram summarises these indicators (Figure 1.). The center of the circle shows the first two values, while the size of the circle represents agricultural production.
Figure 1. The basic indicators of agriculturein the Western Balkans, 2013 Source: Author’s composition based on Eurostat (2014) and FAO.
Basically, Albania is an exception with by far the highest agricultural sector measured by both agricultural value added as a share of GDP and share of agricultural employment.1 On the other side of the spectrum, in terms of the share of agricultural employment, Montenegro has the lowest. Regarding agricultural value added as a share of GDP, the other four countries do not show substantial differences, they are in the range of 8.2% (Bosnia and Herzegovina) and 11.4%
(Serbia). In the last 20 years an obvious and continuous decreasing trend can be identified (Mizik 2011). Even the lowest values are far above the averages of EU, which were 1.7% (value added) and 4.8 % (employment) in 2013. It is worth highlighting that these values contain Romania (6.4% for value added and 29.3% for employment) which has a significant agricultural sector.
1 The agricultural value added as a share of GDP was above half of GDP in the 90’s and even in 2011 it was higher than the value added of the industry (18.5 % versus 15.7 %) according to World Bank data. The sector plays the most important role in employment with a 44.6% share, and this sector is still the greatest employer.
Regarding agricultural output, Serbia is the largest producer in the region. Its production was almost as great as the production of all four other countries combined. Contrary to the EU, where agricultural production has stagnated, according to FAO data, this region shows a slightly increasing trend.
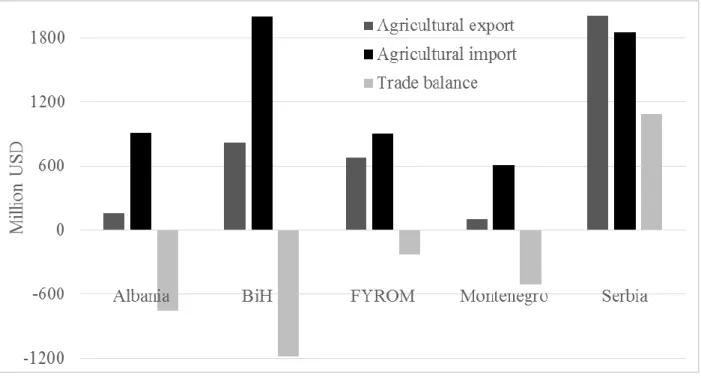
Beside the basic indices above, the actual state of agricultural trade is worth studying. Generally it can be analysed by export, import and trade balance. This is demonstrated in Figure 2.
Figure 2. The actual state of agricultural trade, 2013
Source: Author’s composition based on data from the World Trade Organization (WTO)
Serbia is the number one exporter of the region and exported 2 billion USD more (or four times more) than the second largest exporter, Bosnia and Herzegovina. Whereas for imports, Bosnia and Herzegonina is the largest followed by Serbia. It can also be seen from Figure 2 that only Serbia has a trade surplus, all the other countries are net importers of agricultural goods. The trade deficit of the region was almost 1.7 billion USD in 2013, including a 1.1 billion USD Serbian trade surplus. Its importance is highlighted by the fact that only the agricultural sector has a positive trade balance in Serbia (based on WTO data).
Regarding both exports and imports, the EU is the most important trading partner of the region.
From this aspect it is worth highlighting that out of five Western Balkan countries two are not yet members of the WTO. Bosnia and Herzegovina and Serbia currently have observer status. The EU pays special attention to the WTO’s Sanitary and Phytosanitary Measures, therefore this is also an impotant criteria that needs to be observed by these countries. In that regard, the earliest implementation of the EU rules on food hygiene and official quality control is essential for these countries (Mizik 2010). It is a question of market access and export competitiveness. A special pricing system, which encourages farmers to produce high-quality products, could be an element of it (EBRD 2007). However remarkable steps have been made, there are independent food safety agencies in some countries (Bosnia and Herzegovina, the FYROM) and some of them have already been acknowledged by the EU (Mizik 2010). Serbia seems to be lagging behind.
Although an EU conform food safety law was accepted, but an indepentent food safety agency has not been established yet (Campden – Campden 2013).2 Although Serbia adopted severeal new agriculture and food related laws, the Law on Genetically Modified Organisms (GMOs),3 which bans the use of GMOs without scientific evidence, continues to be a significant obstacle of WTO accession (Maslac 2014).
3. Farming issues
The two major analysed farming issues are farm structure and farm sizes. In most of the cases data for agricultural output by farm categories (agricultural enterprises andprivate farms) are not available in the national statistics of Western Balkans. Generally it could be stated that the majority of utilised agricultural area and agricultural production is dominated by the private sector. Table 1 shows the number of agricultural holdings and the distribution of utilised agricultural area by size groups. Some parts of agricultural lands are not cultivated, which is an interesting characteristic of countries in the Western Balkans. It is especially typical in Serbia, where around 20% of the available agricultural land is not in use (Njegovan – Bošković 2006).
2 But it should be kept in mind that the establishment of food safety agency itself can not solve the food safety problems if it does not have sufficient resources like qualified and well-paid staff, financial resources for testing, well-equipped laboratories with satisfactory capacity, etc.
3 Genetically Modified Organisms
Reasons for this are various, starting from land mines to intensive outward migration (FAO 2005).
Table 1. Number of agricultural holdings and distribution of Utilised Agricultural Area (UAA)
Categories Albania BiH Montenegro Serbia FYROM
Agricultural holdings (ths) 394.9 515.0 48.9 631.6 192.4
0 - 2 ha 354.6 250.0 35.9 308.4
184.4
2 - 5 ha 40.0 150.0 7.6 182.5
5 - 10 ha 0.2 90.0 2.7 89.1 6.3
10 - 50 ha 0.05 20.0 1.8 45.3
<50 ha 0.0 0.2 0.9 6.2 1.7
UAA (ths ha) 427.3 2444.0 221.4 3437.4 264.3
0 - 2 ha 305.1 N/A 23.7 273.6
188.5
2 - 5 ha 120.0 N/A 23.9 596.1
5 - 10 ha 1.3 N/A 19.1 617.3 42.7
10 - 20 ha 0.9 N/A 38.4 825.0
33.1
<50 ha 0.0 N/A 116.3 1125.5
Average size (ha) 1.1 4.7 4.5 5.4 1.4
Source: Arcotrass (2006) for Albania and BiH, MonStat (2011) for Montenegro, SORS (2013) for Serbia and SSO (2007) for FYROM
From Table 1 it can be seen that the number of agricultural units refers to the size of agricultural area. Generally countries with higher UAA have more agricultural holdings. Besides their number, their distribution is also very important. It seems to be a general phenomena of Western Balkans’ agriculture that the majority of the producers are smallholder farms. One of the most important factors behind this, is that the former Yugoslavian agricultural policy had limited farm size and the 10 hectares maximum was in use until the mid-80s (Njegovan – Bošković 2006). At least around 50% of the production units belong to the 0-2 hectares size category in each country.
Moving toward bigger size categories, the number of holdings are continuously decreasing.
According to the latest available data,4 there are no agricultural holdings over 100 hectares in Albania and only a few exist in Bosnia and Herzegovina and Montenegro. The latter one is a bit surprising as the highest share of large holdings can be found in Serbia.5
Beside the distribution of agricultural holdings among the size categories, the distribution of utilised agricultural area is also important. However, one should note that there is a significant correlation between them, but the size categories are different. Despite the huge number of production units in the lowest size category, they use less percentage of the total UAA. Albania and mostly FYROM are exceptions because agricultural production is dominated by small farms.
According to the average size, Albanian farms are the smallest among the analysed Western Balkan countries. In the other countries, the majority of UAA can be found in mid-sized categories (2-5 and 5-10 ha). Land structure is similar in Montenegro and Serbia, share of bigger farms in land use is on a relatively high level and showing an increasing trend (52.6% and 32.7%
share of over 50 ha category in land use respectively).
Generally speaking the average size of agricultural holdings is low, starting form 1.1 (Albania) to 5.4 ha (Serbia). It is low in itself, but in most cases they are formed from small parcels and located far from each other. This in turn also makes production more costly and less efficient. In Albania, despite the lowest average farm size, it means 4.5 parcels on an average and results 0.26 ha average parcel size (MAFCP 2011). More or less the same values characterize the FYROM, low average farm sizes together with 0.3-0.5 parcel sizes (Angelovska et al. 2012). The fragmented production structure implicates that realistically less than 10 percent of producers have sufficient production surpluses to compete in different markets and to re-invest into new technologies (FAO 2007).
4. Land reform
Private ownership of agricultural land is important; this had already been seen in the fomer Yugoslav Republics due to failed agricultural collectivisation (Angelovska et al. 2012). It has
4 The final results of the latest Albanian Agricultural Census (2012) are not available yet, while in Bosnia and Herzegovina the Census has been postponed.
5 There is no detailed data on large farms in Serbia and Montenegro, but their average sizes were 1,547 and 347 hectares respectively, while in case of cooperatives these values were 326 and 108 hectares respectively in 2005 (Njegovan – Bošković 2006).
increased in importance after the change of the regime. However, the rate of change was different from country to country and in general was decreased due in part by the Yugoslav Wars (1991- 2001), with the exception of Albania. Law in Western Balkan countries also did not restrict private ownership. On the production side, private farms are dominant but agricultural holdings also play an important role. The only exception again is Albania, where the share of agricultural holdings in production is insignificant (Swinnen et al. 2006). Legal backgound of private ownership was established around the same time in the region (1991-1992).
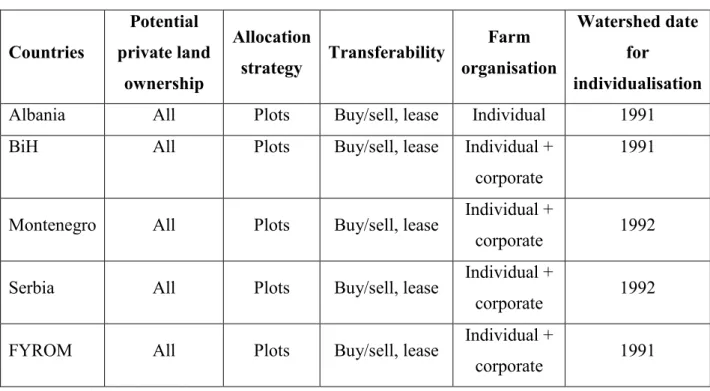
Land reforms can be described by some basic components which include private ownership (whether there are any restrictions or not), allocation strategy, transferability (freedom in buying/selling, option for leasing), type of farm organisations (which was analysed earlier) and the watershed date for individualisation. Table 2 summarises these elements for the Western Balkan countries.
Table 2. Differences in implementation of land reform in Western Balkan countries Countries
Potential private land
ownership
Allocation
strategy Transferability Farm organisation
Watershed date for
individualisation
Albania All Plots Buy/sell, lease Individual 1991
BiH All Plots Buy/sell, lease Individual +
corporate
1991
Montenegro All Plots Buy/sell, lease Individual +
corporate 1992
Serbia All Plots Buy/sell, lease Individual +
corporate 1992
FYROM All Plots Buy/sell, lease Individual +
corporate 1991
Source: Mizik (2010).
As it can be seen from Table 2, Western Balkan countries have followed a similar path of land reform. There is no limit in potential private ownership, the same allocation strategy was used,
and it is possible to buy, sell or lease land in every country. In every country individual farms are dominating ownership in line with the co-existence of former collective (corporate) farms with the exception of Albania. The watershed date for individualization was around the early 90s, even in Bosnia and Herzegovina, where its constitutional background was finalised only after the end of the war in 1998. The share of privatised land was between 80% (FYROM) and 95% (Albania) even in 2004 (Arcotrass 2006). The way of privatisation was also the same, as land was given back to its former owners. The only exception was Albania, which adopted “land to tiller”
strategy: the land was given to those persons who worked on it without any compensation similarly to the Commonwealth of Independent States (CIS) countries, especially Armenia and Georgia (Lerman et al. 2002).
The presence of agricultural enterprises in the production mix is a general phenomenon in the transitional countries and it is called dual production system.6 This duality is a part of a historical heritage of agriculture from the communist times. Yet, their share in land use shows a continuously decreasing trend over the years. The importance of individual production is the highest in Albania; its share has surpassed 90% already in 2004.
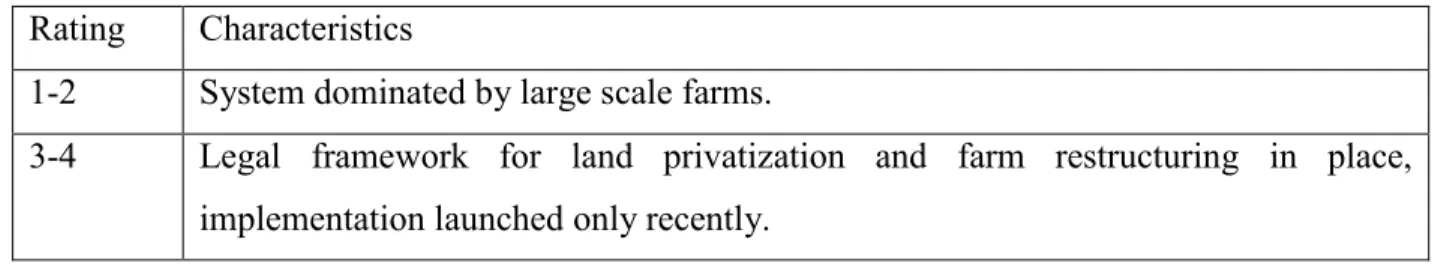
Regarding land reform, these countries have no significant problems, as reflected by their high land reform indices. This is part of a composite index used by the World Bank (e.g. Csáki – Kray 2005). The agricultural reform index refers to not only the state of land reform, but also market conformity, the policy environment, the privatization process, rural financial systems and the institutional framework. The two opposite categories are market economy and command economy. Land reform index is calculated by exact numerical ratings (Table 3.).
Table 3. Key to land reform ratings Rating Characteristics
1-2 System dominated by large scale farms.
3-4 Legal framework for land privatization and farm restructuring in place, implementation launched only recently.
6 On the one hand, there are lot of individual producers working on small land units and on the other side less number, but larger agricultural holdings can be found.
5-6 Advanced stage of land privatization, but large scale farm restructuring is not fully complete.
7-8 Most land privatized, but titling is not finished and land market not fully functioning.
9-10 Farming structure based on private ownership and active land markets.
Source: Csáki and Kray (2005: 5).
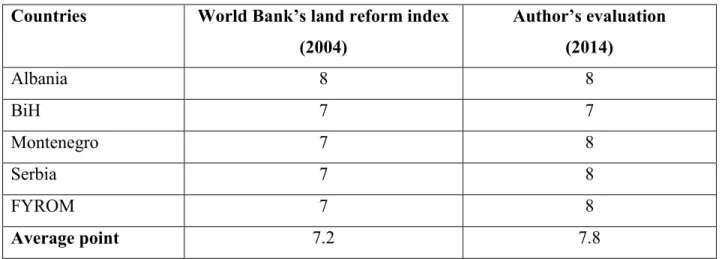
Table 4 gives a picture of the status of land reforms in the Western Balkans. According to the land reform index, most of the analysed countries are on a quite high level and much closer to market economy in comparison to the command economy (state control, state ownership, etc.).
Table 4. Status of land reforms in the Western Balkans Countries World Bank’s land reform index
(2004)
Author’s evaluation (2014)
Albania 8 8
BiH 7 7
Montenegro 7 8
Serbia 7 8
FYROM 7 8
Average point 7.2 7.8
Source: Author’s composition based on Csáki and Kray (2005)
The countries’ average was 7.2 in 2004, which was very high and all the countries could be found in the first half of World Bank’s analysis on Central and Eastern European (CEE) and CIS countries. In light of the failed collectivization mentioned above, it is not suprising that a significant part of the land was in private hands during the Yugoslav time. In the last 10 years all of these countries made remarkable steps in the field of land reform with quite high differences among the countries. However, a precise and up-to-date land register is still missing, but private land ownership is dominant and land markets are more or less functioning. From this aspect, regular and available agricultural census are essentials. This has been postponed in Bosnia and
Herzegovina7 and is not yet available in Albania. The latest Macedonian one was done 7 years ago. Montenegro made the most significant progress, the latest agricultural census was conducted and published in 2010, so information on farming issues and farm sizes can be analysed.
Land reforms and land privatisation are not important any more for the Western Balkans as all the countries have reached a quite high level. But there are some other problems which have to be tackled: first of all the fragmented land structure and the aforementioned low average farm sizes in line with the huge number of parcels. Low-scale production seems to be the bottleneck of Western Balkans agriculture. It is closely related to competitiveness. Consolidation of farm parcels should be a key issue in agricultural policies. Although average land sizes are increasing continuously, for now it continues to be a very slow process, especially in Albania. One of the most significant obstacles is the lack of or insufficient level of land registers which is an unavoidable part of a well functioning land market. For example in Albania inheritance and intra- family arrangements are done to avoid transaction costs (Muca et al. 2013). However, Marku (2015) has proven that the introduction of direct support measures in Albania has had positive effects on farming structure.
As the accession to the EU is a main aim of these countries, it is inevitable to build up an EU conformed, relatively up-to-date, land database, especially in Bosnia and Herzegovina. The key agricultural criterion of the EU membership is the implementation of the Common Agricultural Policy (CAP), which requires not only sufficient institutional background but also available and reliable data sources (for example the Farm Accountancy Data Network, FADN, system). From this aspect, FYROM and Serbia have made remarkable steps by introducing EU conform FADN pilot systems in 2010 and 2011 respectively.
Regarding land reform index, Albania, the former leader of this group, has made only small steps ahead. Due mainly to insecure property rights, only 3% of total agricultural land was exchanged since the end of privatization (Qineti et al. 2014). According to the author’s evaluation, it was not enough to qualify for 9 points. Bosnia and Herzegovina is absolutely lagging behind which is underlined by the postponed agricultural census and lack of reliable data. It cannot be valued by
7 The last one was conducted in 1991.
more than 7 points. Montenegro, Serbia and the FYROM carried out important changes and were able to raise their land reform points. They reached the Albanian level and with little effort, they can be evaluated by 9 points (finalizing the privatization process, solving the problem of state owned land and land registering problems, etc.).
5. Conclusions
Based on the indicators used to demonstrate the relevance of the sector (agricultural value added, share of agricultural employment), the agricultural sector plays an important role in this region compared to other countries wihin the EU. Serbia is the most significant producer and the only country with a trade surplus, all the other countries are net importers of agricultural goods. Due to the location of the other countries, it is a great opportunity for the Serbian agriculture to increase its production and trade surplus. Since the most significant trading partner of the Western Balkans is the EU, it is a very important task for the WTO observer countries, especially Serbia, to become members and to implement EU regulations on food hygiene and quality control into their national systems.
Regarding farming issues, it can be stated that majority of the agricultural producers of the Western Balkans are small ones. According to the average sizes, Albanian farms are the smallest with 1.1 ha, while Serbian farms are the largest with 5.4 ha. The size problem of these countries is expressed by the huge number of parcels, which make production more costly and less efficient. Changing this requires strong political commitment. Moreover, this type of land distribution is one of the most important barriers of a well functioning lease market.
As a matter of land reforms, Western Balkan countries have all followed in a similar way with no limit on private ownership and have used the same allocation method and allowed both buying and leasing of land. The dominancy of individual farms in line with agricultural enterprises results in a dual production system with the exception of Albania. Based on the results of privatization and the World Bank’s land reform index, land reform is not an important issue in this region. On the other hand, land policy still has a lot of work to do starting with the extremely fragmented land structure and setting up EU-conform, reliable and an available land register and information system. Reaching this FADN pilot projects are essetials. However they are open for
every country, but only Serbia and the FYROM have started them as of yet. Beside this, the key information sources can be national agricultural census, but up-to-date information can be found only for Montenegro and Serbia. Macedonian results are 7 years old, while there are no relevant data on Albania and Bosnia and Herzegovina. Therefore the first three countries can be characterized by land reform rating of at least 8. Albania did not reach higher than its previous value and Bosnia and Herzegovina is lagging behind (land reform value of 7).
References
Angelovska, N. P. – Ackovska, M. – Bojnec, Š. (2012): Agricultural Land Markets and Land Leasing in the Former Yugoslav Republic of Macedonia. Centre for European Policy Studies, Factor Markets Coordination Working Paper 11.
Arcotrass (2006): Study on the State of Agriculture in Five Applicant Countries. Consultancy
Report for the European Commission, Brussels.
http://ec.europa.eu/agriculture/analysis/external/applicant/index_en.htm, accessed 24 March 2016.
Bexheti, A. – Eshtrefi, L. (2014): Economic Policies of FYROM Towards the EU—Are They Efficient? In: Karasavvoglou, A. – Polychronidou, P. (eds.): Economic Crisis in Europe and the Balkans. Springer International Publishing.
Bojnec, Š. – Fertő, I. (2009): Agro-food trade competitiveness of Central European and Balkan countries. Food Policy 34(5): 417-425.
Bojnec, Š. – Fertő, I. (2010): Southeastern European Agrofood Trade Specialization. Eastern European Economics 48(3): 22-51.
Bojnec, Š. (2013): Land Endowments and Land Market Policies in Croatia, FYR of Macedonia and Turkey. Bulgarian Journal of Agricultural Science 19(3): 397-407.
Bredenkamp, C. – Gragnolati, M. – Ramljak, V., eds. (2008): Enhancing Efficiency and Equity:
Challenges and Reform Opportunities Facing Health and Pension Systems in the Western Balkans. HNP Discussion Paper No. 46706.
Csáki, C. – Jámbor, A. (2009): The Diversity of Effects of EU Membership on Agriculture in New Member States. Policy Studies on Rural Transition No. 2009-4, FAO Regional Office for Europe and Central Asia, Budapest.
Csáki, C. – Kray, H. (2005): The Agrarian Economies of Central-Eastern Europe and the Commonwealth of Independent States. An Update on Status and Progress in 2004. World Bank Working Paper No. 40.
Campden, K. S. – Campden, H. J. (2013): Food Safety Situation in Serbia. In: DG Internal Policies: Food Safety and Public Health Situation in Serbia. Economic and Scientific Policy Department. IP/A/ENVI/NT/2013-16&17, Luxembourg
EBRD (2007): A Systematic Analysis of the Agribusiness Sector in Transition Economies: The Montenegrin Dairy Sector. London: EBRD
EC (2013): Enlargement Strategy and Main Challenges 2013-2014. COM(2013) 700 final.
Brussels: European Commission.
Erjavec, E. (2010): Issues, lessons and strategies for Western Balkan agriculture. SWG InWent Seminar, 20-24 September, Durres.
Eurostat (2014): Enlargement countries - Agriculture, forestry and fishing. Eurostat Compact guides. Luxembourg: Publications Office of the European Union.
FAO (2005): Rural Development Strategy, Croatia. Terminal statement. TCP/CRO/2801
FAO (2007): Building Partnerships for Technology Generation, Assessment and Sharing in Agriculture among West Balkan Countries. Highlights of a FAO Stakeholder Consultation. Skopje
Gordana, D. – Bulatovic, B. (2014): Proposal for the EU CAP Compliant Agricultural Budgeting Model in Montenegro. Agricultural Economics 60(10): 479-487.
Lerman, Z. – Csáki, C. – Feder, G. (2002): Land Policies and Evolving Farm Structures in Transition Countries. World Bank Policy Research Working Paper No. 2794.
MAFCP (2011): Albanian Agriculture 2011. Tirana: Ministry of Agriculture, Food and Consumer Protection.
Marku, D. (2015): Agriculture and the Effectiveness of Support Policies in Albania on Focus:
Fruit Production. European Scientific Journal 3: 35-41.
Maslac, T. (2014): Serbian Agriculture Overview and Best Prospects-2014. USDA GAIN report No. RB1405.
Mizik, T. (2010): The Diversity of the Agriculture in the Selected Former Soviet and Western Balkan Countries. Policy Studies on Rural Transition No. 2010-2, FAO Regional Office for Europe and Central Asia, Budapest.
Mizik, T. (2011): Western Balkans: State of Agriculture and its Opportunities on the Eve of EU Accession – I. Acta Universitatis Danubius. Œconomica 10(1): 30-52.
MonStat (2011): Agricultural Census 2010. Podgorica: Montenegro Statistical Office.
Muca, E. – Kapaj, A. – Guri, F. – Thoma, H. – Tanku, A. – Thoma, L. – Totojani, O. (2013):
Land and agricultural productivity: Evidences from Albania. Journal of Food, Agriculture
& Environment 11(3-4): 735-737.
Njegovan, Z. –Boškovic, O. (2006): Agriculture of Serbia and Montenegro. Agora Without Frontiers 12(2): 110-145.
Pejanović, R. – Glavaš-Trbić, D. – Tomaš-Simin, M. (2013). About the causes of agriculture crisis in the Republic of Serbia. Economics of Agriculture 60(2): 253-264.
Qineti, A. – Rajcaniova, M. – Braha, K. – Cianian, P. – Demaj, J. (2014): When land markets 'do not work' and status-quo agrarian structures persist: A case study from rural Albania.
EAAE Congress on ‘Agri-Food and Rural Innovations for Healthier Societies’. August 26-29, Ljubljana
SORS (2013): Agriculture in the Republic of Serbia. Belgrade: Statistical Office of the Republic of Serbia,
SSO (2007): Census of Agriculture. Book III „Individual agricultural holdings grouped by total available land, by regions”. Skopje: State Statistical Office of Republic of Macedonia.
Swinnen, J. – Vranken, L. – Stanley, V. (2006): Emerging Challenges of Land Rental Markets. A Review of Available Evidence for the Europe and Central Asia Region. World Bank Europe and Central Asia Chief Economist’s Regional Working Paper Series 1(4).
Thomaj, E. (2015): Analysis of Public Expenditures in Support of Agriculture Development in Albania. European Scientific Journal 11(1): 309-320.
Vehapi, S. – Šabotić, Z. (2015). The State and Problems of Serbian Agriculture. Economics of Agriculture 62(1): 245-257.
Volk, T. ed. (2010): Agriculture in the Western Balkan Countries. Studies on the Agricultural and Food Sector in Central and Eastern Europe, 57, IAMO, Halle/Saale
Zurovec, O. – Vedeld, O. P. – Sitaula, B. H. (2015): Agricultural Sector of Bosnia and Herzegovina and Climate Change—Challenges and Opportunities. Agriculture 5(2): 245- 266.
Websites and databases
Eurostat database: http://epp.eurostat.ec.europa.eu/portal/page/portal/eurostat/home/
FAO database: http://faostat.fao.org/default.aspx
World Bank database (World Development Indicators): http://devdata.worldbank.org/data-query/
WTO website and database: http://www.wto.org