Carpathian Journal of Earth and Environmental Sciences, August 2019, Vol. 14, No. 2, p. 287 - 300; DOI:10.26471/cjees/2019/014/080
LAND USE ANOMALIES ON WETLANDS IN DIFFERENT TIME HORIZONS – A CASE STUDY FROM HUNGARY
Richárd DÓKA
1, Márton KISS
2,3& Ilona BÁRÁNY-KEVEI
41Kiskunság National Park Directorate, Liszt Ferenc u. 19, H-6000 Kecskemét, Hungary; dokarichi@gmail.com
2Department of Climatology and Landscape Ecology, University of Szeged, Egyetem u. 2, H-6722 Szeged, Hungary;
3MTA Centre for Ecological Research, Klebelsberg K. u. 3., H-8237 Tihany, Hungary; kiss.marton@geo.u-szeged.hu
4Department of Climatology and Landscape Ecology, University of Szeged, Egyetem u. 2, H-6722 Szeged, Hungary;
keveibar@geo.u-szeged.hu
Abstract: Wetlands are usually considered as habitats with high ecological values. Their main landscape properties are surface water cover and water-saturated soils, which are generally regarded as water surplus meaning a natural constraint and an environmental risk for the agriculture and other land uses. According to this, in the traditional Hungarian landscape wetlands were utilized as hay fields, pastures or places of reed harvest, etc., almost without exceptions. Over time, new utilization methods (e.g. arable farming, grape production, construction) occurred on them, despite the improper land suitability originating from the water surplus. From the view point of ecology and traditional landscape, we considered these new utilizations as a land use anomaly, as it could be revealed by GIS methods in the middle part of Duna–Tisza Interfluve, Hungary. The study area with a 25×25 km extent includes a Hungarian big city, Kecskemét, its urban fringe, and the remote rural landscape parts, too. The land cover changes on wetlands, which are ensuing from the land use changes and referring to them, were analyzed by application of historical, recent and cadastral maps, ortophotos and databases originating from the end of 19th century to our days. According to the results, land use anomalies on wetlands were not uncommon already in the historical past and they became more common in parallel to the intensifying anthropogenic transformation of landscape, apart from a special time period in the first half of the 20th century. It is supposed that at this exceptional time economic (crisis in the world economy and the local economy) and climate change factors (extremely dry, droughty period) combined, and the latter factor led also by itself, and by strengthening the effects of local economic crisis to the large-scale ploughings of water-affected areas. Based on the examination of the land cover changes, ploughings were the most significant from between the different alteration methods in the course of time.
Besides, it has caused serious ecological damages of wetlands in several places; it can be regarded also irrational use in the longer term, because of the risk of inland excess water. After ground excavation or landfill, buildings and water facilities often occurred in water-affected areas, as well. Wood plantations and plantation of horticultural products (forming vineyards, orchards and vegetable gardens) affecting wetlands appeared only rarely in the remote and the recent past.
Keywords: wetlands, water-affected areas, land use anomalies, traditional landscape structure, landscape history, land suitability, natural constraints
1. INTRODUCTION
The determination of suitable land use has been in the focus of research in landscape ecology and geography in general for decades (Naveh &
Lieberman, 1984, Zonneveld & Forman, 1990). This covers the specification of land use form, its spatial pattern and intensity.
Research activities dealing with land use
planning, which aims at fulfilling social needs and which is environmentally sustainable, as well, are mostly connected to some specific subtopics and related terms. Those contributions, which use the notion of “land use suitability”, have focused mainly on the suitability of one specific land use form. Most of these works have investigated agricultural suitability. According to the FAO (1976), suitability is the fitness of a given type of land for a defined use.
The suitability assessment gives us the usability constraints and opportunities of a given landscape element (Haase, 1978). Landscape properties (including soil parameters) that are unfavorable to cultivation are lately called physical or natural constraints (Fischer et al., 2002, Eliasson 2007, Van Orshoven et al., 2012). Identification of natural constraints had a practical significance in the European Union, as they can determine the agricultural subventions through the delimitation of so-called “areas facing natural constraints” (earlier:
less favored areas or areas with natural handicaps, EU Regulation No. 1305/2013).
Singha & Swain (2016) clarified that agricultural land suitability is a function of crop requirements and soil or land characteristics.
Meanwhile, other works can be characterized with the attributes of the more generally interpreted land use suitability: integrated social-ecological approach, multi-criteria decision making methods and GIS- based analyses (Kalogirou, 2002, Heumann et al., 2013).
A certain type of land use, or a spatial pattern of them might harm the interests of other actors, this could result in “land use conflicts” (von der Dunk et al., 2011). Not only the groups of stakeholders but also the local people and the experts assess the associations and conflicts of land uses in different ways (Tudor et al., 2015). Older concept is “land use optimization”, which is targeted at the minimization of the conflicts (Ružička & Miklós, 1982).
The above-mentioned terms and concepts do not describe fully the notion of land use that is unsuitable from the point of view of geo-ecological conditions and traditional land use, which adapted more or less to these conditions. This can be called land use anomaly, which is a quite rarely and without detailed definition used expression (Pereira, 1996, Welch, 1996), opposed to its possible high importance. Emergence of land use anomalies can be described with the changing of traditional, ecologically prescribed, adapted landscape structure, which is a frequent landscape ecological problem (Antrop, 2005). According to Kerényi & Csorba (2012), the map of land use anomalies shows the areas of land use that is inappropriate for natural conditions.
Our work deals with the identification and assessment of land use anomalies. We use the term with the following definition: land use anomaly is that kind of a land use, which “abnormally” differs from the traditional land use structure that is historically developed and adapted to natural conditions, and which is unreasonable from the point of view of these conditions that act like limiting and threatening
factors. Compared to the other, typical places of the concrete land use type, we can diagnose the extremism and the lack of adaptation.
The suitability of land use or the presence of land use anomalies can be important for many types of ecosystems or land management forms. The finding of the most suitable agricultural land use form or crop rotation has been an important field in landscape ecology for long ago (Dumanski &
Onofrei, 1989, Rossiter, 1996, Akinci et al., 2013).
Forestry is also a possible application area of theoretical and practice-oriented land use suitability analyses (Joss et al., 2008, Zomer et al., 2008).
Many examples of land use anomalies are connected to wetlands, which are endangered globally, mainly because of the reclamation for arable land (Asselen et al., 2013). As some recent historical analyses have demonstrated, urbanization plays a significant role not only in transformation of wetlands but also in creating new ones (Havlíček et al., 2014, Iojă et al, 2018).
Based on the above-mentioned aspects, the main aim of our work is the detection of land use anomalies in different historical time periods (from the 1880’s to the recent decades), in a study area in Hungary, characterized with recent landscape ecological problems and land use conflicts. The research is focusing on wetlands, which hold high ecological and other types of landscape values. The discussion of wetland-related land use anomalies from landscape ecological point of view was also targeted, in order to derive practical information for land use planning in the region (especially in the context of climate change). And a secondary methodological aim was also set: a GIS workflow for harmonizing different datasets from different time horizons was created and applied for the land use anomaly assessment task.
2. STUDY AREA
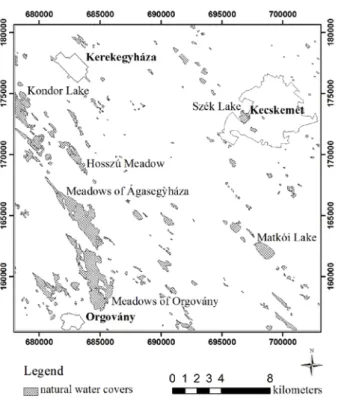
The 25×25 km (625 km2) sized study area (Fig.
1.) has an ordinate square shape, and is situated in the Danube–Tisza Interfluve, on the Great Hungarian Plain (Hungary). According to the hierarchic order of Hungary’s natural landscapes (Marosi & Somogyi, 1990, Dövényi, 2010), it belongs to the Danube–Tisza Interfluve Plain mesoregion’s territory. From between the microregions constituting this mesoregion, it involves certain parts from the Sand Ridge of Kiskunság, Sand Ridge of Bugac and Loessial Ridge of Kiskunság, which have different natural conditions. The two previous microregions are dominated by humus-poor wind-blown sand, while the last one is covered mainly by much more fertile
loess. Due to the different substrates, the soil and the potential habitat types are also well separated in the case of the sandy and loessial landscape units.
Locally, on the sandy landscape parts, sand dune areas occur, where the average relative relief values are higher (8–10 m/km2) compared to their surroundings (2–4 m/km2) (Marosi & Somogyi, 1990, Dövényi, 2010).
Figure 1. Location of the study area
At mesoregional level the research area is relatively homogenous: this is a geomorphologically uneven plain in a ridge-like relief position, with 20–
40 meters above the floodplains of Danube and Tisza rivers, covered mostly by quaternarian clastic sediment types (Gyalog & Síkhegyi, 2005), characterized by continental climate (500–550 mm annual precipitation amount, 10–11°C annual mean temperature, OMSZ 2018). The investigated region doesn’t have natural watercourses, but in wet periods periodical (intermittent) still waters can be found beside some constant (permanent) water covers.
From the view point of the settlement development, the study area consists of the dynamically altering city of Kecskemét, its expanding urban fringe and the joint, more likely slowly changing rural landscape parts. It shows the unequal landscape development well that the today’s landscape state can be characterized by all the landscape types (natural, managed, cultivated, suburban and urban) in terms of the anthropogenic intensity (Forman & Godron, 1986). Continuous rise in the degree of hemeroby can be observed from east to west, from the unutilized sand dunes, which are even not grazed, over the agriculturally treated and cultivated rural landscape parts and the suburban zone, to the city of Kecskemét with about 111,000 inhabitants.
Kecskemét is the county seat of Bács–Kiskun County. In its suburban vicinity a dense network of
scattered homesteads is situated. Farther from the city, these homesteads are less frequent, and they can be rather characterized as farmsteads with agricultural cultivation (called in Hungarian: “tanya”). Some villages (e.g. Ágasegyháza, Fülöpháza, Orgovány) and a small town (Kerekegyháza) are located here, in the rural landscape, as well. 15–20 km west of Kecskemét some parts of Kiskunság National Park are overlapping with the study area with its sand dunes, where, in certain parts, even the human presence is legally restricted, too. Besides the sand dunes, marshes, wet grasslands and sodic pastures constitute an important value, as well.
The study area consists of “loessial plain with deep groundwater table and chernozem”, “sandy region with half-fixed dunes, planted forest and remnants of sandy steppe-meadow”, “fixed sandy plain with the mosaic of sandy steppe-meadow, Robinia- and Populus-forests, vineyards and orchards” and “sandy plain with chernozem soil, horticulture and arable farming”. We can find
“interdune depressions” too, which can be characterized with high ground water table and surface water, and with fenny meadow and sodic meadow soils (Pécsi et al., 1972, Jakucs et al., 1989).
In the Danube–Tisza Interfluve, the semi- natural vegetation could be mainly remained in extreme habitats, which have unfavourable natural conditions from the aspects of the agricultural and forestry land use (Iványosi Szabó, 1994, Biró &
Molnár, 1998). On sand dunes, open sand grasslands often avoided the afforestation thanks to the loose, nutrient-poor soil and cultivation difficulties (natural constraints) originated from their physical structures, and mainly due to the former military use.
Depressions with their waterlogged surfaces and water covers remained for a long time the places of mowing, grazing, reed management and other traditional land use. Ensuing from the traditional landscapes, they play a determinant role as traditional elements (remnants) in today’s landscape structure (see Antrop 2005). Between the sand dune areas and depressions, flat or slightly wavy, loessial and sandy plains dominate the landscape, where the vast majority of arable land is situated, traditionally and typically.
The local deflation depressions can be found in long spreading patches, in the study area everywhere, but their sizes are very different (from ca. 0.5 hectares to more than 700 hectares). Greater ones (e.g.
Meadows of Orgovány, Meadows of Ágasegyháza, Kondor Lake) are situated on the west, while on the east they are rather small and rare, too. Usually, it is easy to separate them from their environments, because of the well-defined coastlines. During
inundations, the deepest water, Kondor Lake’s average water depth is about 1.2 meters (Szilágyi et al., 2004), but in the consecutive years with extreme rainfalls, the maximum water depth may exceed 1.5 meters, profusely. Nowadays the lakebed is mostly dry. The smaller sodic depressions are much shallower, only with a few decimetres of water depth.
One of the main characteristics of wetlands is the situation in low morphological (relief) position (Szilágyi, 2007), where in the depression the waters of subsurface and surface runoff accumulate.
According to the seasonal change in the level of groundwater, the inundations with the greatest extent usually exist during the period spreading from the early spring to late summer. They often dry out for summer, that’s why they are also called “water- affected areas” in Hungarian geography. We use this expression in this paper as a synonym of wetland, regardless of the state of the vegetation.
In accordance with the Hungarian ecological definition, a wetland represents a natural unit where the average water depth related to the surface – in the case of medium water level – does not exceed two meters and where the upper layer of the hydromorphic soils is permanently, or at least long- lasting water-saturated (Dévai et al., 1992).
A wetland is an ecosystem that depends on constant or recurrent, shallow inundation or saturation at or near the surface of the substrate (Lewis et al., 1995). As Lewis and his team stated, its common diagnostic features are hydric soils and hydrophytic vegetation, until specific physicochemical, biotic or anthropogenic factors remove them, or prevent their development.
In the study area the territorial relations of mentioned terms are the followings in our days:
extent of natural or semi-natural hydrophytic or hygrophilous plant communities < wetlands (water- affected areas) < maximum size of inland excess water.
3. MATERIALS AND METHODS
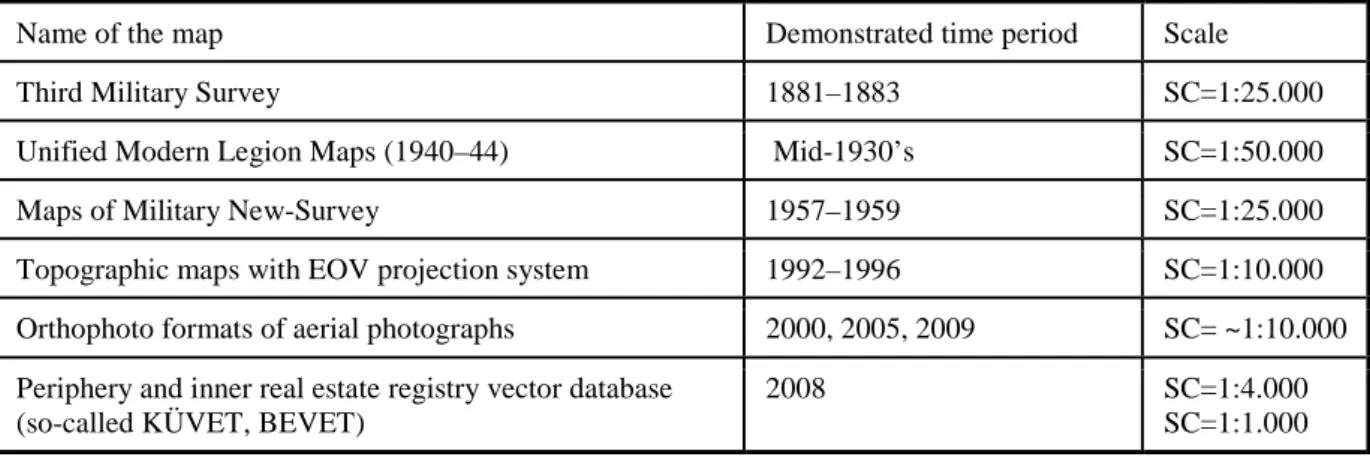
Based on topographic maps, orthophotos and digital real estate registry databases of peripheries and inners, land cover maps were edited by visual interpretation and data merging, using GIS software (ArcGIS 9.3). Land cover data concerning the study area were collected of different time horizons (1881–
1883, mid-1930’s, 1957–1959, 1992–1996 and 2008–
2009). The data sources are shown by Table 1.
In the case of the first four time horizons, units of land cover types were delimited by visual interpretation of borderlines of patches occurring on the georeferenced maps. Vector databases containing the land cover types were created by time horizons.
The used six land cover types of the study area were the followings. Type 1: arable land, Type 2: meadow, pasture, grassland with groves, Type 3: natural forest, artificial wood, tree plantation, closed scrubs, Type 4:
vineyard, orchard, garden (kitchen-garden, market- garden, flower-garden, park), Type 5: settlement, other build-up areas (roads, cemetery, landfill). Type 6: natural water cover, Type 7: artificial still water (water facilities, e.g. reservoir, fish pond). In order to abbreviation, Type 2– 5 will be used hereinafter in this form: Type 2: grassland, Type 3: woodland Type 4: horticultural land, and Type 5: build-up area. These land cover types configure a uniform category system comprehending the different time horizons.
Attribute and geometric data of the digital real estate registry databases (so called KÜVET and BEVET) were converted by reclassification and merging, according to the above-mentioned land cover category system.
Studying historical land use or vegetation is made more difficult by the fact that maps and other datasets are quite heterogenous in terms of data type, spatial resolution and data quality. Therefore, there is a high need for data harmonization and the combined use of different methodologies of related disciplines
Table 1. Data sources
Name of the map Demonstrated time period Scale
Third Military Survey 1881–1883 SC=1:25.000
Unified Modern Legion Maps (1940–44) Mid-1930’s SC=1:50.000
Maps of Military New-Survey 1957–1959 SC=1:25.000
Topographic maps with EOV projection system 1992–1996 SC=1:10.000
Orthophoto formats of aerial photographs 2000, 2005, 2009 SC= ~1:10.000 Periphery and inner real estate registry vector database
(so-called KÜVET, BEVET)
2008 SC=1:4.000
SC=1:1.000
(Gimmi et al., 2011, Fuchs et al., 2013, Yang et al., 2014). Because of the different scale of source maps, for the better comparison Töpfer’s Radical Law (Töpfer & Pillewizer, 1966) were used as follows.
According to the smallest 1:50.000 scale, the numbers of the polygons of those maps that have different scale were reduced (generalized) to the number that is adequate to scale of 1:50.000. For reduction
“Eliminate” function was used. After the conversions (merging, reclassification, generalization) affecting the vector databases of land covers, they were converted to 10, 25, 50, 100 and 200-meter cell-sized raster files.
In order to reveal the land use anomalies affecting the wetlands to different degrees in time, the land cover map databases were compared to the integrated databases of natural water covers with GIS method, in the case of the investigated five time horizons (1881–1883, mid-1930’s, 1957–1959, 1992–
1996, 2008–2009). The database named as the map of natural water covers (Fig. 2.), was built by unification (“Union” function) of the selected polygons that belong to the Type 6 (natural water cover) of the land cover maps originating from the above-mentioned time horizons. The vector databases of natural water covers representing wetlands were converted, according to the databases of land cover maps, to 10, 25, 50, 100 and 200-meter cell-sized raster files. Five different databases were gained by the combination of raster files with the same cell size.
Figure 2. Integrated map of the wetlands
In the case of every time horizon, those cells were determined, where natural water cover appears
in any time horizon and on the same place, in the examined time horizon other land cover type (arable land, horticultural land, woodland, build-up area, but except grassland) or Type 7 (artificial still water) come up. These are the places where the new land cover is contradictory to the traditional (pre-modern) land use/land cover structure, and where the utilizations are often not compatible rationally (economically) with the surface water influence or with the waterlogged soil. This kind of discrepancy is even more obvious, if we compare the conditions of the concrete place to the conditions of the surrounding ecotopes existing on dry relief.
The new upcoming patches of woodlands – except for the spontaneous self-forestation, which is not characteristic of the water-affected areas of the region including the study area – were regarded as tree plantations. The natural water cover-grassland way of change, according to the experiences, in spite of the possible naturalness change, still lead to semi- natural grassland, as opposed to the other cases, when the new type of land use/land cover results the disturbance of the surface (soil) and the destruction of the natural and semi-natural plant communities/habitats.
Figure 3. Map showing the investigated places (result cells) of apparent land use anomalies (cell size = 200 m)
The cells that were received by selection from the combined 100 and 200-meter cell-sized raster files, were controlled one by one (Fig. 3). The method of the control was the following. The apparent result cells, which contained also real and false results, were
compared to the original map, to the orthophotos from 2000, 2005 and 2009, and to the EOTR topographic map (1:10.000 scale). Those apparent results (individual cells) were considered as a false result that are located outside the local depressions where the surface is unambiguously dry and free from groundwater exposure according to the orthophotos.
Real result cells fall inside local depressions with water-saturated or -covered surfaces. The use of orthophotos from 2000 for control was especially practical, because they were made in the first half of the vegetation period (April–May) of 2000 during a wet weather cycle, when the surface water covers (“inland excess waters”) appeared again with great extent, and the soils of the wetlands became water- saturated after a dry time period. In the 2000 orthophotos these waterlogged and water-covered surfaces can be identified easily, while the EOTR topographic map shows unambiguously the depressions.
1124 cells of 100 and 200-meter cell-sized result files were investigated one by one if it shows a real result, or it represents a false one because of the error possibilities. These errors can ensue for example from the bad matching of borderlines, which is mainly the consequence of distortion (inaccuracy) of the source map. This type of error draws attention to source criticism. Some errors may also occur due to the used generalization.
Results cells considered as real cases of land use anomaly demonstrate that in a given water- affected area which new land cover type occurs, instead of natural water cover, or grassland appearing due to the drier climate period. Based on the new land cover type (Type 1, 3, 4, 5, 7), we can conclude the new land use type, so the alteration method as well.
The combinations of 10, 25, 50-meter cell- sized raster files provide extremely many result cells (minimum 4000, but together tens of thousands) with small resolution, therefore the analysis of their result maps was not feasible. The conclusions were evidently based on cells showing a real result that are 70.7% of the apparent results (result cells) of the 100 and 200-meter cell-sized files, according to our calculations.
4. RESULTS
The method applied with a uniform land cover category system, and with one by one verification of the results seems appropriate for the comparison pursued by time horizons, and for the statistical analysis.
The occurrence and the extent of natural water covers documented and geographically delimited
according to the five investigated time horizons are shown integrated, as a whole by the result map of natural water covers (wetlands) (Fig. 2). The territorial share of total coverage of surface waters representing the wetlands is 5.6% in the study area.
On the land cover maps originating from the different time horizons the natural water covers have different extent. The largest extension is given by the Third Military Survey, covering 3.8–3.9% of the research area. In accordance with the vector file concerning the 1881–1883 time horizon 163 water bodies (land cover units) were found in the research area following the generalization. Thanks to the mild and rainy weather, the natural surface waters were the most extended during the Third Military Survey from between the investigated time horizons. The natural waters of this time have even in itself a significant share (72.9%) from total (integrated) coverage of natural still waters. Only the remaining part (27.1%) is given by the other four time horizons.
The smallest extent with 1.7% is represented on the vector map showing the land cover from mid- 1930’s. The number of the separable water bodies was 95 at this time. In the other three time horizons, the coverage of natural water covers was 2–3%, and their number was 105 (1957–1959), 107 (1992–1996) and 71 (2008–2009) in the adequate vector files. The average share of water covers is 2.5% in the study area.
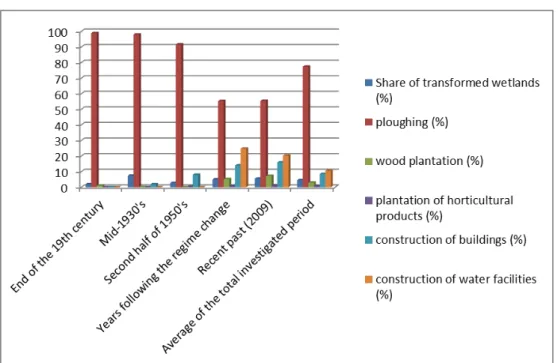
According to our data, five alteration methods were defined: ploughing, wood plantation, plantation of horticultural products, construction of buildings and construction of water facilities. The most common alteration method was the ploughing with 77.4% (Fig. 4-5.). In every time horizon it was the most typical intervention in the traditional and the later landscape structure. Due to the forming of artificial water bodies with great extent in the second half of 20th century, the second most typical alternation mode was the construction of water facilities (10.5%). The third most typical transformation method affecting the wetlands was the construction of buildings (8.5%). Wood plantations occurred only sometimes (3.0%), and plantation of horticultural products (0.6%) was not characteristic of water-affected areas, either, but occurred rarely.
The mean rate of transformed area is 4.5%, but of course, it varies highly in the different time horizons. It means at least tens of hectares in every time horizons, and the largest value is multiple (3.9 times) the smallest. The lowest rate of transformed wetlands (1.9%) was at the end of the 19th century, while the highest (7.4%) was in the 1930’s. Apart from this period, slow growth (from 1.9% to 5.5%) can be observed during the investigated time. The patches of the transformed wetlands, i.e. the places of land use
anomalies appear usually scattered and without large extent.
In accordance with our results, the extension of ploughed wetlands doubled during the studied period (1881–2009), except the mentioned outlier.
From the end of the 19th century, during a half century, the ploughed areas increased almost fourfold.
The share of ploughings between the alteration methods decreased (from ca. 99% to ca. 55%) continuously, due to the fact that the other alteration methods also appeared on wetlands in time, and these methods became more significant separately.
Wood plantations on wetlands became more remarkable (5.2–7.2%) only from the second half of the 20th century, when they appeared in several hectares (9.3–10.4 ha). Plantations of horticultural products, which appeared only in some places and with small extent (0.4–1.2 hectares), remained subordinated all the time, but its share slightly increased from the mid-20th century. Constructions on wetlands emerged in the research area around the turn of the 19–20th centuries, or in the first half of the 20th century and later began to intensify continuously. Due to the increasing constructions, 5–30.8 hectares of wetlands
Figure 4. The estimated area of transformed wetlands by alteration methods in each period compared to the total area of transformed wetlands
Figure 5. Proportion of alteration methods affecting the wetlands in each period and the share of transformed wetlands
became transformed to built-up area, which means a very significant and a multiple growth. Construction of water facilities with around 40 hectares and with substantial excavation depth came up in the second half of the 20th century.
5. DISCUSSION
As the differences of extents of natural water covers show, the danger of inundation is not equal in every time period. The size of the water cover may depend on the climate period and the weather (Gimmi et al., 2011). It is also possible that partly the method of mapping included the mapmaker’s subjectivity determines if a waterlogged piece of land is mapped as a water cover or as a simple grassland. The difference between the greatest extent of natural waters in 1881–1883 and the total extent of natural waters also refers to the subjectivity and the different mapping methods. Based on the multiple different sources, the map of natural water covers represents the vast majority of wetlands, according to our opinion.
The average or the maximum proportion of the transformed wetlands (4.5%, respectively 7.4%) doesn’t seem to be too high. However, considering the significant share of the surface waters of a permanent nature (for example Orgovány Lake, Ágasegyháza Lake, Kondor Lake), they can be regarded as very high value from the point of view of land use adaptation. We can presume that the periodically (yearly intermittently) inundated areas were damaged on average with higher proportion (even with about 10–20%), aside from the regeneration following the abandonment of harmful land use. It is also logical, because the environmental and economic risks are less significant on them, than on a constantly inundated land.
As a whole, the low rate of the transformed wetlands indicates that limited utilization conditions and the pressure for adaptation. This adaptation was changing continuously during the times, as it is shown by the different rates of transformed wetlands. By the end of the studied period it grew more than doubled, while an outlier can be seen, too. The outlier in the mid-1930’s can be explained only by different special factors that will be discussed in the followings.
Hereinafter, the temporal changes of land use anomalies on wetlands will be discussed firstly by alteration methods, and secondly by time periods.
Surprisingly, there are some data showing that at the turn of the 18–19th centuries, “in some places”
swamps and sodic lands were already ploughed in this region (Molnár, 2007).
According to our GIS analysis, at the end of the
19th century (1881–83) there were water-affected areas that were utilized as arable land, despite the risk of inundation (or existing waterlogged state of surface?). Presumably, these were such wetlands covered with shallow and periodic surface water that were inundated only for a short period (for some week), and only during the period with the highest groundwater table, since surface waters are not shown in all the analysed maps. Furthermore, the 2000 orthophoto also indicates rather a waterlogged state of soil beside the surface water covers appearing in these places only in small patches.
It was also surprising that in the 1930’s, according to the source maps, the total area of ploughed wetlands increased dramatically in the research area. Based on the indirect information (severe drought, lack and presence of certain buildings with known construction time), we can conclude that most of the sections of the source maps represent a land cover preceding the year of their publication (1941). The most likely is the middle of the 1930’s (1934–36).
This time, according to the source map, in many water-affected areas, such as in the greater part of Szék Lake and Szappanos Lake in Kecskemét, there is a lack of marking of water cover or grassland.
The distinction of waterlogged surfaces from the water-covered grassland with a unique mark, and the lack of the delimination of illustrated hygrophilous vegetation in some places also refer to arable lands with inland excess water. Szék Lake and Szappanos Lake are also missing from another map source originating from the 1930’s (MFI 1938), where in their place either waterlogged sites, or reeds, or swamps or lakes are not signed.
One of the reasons of ploughings may be the crisis in the world economy and the local economy (Szilágyi, 2012), that led in obligate way to extreme land use and requisition of production sites with basically unfavourable conditions. As another factor, it can be taken into account that the soils were so desiccated due to the extremely dry, droughty period that their cultivation did not temporarily collide with the natural constraints.
According to hydrometeorological data, 1934–
35 years were very dry and the previous period was also typically dry in the Great Hungarian Plain (Pálfai, 2004). In accordance with Szilágyi’s data (Szilágyi 2012), between 1928 and 1935, there were such four years in the Kecskemét area, when either extremely low precipitation (annual amount below 400 mm), or very high average annual temperature (above 11 °C) was observed. In addition to the permanently dry and droughty weather, the (social) effects of the economic crisis have also appeared at
the same time. In our opinion, the climate change factor led also by itself and also by strengthening the effects of local economic crisis to the large-scale ploughings of water-affected areas. Thus, a combination of socio-economic and natural causes played a decisive role in the extraordinary occurrence of land use anomalies.
The frequent and sparse occurrence of the ploughed plots on the result maps indicates that the utilization of water-affected areas as arable land was widespread this time, and a general impact can be supposed in the background.
The 1940’s and 1950’s also brought a significant change in the utilization of wetlands. By the end of this time period (1957–59), the changes in the extent and proportion of the ploughed wetlands shows that some of the formerly cultivated water- affected areas turned into mapped contiguous water cover, grassland or grassy fallow again. This means local and substantial abandonment of arable farming on wetlands. Presumably, the inundations of previous years (e. g. 1940–42) with extreme amount of precipitation were mainly responsible for the abandonment of cultivation on the production sites with the above-mentioned bad physical conditions and natural constraints.
For the years direct after the regime change (1992–96), the proportion of the ploughed wetlands (2.5–2.7%) did not change significantly, as a percentage of the total water cover, but in absolute terms, the change in size of ploughed area is clear.
The growth from ca. 88 hectares to ca. 98 hectares can be explained theoretically also by natural (e.g.
aridification) and socio-economical factors (e.g. due to the privatization, new owners and fragmentation by divided, smaller ground-plots), too.
In the years following the regime change, a general wave of ploughings affected the Danube–
Tisza Interfluve region, irrespective of natural production site conditions. According to the researchers, those wet grasslands situated in the depressions were more suitable for arable land and afforestation where the decline in groundwater level was higher (Biró et al., 2013).
The aridification in the Danube–Tisza Interfluve has been experienced from the 1970’s, with special regard to the decrease in ground water table.
For this process different anthropogenic factors (for example use of underground water, afforestations) and the climate change are responsible, too (Major &
Neppel, 1988, Pálfai, 1994). The role of construction of drainage ditches is also emphasized by some experts (Iványosi Szabó, 1994). Besides the aridification, there have been some years in the near past (e.g. in 2006, 2010–2011, 2013, 2015), when the
surface waters have returned with great extent. This happened in the year of 2018, too.
It also follows from the foregoing that the cultivation of arable lands with inland excess water was abandoned in several new places. At the same time, new water-affected areas were also tilled, too (e.g. the Papp Lake between Fülöpháza and Ágasegyháza). Later, after the reappearance of deep and durable surface water (e.g. in 1999–2000), the cultivation was abandoned on some of these sites again. This is how a part of the Papp Lake has become grassland, while other parts of it remained utilized as an arable land, in spite of the environmental risks. The slight increase in the size of ploughed wetlands in the last examined period was also made possible by aridification, as it is supposed.
Wood plantations or self-forestations on wetlands became more significant only from the second half of the 20th century in line with the state and the EU support. Following the regime change, the size of afforested wetlands (5.2 hectares) is only a small proportion of the ploughed wetlands. According to the field-work, when we investigated these places, the most frequently planted tree species are Populus sp. and Elaeagnus angustifolia. Although these species bear periodically the unfavourable natural site conditions, however, during the process of their plantation the semi-natural vegetation has been destructed. That is one of the reasons for considering these cases as a land use anomaly. Other reason is the alteration of traditional landscape structure.
Thanks to broaden wood plantations, which have been helped by the sustaining aridification, their total size increased for 2008–2009 to 7.2 hectares.
According to our data, the horticultural use appeared on wetlands around mid-20th century, although its importance in the economy and general land use was also already high before. This kind of utilization in the water-affected areas increased for 2008–2009 from 0.4 hectares to 1.2 hectares that means triple size. In absolute terms, compared to the other alteration methods, land use anomalies ensuing from horticulture remained negligible all the time.
Every plantation affected new waterlogged production sites, which also means the abandonment of the earlier use.
Constructions on wetlands basically had two ways (types) in the past in the study area. One way is the construction of buildings and roads, what unfortunately includes the destruction of original vegetation by landfill, soil sealing and land take for communal and private purposes. In the beginning, the raised roads crossing the wetlands were made of earth and the land take was minimal in the case of them.
Outside Kecskemét, in the urban fringe and the rural
landscape, the roads were developed from the very beginning of the 20th century by broadening and laying stone, concrete and later asphalt layer (Juhász, 1998).
There are more examples of land take, landfill and soil sealing for communal purposes from the first half of the 20th century. For instance in 1925, the city bath including a building was also constructed in the place of the former Szék Lake, which was suitable for fishing at one time. In connection with the increasing urbanization process of Kecskemét since the middle of the 20th century, the growth of the compact city body has led to constructions on new wetlands in the urban fringe. Some parts of the Szék Lake, after the filling up of the lake bed, were occupied by various constructions and facilities (e.g. buildings and road network of urban waterworks, a part of the county hospital, camping).
Outside Kecskemét, in the rural settlements, there were also wetlands covered by buildings. The houses of the easternmost street of Ágasegyháza were built in the late 1970’s and early 1980’s during the period of the aridification. It became proven later that it was irrational meaning a land use anomaly, because during the periods with high groundwater table (e.g.
in 2000, 2010) the water surplus of Ágasegyháza Lake appeared in the gardens, cellars and at the foot of the houses (Kákonyi, 2015). Fülöpháza, which is surrounded by wetlands, also contains such buildings constructed before the regime change that are endangered by surface water. The constructions in these water-affected areas could be encouraged by the fact that they were prohibited in the periphery from 1949 to 1986. At the same time, buildings around the centre appointed for the new village was supported with favourable loans.
Recently, the expansion of the residential area in Hetényegyháza and the construction of a waste landfill in Kecskemét have caused the transformation of wetlands, as well. In the urban fringe, in many other places, the M5 motorway, residential estates, and industrial-commercial units were built on former marshes and periodical lakes.
Other type of constructions on wetlands is the construction of water facilities. Until the second half of the 20th century, only small and shallow depressions were excavated in order to open the ground water table for different purposes. Since 1976, large-scale works have started in the neighbourhood of Kecskemét, where a certain part of Szék Lake was converted into rainwater reservoirs and recreational ponds, in parallel with the above-mentioned buildings executed on it (Juhász, 1998).
At the end of the 20th century, it became particularly typical that wetlands with semi-natural
habitats were converted into ponds of various kinds and into artificial lakes. Based on the topographic map (1992–1996), in the study area at least in ten places fishponds, fishery, reservoirs, recreation ponds or watering place for game have been established.
Recently, wetlands were transformed into artificial lakes, for example, in Matkópuszta (Kecskemét) and northwest of Kerekegyháza. The frequent emergence of recreational ponds serving the relaxation of the city's and the vicinity’s population in the urban fringe of Kecskemét, can be associated with the urban sprawl. This expansion process affecting Kecskemét has been examined and noted by several researchers (Csatári, 2009, Csatári et al., 2013, Kovács et al., 2017).
As the results show, the different alteration methods affected the wetlands not to the same extent.
Ploughings was the most significant from between them. Besides, it has caused serious ecological damages of wetlands in several places, it could be regarded also irrational use in the longer term, because of the risk of inland excess water. After ground excavation or filling new buildings and new water facilities often occurred in water-affected areas.
Wood plantation and plantation of horticultural products affecting wetlands has appeared only rarely in the remote and the recent past.
On the one hand, the outlier proportion of ploughings can be explained by the a priori great territorial share of arable land cultivation in the landscape. Further explanations are the large area demand for farming, the low labour input and the lower risk associated with assets. In the case of buildings and water facilities, a smaller share and area demand (for land take), but a higher labour input per unit area (extra earth moving) and a higher risk associated with assets must be considered.
On the other hand, in the case of water facilities, wetlands yield evidently extraordinary benefits for them. Forced pressure of utilization concerning a specific production sites was not typical for plantation of wood or horticultural products, and the disadvantages of water surplus are rather clear, so they could avoid wetlands easily.
It can play a significant role in the changes of traditional land use structure that local people’s relationship to the landscape has also changed. The lack of (traditional) landscape knowledge of new owners can also be considered as a wetland alteration factor (Ujházy & Biró, 2013).
The question could arise, whether the existing water management facilities and the climate change how have already affected and will affect the emergence of the land use anomalies appearing on wetlands.
The drainage network constructed in the study area since the second half of the 1960’s detracts considerable amount of water from the landscape, but it cannot completely prevent the situation of emerging inland excess water, thanks to the specific geological, morphological and hydrological conditions (Iványosi Szabó, 2001, Láng et al., 2007).
In the course of climate change a decrease in the amount of precipitation, which occurred not so heavily in the last millennium, and a warming trend has been experienced (Rakonczai & Ladányi, 2010). This also means an increase in the frequency and severity of droughts, which have been observed in the recent decades (Fiala et al., 2014). The risk of drought and the droughtiness is likely to intensify in the region, in the future (Blanka & Mezősi, 2012, Mezősi et al., 2013).
The periodic inundation of wetlands, which were annual (regularly) recurrent, has happened recently only in the years of the highest rainfall, and due to climate change, it will only be expected in the wetter periods in the future. Due to their natural conditions, the environmental risks of water-affected areas will be remained, but – as it follows from the previous experiences of climate change and from the predictions – the frequency and the duration of water covers, and the water-saturated state of soils are expected to decrease. However, based on the climate models, a significant change in the risk of inland excess water is not expected, but only a slight decrease is presumable (Mezősi et al., 2014).
6. CONCLUSIONS
As it can be seen, land use anomalies on wetlands existed in the past, too. Parallel to anthropogenization more and more wetlands were altered by different ways. This general transformation process was sometimes also driven by special factors, for example, by aridification or economical pressure, which caused an outlier in the first half of the 20th century.
Based on the recent past landscape transformation, we can conclude that even today wetlands with natural or semi-natural vegetation are endangered. The main threatening factor is arable farming by ploughings. It is also important to emphasize the threatening role of constructions of buildings and water facilities, mainly in the surroundings of Kecskemét. Especially, the number of water facilities is expected to increase due to the growing demand of recreation (angling without or attached to weekend houses). The endangerment of wood plantation cannot be also excluded, but this is only a subordinate land use compared to other alteration methods. The plantation of horticultural
products is also an uncommon risk factor for wetlands.
On the whole, the above-mentioned facts also mean that land use anomalies will continue to be present on wetlands and may emerge in new locations. If we would like to achieve environmentally conscious, sustainable land use, we need to emphasize the aspects of adaptation and rehabilitation. This may mean, for example, in the case of arable lands, the conversion to grassland and the abandonment of cultivation, or we can also implement ecological-oriented water storage by better retention of waters. Thus, not only land use could become more adaptive to the natural conditions, but also the situation of water management and nature conservation could improve.
REFERENCES
Akinci, H., Özalp, A.Y. & Turgut, B. 2013. Agricultural land use suitability analysis using GIS and AHP technique. Computers and Electronics in Agriculture, 97, 71–82.
Antrop, M. 2005. Why landscapes of the past are important for the future. Landscapes and Urban Planning, 70, 21–34.
Asselen, S.V, Verburg P.H., Vermaat J.E. & Janse J.H.
2013. Drivers of Wetland Conversion: a Global
Meta-Analysis. PLoS ONE 8, 11,
e8129210.1371/journal.pone.0081292
Biró M. & Molnár Zs. 1998. A Duna–Tisza köze homokbuckásainak tájtípusai, azok kiterjedése, növényzete és tájtörténete a 18. századtól. (The landscape types of sand dune areas of Danube–Tisza Interfluve, their extension, vegetation and landscape history from the 18th century) Történeti Földrajzi Tanulmányok 5, Nyíregyháza. 29 p. (in Hungarian) Biró M., Czúcz B., Horváth F., Révész A., Csatári B. &
Molnár Zs. 2013. Drivers of grassland loss in Hungary during the post-socialist transformation (1987–1999). Landscape Ecology, 28, 5, 789–803.
Blanka V. & Mezősi G. 2012. A klímaváltozás várható környezeti hatásai az Alföldön. (Expected environmental impacts of climate change on the Great Hungarian Plain) In: Nyári D. (szerk.):
Kockázat – Konfliktus – Kihívás. A VI. Magyar Földrajzi Konferencia, a MERIEXWA nyitókonferencia és a Geográfus Doktoranduszok Országos Konferenciájának Tanulmánykötete, Szeged, 60–71. (in Hungarian)
Csatári B. 2009. Esettanulmány – Kecskemét és térsége (A case study – Kecskemét and its sorroundings). In.:
Ricz J., Salamin G., Sütő A., Hoffmann Cs. & Gere L.: Koordinálatlan városnövekedés az együtt tervezhető térségekben: A települések lehetséges tervezési válasza, VÁTI, Budapest, 56–58, 78–140.
(in Hungarian)
Csatári, B., Farkas, J. & Lennert, J. 2013. Land use changes in the rural-urban Fringe of Kecskemét after the Economic Transition. Journal of Settlements and
Spatial Planning, 4, 2, 15–159.
Dévai Gy., Dévai I., Felföldy L. & Wittner I. 1992. A vízminőség fogalomrendszerének egy átfogó koncepciója 3. rész: Az ökológiai vízminőség jellemzésének lehetőségei. (A comprehensive concept of the terminology of water quality Part 3:
Possibilities for characterizing of ecological water quality.) Acta biol. Debr., Suppl. oecol. hung., 4, 49–
185. (in Hungarian)
Dövényi Z. (ed) 2010. Magyarország kistájainak katasztere.
(Inventory of microregions of Hungary) 2. revised, extended edition, MTA Földrajztudományi Kutató Intézet, Budapest. 876 p. (in Hungarian)
Dumanski, J., & Onofrei, C. 1989. Techniques of crop yield assessment for agricultural land evaluation.
Soil Use and Management, 5, 9–16.
Eliasson, Å. 2007. Review of Land Evaluation Methods for Quantifying Natural Constraints to Agriculture. The Institute for Environment and sustainability, Joint Research Centre, Ispra, Italy. EUR 22923 EN-2007.
50 p.
FAO 1976. A framework for land evaluation. FAO soils bulletin, 32, Rome, Italy.
Fiala K., Blanka V., Ladányi Zs., Szilassi P., Benyhe B., Dolinj D. & Pálfai I. 2014. Drought severity and its effect on agricultural production in the Hungarian- serbian cross-border area. Journal of Environmental Geography 7, 3–4, 43–51.
Fischer G., van Velthuizen H.T., Shah M. &
Nachtergaele F.O. 2002. Global Agro-ecological Zones Assessment for Agriculture in the 21st Century: Methodology and Results, IIASA Research Report RR 02-02. IIASA and FAO, Laxenburg, Austria.
Forman, R. T. T. & Godron, M. 1986. Landscape Ecology. John Wiley and Sons, New York 619 p.
Fuchs, R., Herold, M., Verburg, P.H. & Clevers, J.G.P.W. 2013. A high-resolution and harmonized model approach for reconstructing and analysing historic land changes in Europe. Biogeosciences, 10, 1543–1559.
Gimmi, U., Lachat, Th. & Bürgi, M. 2011. Reconstructing the collapse of wetland networks in the Swiss lowlands 1850–2000. Landscape Ecology, 26, 1071–
1083.
Gyalog L. & Síkhegyi F. (eds) 2005. Magyarország földtani térképe, M=1:100.000 (FDT100). (Geological Map of Hungary). Publication of Magyar Állami Földtani Intézet (Geological Institute of Hungary), Budapest Haase, G. 1978.Tájhasznosítási feladatok tervezésének és
megvalósításának ökológiai-földrajzi alapjai.
(Ecological-geographical basics of planning and implementing of land use tasks). Földrajzi Közlemények 26, 1–2, 101–117. (in Hungarian) Havlíček, M., Pavelkova, R., Frajer, J. & Skokanová,
H., 2014. The Long-Term Development of Water Bodies in the Context of Land Use: The Case of the Kyjovka and Trkmanka River Basins (Czech Republic). Moravian Geographical Reports, 22, 4, 39–50.
Heumann, B.W., Walsh, S.J., Verdery, A.M., McDaniel, P.M. & Rindfuss, R.R. 2013. Land Suitability Modeling using a Geographic Socio-Environmental Niche-Based Approach: A Case Study from Northeastern Thailand. Annals of the Association of
American Geographers, 103(4):
10.1080/00045608.2012.702479.
Iojă, I.C., Osaci-Costache, G., Breuste, J., Hossu, C.A., Grădinaru, S.R., Onose, D.A., Nită, M.R. &
Skokanová, H., 2018. Integrating urban blue and green areas based on historical evidence. Urban Forestry & Urban Greening, 34, 217–225.
Iványosi Szabó A. 1994. A Duna–Tisza közi hátságon bekövetkezett talajvízszint-süllyedés hatása természetvédelmi területeinkre. (Impact of dropping in the ground water table occurring in Danube–Tisza Interfluve in our nature conservation areas) In: Pálfai I. (ed): A A Duna–Tisza közi hátság vízgazdálkodási problémái, A Nagyalföld Alapítvány kötetei 3, Békéscsaba, 77–85. (in Hungarian)
Iványosi Szabó A. 2001. Antropogén táj- és életföldrajzi változások a Duna-Tisza közén (tájtörténeti vázlat).
(Anthropogenic landscape and biogeographical change in Danube–Tisza Interfluve. Landscape historical synopsis). In: Fodor I., Tóth J. & Wilhelm Z. (ed): Ember és környezet - Elmélet, gyakorlat.
Tiszteletkötet Lehmann Antal professzor úr 65.
születésnapjára. – PTE-TTK-Földrajzi Intézet és Duna-Dráva NPI, 201–207. (in Hungarian)
Jakucs P., Keresztesi Z., Marosi S., Pécsi M., Somogyi S.
1989. Tájtípusok. (Landscape types). In: Pécsi (ed.):
Magyarország Nemzeti Atlasza. Kartográfiai Vállalat, Budapest, 90–91. (in Hungarian)
Joss, B. N., Hall, R. J., Sidders, D. M. & Keddy, T. J.
2008. Fuzzy-logic modeling of land suitability for hybrid poplar across the Prairie Provinces of Canada. Environmental Monitoring and Assessment, 141, 79–96.
Juhász I. 1998. Kecskemét város építéstörténete. (Building history of Kecskemét). Kecskemét Monográfia Szerkesztőség, Kecskemét, 362 p. (in Hungarian) Kákonyi Á. 2015. A víztelenség vízrajza. (Hidrography of
waterless). In: Iványosi Szabó A. (ed.): A Kiskunsági Nemzeti Park Igazgatóság negyven éve. Kiskunsági Nemzeti Park Igazgatóság, Kecskemét, 16–30. (in Hungarian)
Kalogirou, S. 2002. Expert systems and GIS: an application of land suitability evaluation. Computers, Environment and Urban Systems, 26, 89–112.
Kerényi A. & Csorba P. 2012: A tájökológiai kutatások szerepe a tájvédelemben és a kutatási eredmények gyakorlati hasznosításának feltételei. (The role of landscape ecological research in landscape protection and the conditions for the practical utilization of research results). In: Farsang A., Mucsi L., Keveiné Bárány I. (eds.): Táj – érték, lépték, változás. Geolitera SZTE TTIK Földrajzi és Földtani Tanszékcsoport, Szeged, 19–32. (in Hungarian) Kovács A. D., Hoyk E. & Farkas J. Zs. 2017.
Homokhátság – a semi-arid region facing with
complex problem in the Carpathian basin. European Contryside, 1, 29–50.
Láng I., Csete L. & Jolánkai M. (eds.) 2007. A globális klímaváltozás: hazai hatások és válaszok.
A VAHAVA jelentés. (Global climate change:
domestic impacts and responses. The VAHAVA report). Szaktudás Kiadó Ház Rt., Budapest, 220 p.
(in Hungarian)
Lewis, W. M. Jr., Bedford, B., Bosselman, F. Ilt, Brinson, M., Garrett, P., Hunt, C., Johnston, C., Kane, D., Macrander, A. M., Mcculley, J., Mitsch, W. J., Patrick, W. Jr., Post, R., Siegel, D., Skaggs, R. W., Strand, M. & Zedler, J. B.
1995. Wetlands: characteristic and boundaries.
National Academy Press, Washington D.C, 306 p.
Major P. & Neppel F. 1988. A Duna-Tisza közi talajvízszint-süllyedések. (Dropping in the ground water table in Danube–Tisza Interfluve). Vízügyi Közlemények, 70, 4, 605–626. (in Hungarian) Marosi S. & Somogyi S. (ed) 1990. Magyarország
kistájainak katasztere I–II. (Inventory of microregions of Hungary I–II.) MTA Földrajztudományi Kutató Intézet, Budapest. 1023 p. (in Hungarian)
Mezősi G., Meyer B. C, Loibl W., Aubrecht C., Csorba P.
& Bata T. 2013: Assessment of regional climate change impacts on Hungarian landscapes. Regional Environmental Change, 13, 4, 797–811.
Mezősi G., Bata T., Meyer B. C, Blanka V. & Ladányi Zs. 2014. Climate change impacts on environmental hazards on the Great Hungarian Plain, Carpathian Basin. International Journal of Disaster Risk Science, 5, 2, 136–146.
MFI (Magyar Földrajzi Intézet R. T.) [Hungarian Geographical Institute PLC] 1938: Kecskemét th.
város külső területének térképe, M=1:100.000 (Map of outer area of Kecskemét Municipality, SC=1:100.000) Magyar Földrajzi Intézet R. T.
(Publisher), Budapest (in Hungarian)
Molnár Zs. 2007. Történeti tájökológiai kutatások az Alföldön. (Studies in historical landscape ecology in the Great Plain). Ph.D. dissertation. University of Pécs, Doctoral School of Biology, Pécs, 291 p. (in Hungarian)
Naveh, Z. & Lieberman, A.S. 1984. Landscape Ecology:
Theory and Application. Springer, New York, 356 p.
OMSZ (Országos Meteorológiai Szolgálat [Hungarian Meteorological Service]) 2018. Climate of Hungary.
http://www.met.hu/en/eghajlat/magyarorszag_eghajla ta/ (Download: 02.03.2018)
Pálfai I.1994. Összefoglaló tanulmány a Duna–Tisza közi talajvízszint-süllyedés okairól és a vízhiányos helyzet javításának lehetőségeiről. (Summary study on the causes of dropping of the groundwater table in the Danube–Tisza Interfluve and on the possibilities for improving the situation with the water scarcity). In:
Pálfai I. (ed): A Duna-Tisza közi hátság vízgazdálkodási problémái. A Nagyalföld Alapítvány kötetei 3, Békéscsaba, 111–126. (in Hungarian) Pálfai I. 2004: Belvizek és aszályok Magyarországon.
(Inland excess waters and droughts in Hungary).
Hidrológiai tanulmányok. – Közlekedési dokumentációs Kft. kiadványa, Budapest, 492 p. (in Hungarian)
Pereira, Ch. 1996. The role of Agricultural Research in the development of Kenya before Independence. Review of Kenyan Agricultural Research, Vol 1.
KARI/CAZS, Nairobi/Bangor. 41 p.
Pécsi M., Somogyi S., Jakucs P. 1972: Magyarország tájtípusai. (Landscape types of Hungary). Földrajzi Értesítő 21, 1, 5–12. (in Hungarian)
Rakonczai J. & Ladányi Zs. 2010: A sejthető klímaváltozás és a Duna-Tisza közi Homokhátság.
(The foreseeable climate change and the Sand Ridge in Danube–Tisza Interfluve). Forrás, 42, 7–8, 140–
152. (in Hungarian)
Rossiter, D.G. 1996. A theoretical framework for land evaluation. Geoderma, 72, 165–190.
Ružička, M. & Miklós, L. 1982: Landscape-ecological planning (LANDEP) in the process of territorial planning. Ekológia, 1, 3, 297–312.
Singha, C. & Swain, K.C. 2016. Land suitability evaluation criteria for agricultural crop selection: A review.
Agricultural Reviews, 37, 125–132.
Szilágyi F., Padisák J., Szalma E. & Kovács Cs. 2004.
Természetes tavak tipológiájának és specifikus
referencia-viszonyainak jellemzése.
(Characterization of typology and specific reference conditions of natural lakes.) Final report for VITUKI Kht., 70 p.+Appendix (in Hungarian) Szilágyi F. 2007. Vizes élőhelyek. (Wetlands). In: Szilágyi
F. & Orbán V. (ed): Alkalmazott hidrobiológia.
Víziközmű Szövetség, Budapest, 491–517. (in Hungarian)
Szilágyi Zs. 2012. Homokváros. Kecskemét történeti földrajzi látószögek metszetében. (Sandcity.
Kecskemét in the section of historical geographical angles). Kecskeméti Örökség Könyvek 2. Kecskemét Írott Örökségéért Alapítvány, Kecskemét, 188 p. (in Hungarian)
Tudor, C.A., Iojă, I.C., Rozylowicz, L., Pǎtru- Stupariu, I., & Hersperger, A.M. 2015.
Similarities and differences in the assessment of land-use associations by local people and experts.
Land Use Policy, 49, 341–351.
Töpfer, F. & Pillewizer, W. 1966. The Principles of Selection: A means of cartographic generalization.
The Cartographic Journal, 3, 1, 10–16.
Ujházy N. & Biró M. 2013. A vizes élőhelyek változásai Szabadszállás határában. (Changes of wetlands in the periphery of Szabadszállás) Tájökológiai Lapok, 11, 2, 291–310. (in Hungarian)
von der Dunk, A., Grêt-Regamey, A., Dalang, T. &
Hersperger, A.M. 2011. Defining a typology of peri- urban land-use conflicts – A case study from Switzerland. Landscape and Urban Planning, 101, 149–156
Van Orshoven, J., Terres J. M. & Tóth, T. 2012: Updated common bio-physical criteria to define natural constraints for agriculture in Europe. Definition and scientific justification for the common biophysical
criteria; Technical Factsheets. Jrc Technical and Scientific Reports, EUR, 25203.
Welch, B. M. 1996. Survival by Association: Supply management landscapes of the Eastern Caribbean.
McGill-Queen's University Press, Ithaca, New York, 364 p.
Yang, Y., Zhang, S., Yang, J., Chang, L., Bu, K. & Xing, X. 2014. A review of historical reconstruction methods of land use/land cover. Journal of Geographical Sciences, 24, 746–766.
Zomer, R.J., Trabucco, A:, Bossio, D.A. & Verchot, L.V.
2008. Climate change mitigation: A spatial analysis of global land suitability for clean development mechanism afforestation and reforestation.
Agriculture, Ecosystems and Environment, 126, 67–
80.
Zonneveld, I.S. & Forman, R.T.T. 1990. Changing Landscapes: An Ecological Perspective. Springer- Verlag, New York, 286 p.
Received at: 18. 09. 2018 Revised at: 16. 02. 2019
Accepted for publication at: 22. 02. 2019 Published online at: 02. 03. 2019