DOI: 10.2478/jengeo-2019-0011 ISSN 2060-467X
INTEGRATED APPROACH TO ESTIMATE LAND USE INTENSITY FOR HUNGARY
Gábor Mezősi 1*, Burghard C. Meyer2, Teodóra Bata1, Ferenc Kovács1, Bálint Czúcz3, ZsuzsannaLadányi1, Viktória Blanka1
1Department of Department of Physical Geography and Geoinformatics, University of Szeged, 6722 Szeged, Egyetem u. 2-6, Hungary
2Department of Physical Geography and Geoecology, Institute of Geography, Leipzig University, Johannisallee 19a, 04103 Leipzig, Germany
3Centre for Ecological Research, Hungarian Academy of Sciences, Alkotmány u. 2-4, 2163 Vácrátót, Hungary
*Corresponding author, e-mail: mezosi@geo.u-szeged.hu Research article, received 7 October 2019, accepted 30 November 2019
Abstract
An integrated approach was applied in this article to provide a medium-scale map of land use intensity for Hungary. The main goal was to estimate its value by a small set of parameters, which are freely available and have a high resolution. The basis of the evaluation was the CORINE 2012 dataset, and a matrix method was applied to integrate the ratio of natural/semi-natural vegetation, woody vegetation and the Natural Capacity Index in the assessment to describe the complex approach of land use intensity. The medium level land use intensity map provides information for decision makers/landscape planners on the current status and spatial pattern of anthropogenic impact and indicates those hot-spots where land use intensity is high and should be focused research and management to intervene in order to encourage sustainable land use. 46% of the arable lands in Hungary show the most intensive land use.
Comparing the map with the previously published hemeroby map of Hungary, more intensive impact on landscape transformation through human action was found. In agricultural areas both researches agree that the intensity and human activity is really high, and the lowest intensity class is rare in Hungary except for mountain regions and protected areas.
Keywords: intensity, matrix method, CORINE, naturalness
INTRODUCTION
Measuring the intensity of changes in land use is one of the key issues considering the assessment of anthropogenic impacts. Without investigation, it is understandable that human influences play a key role in intensifying land use (e.g. global growth of settlements and industrial areas). The intensity of land use can be approached from different content and structural aspects (Erb et al., 2013). Well-known approach is the economic approach, however other attempts to assess the factors driving the intensification of changes (e.g. population, technology), or the anthropogenic and social changes leading to it, are also frequent. Lots of one-dimensional indicators are used to determine the extent of intensity e.g. annual crop yield, rotation length, size of forest and uncultivated areas, frequency of sowing, the magnitude of biodiversity, the size of labour and capital per field, annual production of the area, the climate, soil and technique affecting the crop yield (Herzog et al., 2006;
Erb et al., 2012; Verbung, 2013). A key issue concerning intensity is how to measure the impacts of anthropogenic effects on a given region. The methods of solution usually depend on the question to be answered, but the systemic character and the complexity of the affected environment cannot be ignored.
Calculations that include multiple factors into one index are also used to express land use intensity. One such complex index with regard to agricultural
utilization is, for example, the ILI index (Indicators of Landuse Intensity - Herzog et al., 2006) which includes the N content and the pesticide use of a unit area; the "r"
index signifying the actual yield and the reference yield under the conditions of strictly determined economic and technological factors (Dietrich et al., 2012). Various landscape indices and irrigation, ploughing and land use change data were also attempted to be combined into another agricultural intensification index with geostatistical methods (Culman et al., 2010). According to the logic used, all of these attempts show to what extent anthropogenic activity changes agricultural productivity. Similar intensity calculations are also known for non-arable areas, the LUI (land use intensity) index is one of them, and it is used for meadows with the data of fertilization, mowing and animal husbandry (Blüthgen et al., 2012). Whatever method is used to measure the extent of intensity, it heavily depends on the topographic scale, the time scale used, and the studied agricultural activity (Temme and Verbung, 2011;
Verbung, 2013).
Intensity is a concept that encompasses the use, management, and infrastructure of an area, and a lot of different parameters are known to express it. This study attempts a medium-scale estimation of land use intensity for Hungary. A matrix concept was applied to estimate the land use intensity based on the ratio of natural areas and woody vegetation, further more naturalness for selected land use types in Hungary.
STUDY AREA
Hungary, having an area of 93 thousand km2, has a basin character where 80 % of the surface elevation is less than 200 m above sea level. About 75 % – more than 6 million ha – is agricultural area: the arable land, the forest area and grassland are 47%, 21% and 8.5 %, respectively. On 70% of the arable lands intensive, and about 30 % extensive agriculture is typical (Ángyán et al., 2003). The Hungarian basin area is characterized by a medium-scale, intensive arable area divided into parcels with sizes ranging from 1 to10 ha (van der Zanden et al., 2016). NUTS2 level assessment is not appropriate to allocate the territorial differences in land use intensity. Our evaluation was based on the 2012 CORINE Land Cover 2012 (CLC 2012) database (available for Europe), where out of the 44 land cover classes in Hungary 15 were chosen (Fig. 1), including agricultural areas (211 Non-irrigated arable land, 213 Rice fields, 221 Vineyards, 222 Fruit trees and berry plantations, 231 Pastures, 242 Complex cultivation patterns, 243 Land principally occupied by agriculture, with significant areas of natural vegetation), forest and semi-natural areas (311 Broad-leaved forest, 312 Coniferous forest, 313 Mixed forest, 321 Natural grasslands, 324 Transitional woodland-shrub, 333 Sparsely vegetated areas) and wetlands (411 Inland marshes, 412 Peat bogs). This resolution of data contributed to a medium-scale evaluation of intensity in land use in Hungary.
DATA AND METHODS
Partial input or output data (or a combination of them) for the present analysis were not applied in this study, but we intended to use an integrated approach. The reason behind it is that the majority of the cited research connected some kind of complexity to the concept of intensity (e.g.
Newbold et al., 2015). When designing the applied method, it was also necessary to be taken into account that the land use and land cover data available as remote sensing data, mostly used because of efficiency, and cannot be used directly or only to a limited extent to measure intensity changes. Among other things, it is due to the fact that it is difficult to detect the intensity of certain surface types, which manifest in the chemical or management characteristics of soils (Eckert et al., 2017).
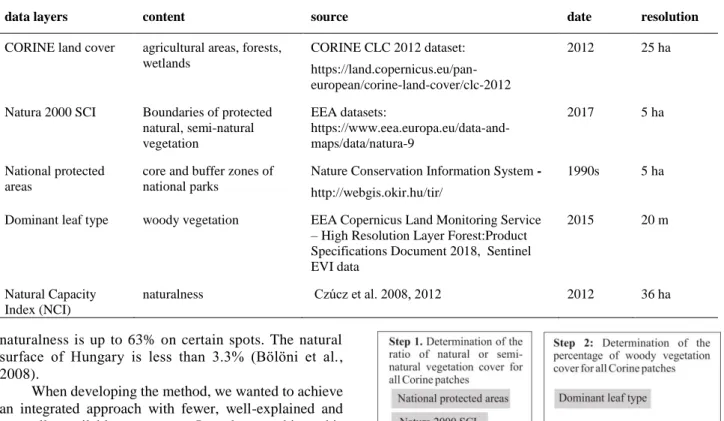
The applied data, their source and resolution is presented in Table 1 (CORINE CLC data without artificial areas, the boundaries of areas under nature conservation, and the extent of the woody vegetation based on the dominant leaf type, furthermore the Natural Capacity Index).
The national protected areas, as well as the Natura 2000 SCI areas were applied in the article to allocate the natural and semi-natural areas in Hungary. The boundaries of the woody vegetation were allocated by the Copernicus High Resolution Layers (HrL) data on dominant leaf type.
The applied Natural Capacity Index (NCI) essentially expresses the naturalness and size of the spots obtained as a result of the calculation in a size of 36 ha, in a gridded layout (Czúcz et al., 2012). In Hungary the maximum value is 63 (from 100), which means that the degree of
Fig. 1 Study area with the CORINE Land cover classes (CLC 2012) and the combined map of protected areas (Natura 2000 SCI and national park core areas and buffer zones)
naturalness is up to 63% on certain spots. The natural surface of Hungary is less than 3.3% (Bölöni et al., 2008).
When developing the method, we wanted to achieve an integrated approach with fewer, well-explained and generally available parameters. In order to achieve this goal, we used a simple method to identify intensity changes, a method that can identify those patches which exhibit more significant changes on a more detailed scale too, and, therefore, can be analyzed for their effect (Kuemmerle et al., 2016). The resulting categories can be compared to Lambin et al. (2001) and with van den Zanden et al. (2016) and the principles of intensity calculations, as well as with the parameters applied.
The workflow of the applied assessment is presented in Fig. 2. The first step was to determine of the percentage of natural or semi-natural vegetation cover for each land cover patch (based on the combined map of protected areas maps: Natura 2000 SCI, the core and buffer zone of the national parks without weighting). As a second step the percentage of woody vegetation cover based on the dominant leaf type HrL product was also assigned to each land cover patch. As step 3, a 5x5 matrix was provided using the ratio of natural vegetation and woody vegetation to all selected CLC 2012 patches. Using the matrix method, the relationship between natural vegetation and woody land cover was investigated. The naturalness of vegetation and the percentage of forest cover were also grouped into 5-5 clusters. The clusters were evenly distributed (0-3%, 3-25%, 25-50%, 50-75, >75%). Thus, the result has become quite uniform, with an intensive anthropogenic use of the area on scale 1-5. As the last step, the refinement of the matrix results was done by the Natural Capacity Index (NCI) compiled with field surveys (Czúcz et al., 2008, 2012), the results of these detailed recordings at a resolution of 36 ha were used on a 3-km- mesh. NCI data was integrated also with the application of an 5x5 matrix. As a result, the produced classes represent the intensity of land use for all CORINE patches from 1 to 5, where 1 indicates the most intensive land use.
Fig. 2 Workflow of the applied assessment
RESULTS
The ratio of natural and semi-natural vegetation in most agricultural areas (211, 213, 221, 222, 242) is very low (Table 2). Almost 99% of the patches include less than 3%
natural and semi-natural vegetation cover. Among agricultural areas, 231 and 243 can be represented with higher ratios of natural or semi-natural vegetation cover, however, still 95% is represented by natural vegetation cover lower than 3%. In this case, however, approx. 2,5%
of the CORINE patches are covered with natural vegetation over 75%. For forests, the ratio of natural and semi-natural vegetation is still low in case of the 311, 312, 313 categories, since these are mostly planted forests. But Table 1 The applied datasets in the integrated approach
data layers content source date resolution
CORINE land cover agricultural areas, forests, wetlands
CORINE CLC 2012 dataset:
https://land.copernicus.eu/pan- european/corine-land-cover/clc-2012
2012 25 ha
Natura 2000 SCI Boundaries of protected natural, semi-natural vegetation
EEA datasets:
https://www.eea.europa.eu/data-and- maps/data/natura-9
2017 5 ha
National protected areas
core and buffer zones of national parks
Nature Conservation Information System - http://webgis.okir.hu/tir/
1990s 5 ha
Dominant leaf type woody vegetation EEA Copernicus Land Monitoring Service – High Resolution Layer Forest:Product Specifications Document 2018, Sentinel EVI data
2015 20 m
Natural Capacity Index (NCI)
naturalness Czúcz et al. 2008, 2012 2012 36 ha
in case of categories 321 and 333 (natural grasslands and sparsely vegetated areas) significant ratio (59, 80%) of the patches are represented with natural and semi-natural vegetation cover over 75%. They are mostly protected areas, only 18-28% of the patches are represented with 0-3% of natural and semi-natural vegetation cover. The extent of 411 and 412 categories are quite small related to all other categories. In more than 50% of their CORINE patches they are represented with natural and semi-natural vegetation cover less than 3%.
The ratio of woody vegetation in most agricultural areas (CLC codes: 211, 213, 221, 231, 242) is very low (Table 3). 85-99% of the patches include less than 3%
woody vegetation cover and 0% of the patches have woody vegetation cover over 75%. Only 222 (Fruit trees and berry plantations) show somewhat lower values (78%) for the 0-3% category. In this case, all other classes are evenly distributed, approx. 5%. The
category 243 shows similar values to 222. Among forest areas 311, 312, 313 (mostly planted forests) are characterised by high woody vegetation cover in 74- 78%, however, in 13-14% of the CORINE patches show less woody vegetation cover than 3%. In case of 333, almost all patches have no woody vegetation cover, 411 and 412 are characterised by mostly 25-50%
woody vegetation cover.
Based on the matrix method the relationship between natural vegetation and woody vegetation cover is demonstrated in Fig. 3. The results represent an intensive anthropogenic use of the study area, more than 70% cover of the category 1, which indicates intensive land use itself. This coincides with the results so far (e.g. Ángyán et al. 2003). After step 3 it becomes obvious that the overall picture on land use intensity based only these two parameters is more complex and shows different pattern than the land cover itself.
Table 2 Percentage of CORINE patches according to the 5 natural and semi-natural vegetation cover classes
CORINE 2012 Natural and semi-natural vegetation cover
0-3% 3-25% 25-50% 50-75 % >75 %
211 Non-irrigated arable land 98.60 0.70 0.07 0.14 0.49
213 Rice fields 96.95 0.00 0.00 0.00 3.05
221 Vineyards 99.23 0.10 0.28 0.09 0.30
222 Fruit trees and berry plantations 99.62 0.10 0.06 0.00 0.22
231 Pastures 95.07 0.61 1.02 0.72 2.58
242 Complex cultivation patterns 98.82 0.23 0.16 0.16 0.63
243 Land principally occupied by agr. with sign. areas of nat. veg. 95.68 0.32 0.46 0.98 2.56
311 Broad-leaved forest 79.58 2.35 4.34 7.21 6.52
312 Coniferous forest 81.05 0.36 0.35 0.80 17.44
313 Mixed forest 81.53 0.34 0.61 1.20 16.31
321 Natural grasslands 28.78 0.15 2.58 9.26 59.24
324 Transitional woodland-shrub 89.89 0.48 0.69 0.73 8.20
333 Sparsely vegetated areas 18.59 0.00 1.24 0.00 80.17
411 Inland marshes 50.59 0.38 0.80 1.53 46.70
412 Peat bogs 77.15 7.05 0.12 2.04 13.64
Table 3 Percentage of CORINE patches according to the 5 woody vegetation cover classes
Woody vegetation cover
0-3% 3-25% 25-50% 50-75 % >75 %
211 Non-irrigated arable land 98.13 1.79 0.06 0.02 0.01
213 Rice fields 99.95 0.05 0.00 0.00 0.00
221 Vineyards 94.51 3.87 1.32 0.31 0.00
222 Fruit trees and berry plantations 78.85 4.55 4.88 6.76 4.96
231 Pastures 90.82 5.92 2.41 0.68 0.16
242 Complex cultivation patterns 86.62 7.49 4.71 1.09 0.09
243 Land principally occupied by agr. with sign. areas of nat. veg. 71.16 6.33 14.14 6.89 1.47
311 Broad-leaved forest 13.05 0.53 0.79 7.21 78.43
312 Coniferous forest 13.47 0.29 1.16 9.14 75.94
313 Mixed forest 14.73 0.20 0.70 10.16 74.21
321 Natural grasslands 95.49 3.31 0.98 0.14 0.08
324 Transitional woodland-shrub 41.19 1.97 9.56 20.99 26.30
333 Sparsely vegetated areas 99.86 0.14 0.00 0.00 0.00
411 Inland marshes 89.09 4.88 3.75 1.72 0.55
412 Peat bogs 85.80 9.03 4.19 0.73 0.24
Fig. 3 The result map of step3: application of the matrix method to demonstrate the relationship of natural vegetation cover and woody vegetation cover in all selected CLC 2012 patches
Fig. 4 The result map of step 4: Landuse intensity map of Hungary (1-highest land use intensity; 5-lowest land use intensity)
The final land use intensity map, integrating NCI datasets, is presented in Figure 4. Concerning land use intensity, the mountaineus regions of Hungary (Transdanubian Mountains, North Hungarian Mountains, Transdanubian hills) are represented with the lowest land use intensity. The Little Plain located in NW Hungary is mostly charactersed by high land use intensity (class 1), in contrary to the Great Hungarian Plain, where we can found larger patches with medium intensity (or even low). The differences in soil attributes are clearly reflected in the resulted datasets: land use intensity on sandy soils, and salt- affected soils is lower compared to the neighbouring areas.
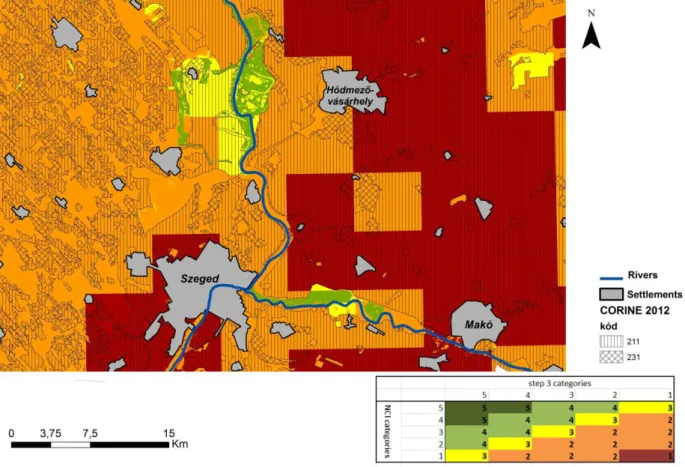
46% of the arable lands (211) in Hungary show the least naturalness, and the lowest ratio of woody vegetation and natural, semi-natural vegetation cover, thus, the most intensive use. It is similar only about 3% of the meadows (231). To show the details of the provided map, a zoom on the area neighbouring Szeged is shown in Figure 5, with an overlay of the CORINE codes 211 and 231, as the most frequent land covers of the Great Plain. This area is a good example of the differences between the different landscapes (here: alluvium, sandland, loess covered areas).
DISCUSSION AND CONCLUSION
For many, it is obvious that areas with strong anthropogenic influences, are characterized by ecological consequences such as the growing destruction of plants, a dramatic reduction in desirable biodiversity, an increase in the isolation of vegetation (e.g. in urban areas). In most cases, biodiversity change is mentioned, as it is
measurable well and its effects can be analyzed. its environmental expectations are clarified even according to EU standards (NATURA. 2000). Several procedures from various areas are known to measure the intensity of land use. In particular, input and output parameters (e.g.
crop yield per unit, N content) or their integrated version are used, thus, e.g. the Infrastructural Fragmentation Index (IFI), the Urban Fragmentation Index (UFI), or the Connectivity Index (CI) are defined (De Montis et al., 2017). The fragmentation of the landscape, which includes the fragmentation of larger units into smaller ones and the typical transformation of intensively used areas, is one of the most significant effects on ecosystem services (Jaeger et al., 2016).
We primarily attempted to measure the anthropogenic effects for the characterization of landscape diversity which is in connection with the land use intensity. Therefore, we compared the regional differences of intensity (Fig. 4) with the regional differences of hemeroby (Fig. 6, Csorba et al. 2018), because they both share the same causes in the background.
The hemeroby map by Csorba et al. (2018) shows less intensive impact on landscape transformation through human action, than this research. In agricultural areas both researches agree that the intensity and human activity is really high and the lowest intensity is rare in Hungary (except for mountain regions and protected areas).
More intensive use of cropland, generally determinded by high land use intensity, may affect to varying degrees on environmental parameters. For soil
Fig. 5 Land use intensity map around Szeged overlayed wih CLC 2012 layers with code 211 and 230
e.g. increase in compaction, structure degradation, or the higher level soil of erosion by water. In the case of vegetation, the decrease in biodiversity, growth of uncultivated areas and abandoned areas.
Our results indicates those hot-spots where land use intensity is high in regional scale. These areas should be focused regarding research, management and spatial planning too. With management of low-intensity pasture systems, conservation of high-value habitats and their associated biodiversity, it can be identified where and how to intervene in order to encourage sustainable land use.
References
Ángyán, J., Balázs, K., Podmaniczky, L., Skutai, J. 2003. Integrated Land Use Zonation System in Hungary as a Territorial Base for Agri-Environmental Program. In: Helming, K., Wiggering, H.
(eds) Sustainable Development of Multifunctional Landscapes.
Springer, Berlin, Heidelberg. 125–141. DOI: 10.1007/978-3-662- 05240-2_9
Blüthgen, N., Dormann, C.F., Pratic, D., Klaus, V. H., Kleinebecker, T., Hölzel, N., Alt, F., Boch, S., Gockel, S., Hemp, A., Müller, J., Nieschulze, J., Renner, S.C., Schöning, I., Schumacher, U., Socher, S.A., Wells, K., Birkhofer, K., Buscot, F., Oelmann, Y., Rothenwöhrer, C., Scherber, C., Tscharntke, T., Weiner, C.N., Fischer, M., Kalko, E.K.W., Eduard Linsenmair, K., Schulze, E- D, Weisser, W.W 2012. A quantitative index of land-use intensity in grasslands: Integrating mowing. grazing and fertilization. Basic and Applied Ecology 13, 207–220. DOI:
10.1016/j.baae.2012.04.001
CLC, 2012. CORINE Land Cover database. Available at:
https://land.copernicus.eu/pan-european/corine-land-cover/clc- 2012
Csorba, P., Ádám, Sz., Bartos-Elekes, Zs., Bata, T., Bede-Fazekas, Á., Czúcz, B., Csima, P., Csüllög, G., Fodor, N., Frisnyák, S., Horváth, G., Illés, G., Kiss, G., Kocsis, K., Kollányi, L., Konkoly- Gyúró, É., Lepesi, N., Lóczy, D., Malatinszky, Á., Mezősi, G.,
Szilassi, P., Tamás, L., Tirászi, Á., Vasvári, M. 2018. Landscapes.
In: Kocsis, K., Gercsák, G., Horváth, G., Keresztesi, Z., Nemerkényi, Zs. (eds.) National Atlas of Hungary. Hungarian Academy of science. 112–129. Availability of the map:
http://www.nemzetiatlasz.hu/MNA/National-Atlas-of- Hungary_Vol2_Ch10.pdf
Culman, S.W., Young-Mathews, A., Hollander, A.D., Ferris, D., Sanchez-Moreno, S., O’Geen, A.T., Jackson, L.E. 2010.
Biodiversity is associated with indicators of soil ecosystem functions over a landscape gradient of agricultural intensification.
Landscape Ecol 25(9), 1333–1346. DOI: 10.1007/s10980-010- 9511-0
Czúcz, B., Molnár, Zs., Horváth, F., Botta-Dukát, 2008. The natural capital index of Hungary Acta Botanica Hungarica 50 (Suppl.), 161–177. DOI: 10.1556/abot.50.2008.suppl.8
Czúcz, B., Molnár, Zs., Horváth, F., Nagy, G., Botta-Dukát, Z., Török, K. 2012. Using the natural capital index framework as a scalable aggregation methodology for local and regional biodiversity indicators. Journal for Nature Conservation 20 (3), 144–152.
DOI: 10.1016/j.jnc.2011.11.002
De Montis, A., Martín, B., Ortega, E., Ledda, A., Serra, V. 2017.
Landscape fragmentation in Mediterranean Europe: A comparative approach Land Use Policy 64, 83–94. DOI:
10.1016/j.landusepol.2017.02.028
Dietrich, J.P., Schmitz, C., Müller, C., Fader, M., Lotze-Campen, H., Popp, A. 2012. Measuring agricultural land-use intensity – A global analysis using a model-assisted approach. Ecological
Modelling 232, 109–118. DOI:
10.1016/j.ecolmodel.2012.03.002
Eckert, S., Kiteme, B., Njuguna, E., Zaehringer, J. G. 2017. Agricultural Expansion and Intensification in the Foothills of Mount Kenya: A Landscape Perspective. Remote Sens. 9, 784–803. DOI:
10.3390/rs9080784
Erb, K-H., Haberl, H., Jepsen, M.R., Kuemmerle, T., Lindner, M., Müller, D., Verburg, P.H., Reenberg, A. 2013. A conceptual framework for analysing and measuring land-use intensity.
Environmental Sustainability 5 (5), 464–470. DOI:
10.1016/j.cosust.2013.07.010
EU, 2017. Land Cover and Land use. DG Agriculture and Rural Development. Unit Farm Economics. European Union.
https://ec.europa.eu/agriculture/sites/agriculture/files/statistics/fa Fig. 6 Intensity of landscape transformation through human action (hemeroby) (Csorba et al. 2018)
Herzog, F., Steiner. B., Bailey, D., Baudry, J., Billeter, R., Bukácek, R., De Blust, G., De Cock, R., Dirksen, J., Dormann, C.F., DeFilippi, R., Frossard, E., Liira, J., Schmidt, T., Stöckli, R., Thenail, C., van Wingerden, W., Bugter, R. 2006. Assessing the intensity of temperate European agriculture at the landscape scale. European Journal of Agronomy 24(2), 165–181. DOI:
10.1016/j.eja.2005.07.006
Jaeger, J.A.G., Soukup, T., Schwick, Ch., Madriñán, L.F., Kienast, F.
2016. Landscape Fragmentation in Europe. In: Feranec, J., Soukup, T., Hazeu, G., Jaffrain, G. (eds) European Landscape Dynamics. CRC Press Taylor & Francis p. 367.
Kuemmerle, T., Levers, Ch., Karlheinz, Erb, K-H, Estel, S., Jepsen, M.R., Müller, D., Plutzar, Ch., Stürck, J., Verkerk, P.J., Verburg, P.H. 2016. Hotspots of land use change in Europe. IOP Publishing. Environmental Research Letters 11, 6. DOI:
10.1088/1748-9326/11/6/064020
Lambin, E.F., Rounsevell, M.D.A., Geist, H.J. 2001. Are agricultural land-use models able to predict changes in land-use intensity?
Agriculture. Ecosystems & Environment 82 (1–3), 321–331. DOI:
10.1016/s0167-8809(00)00235-8
Lambin, E.F., Geist, H.J. (eds.) 2006. Land-Use and Land-Cover Change: Local Processes and Global Impacts. Springer-Verlag.
Berlin, p.176.
NATURA, 2000. Natura 2000. European Environmental Agency.
http://ec.europa.eu/environment/nature/natura2000/
Newbold, T., Hudson, N.L., Hil, S.L.L., Contu, S., Lysenko, I., Senior, R.A., Börger, L., Bennett, D.J., Choimes, A., Collen, B., Day, J., De Palma, A., Diaz, S., Echeverria-London, S., Edgar, M.J., Feldman, A., Garon, M., Harrison, M.L.K., Alhusseini, T., Ingram, D.J., Itescu, Y., Kattge, J., Kemp, V., Kirkpatrick, L., Kleyer, M., Laginha Pinto, D., Martin, C.D., Meiri, S., Novosolov, M., Pan, Y., Phillips, H.R.P., Purves, D.W., Robinson, A., Simpson, J., Tuck, S.L., Weiher, E., White, H.J., Ewers, R.M., Mace, G.M., Scharlemann, J.P.W., Purvis, A. 2015.
Global effects of land use on local terrestrial biodiversity. Nature 520 (7545), 45–50. DOI:10.1038/nature14324
Temme, A.J.A.M., Verburg, P.H. 2011. Mapping and modelling of changes in agricultural intensity in Europe. Agriculture.
Ecosystems and Environment 140, 46–56. DOI:
10.1016/j.agee.2010.11.010
van der Zanden. E.H. Levers. C.. Verburg. P.H.. Kuemmerle. T. 2016.
Representing composition. spatial structure and management intensity of European agricultural landscapes: A new typology.
Landscape and Urban Planning 150, 36–49. DOI:
10.1016/j.landurbplan.2016.02.005
Verburg, P.H., Tabeau, A., Hatna, E. 2013. Assessing spatial uncertainties of land allocation using a scenario approach and sensitivity analysis: a study for land use in Europe. Journal of Environmental Management 127, 132–144. DOI:
10.1016/j.jenvman.2012.08.038


![adistincttypeofenergyproductionsystem,nowadaysmainlyrenewableenergy.Similartoother energysourcescanbefoundinmanycountries,fromtheUSAtoChinaandacrossEurope[ – ]. energylandscape;Eurasianskylark;landcover;landuse;land-coverheterogeneity; withtheareaoftheinl](data:image/gif;base64,R0lGODlhAQABAIAAAP///wAAACH5BAEAAAAALAAAAAABAAEAAAICRAEAOw==)