Contents lists available atScienceDirect
Land Use Policy
journal homepage:www.elsevier.com/locate/landusepol
Typology and distribution of small farms in Europe: Towards a better picture
N. Guiomar
a,⁎, S. Godinho
a, T. Pinto-Correia
a, M. Almeida
a, F. Bartolini
b, P. Bezák
c, M. Biró
d, H. Bjørkhaug
e, Š . Bojnec
f, G. Brunori
b, M. Corazzin
g, M. Czekaj
h, S. Davidova
i, J. Kania
j, S. Kristensen
k, E. Marraccini
l, Zs. Molnár
d, J. Niedermayr
m, E. O ’ Rourke
n, D. Ortiz-Miranda
o, M. Redman
p, T. Sipiläinen
q, H. Sooväli-Sepping
r, S. Šū mane
s, D. Surová
a, L.A. Sutherland
t, E. Tcherkezova
u, T. Tisenkopfs
s, T. Tsiligiridis
v, M.M. Tudor
w, K. Wagner
m, A. Wästfelt
xaICAAM–Instituto de Ciências Agrárias e Ambientais Mediterrânicas, Universidade de Évora, Ap. 94, 7002-554 Évora, Portugal
bDepartment of Agricultural, Food and Environmental Economics, University of Pisa, Pisa, Italy
cInstitute of Landscape Ecology, Slovak Academy of Sciences, Branch Nitra, Akademická 2, 94901 Nitra, Slovakia
dMTA Centre for Ecological Research, Institute of Ecology and Botany, H-2163 Vácrátót, Alkotmány u. 2–4, Hungary
eCentre for Rural Research, Universitetssenteret Dragvoll, Trondheim, Norway
fFaculty of Management, University of Primorska, Koper, Slovenia
gDepartment of Agricultural, Food, Environmental and Animal Sciences, University of Udine, via Sondrio 2, 33100 Udine, Italy
hInstitute of Economics and Enterprises Management, Department of Management and Marketing, University of Agriculture in Krakow, Mickiewicza Avenue 21, 31-120 Krakow, Poland
iSchool of Economics, Keynes College, University of Kent, Canterbury, Kent, CT2 7NP, UK
jInstitute of Economic and Social Sciences, Department of Social Policy and Agricultural Extension, University of Agriculture in Krakow, Mickiewicza Avenue 21, 31-120 Krakow, Poland
kDepartment of Geosciences and Natural Resource Management, University of Copenhagen, Øster Voldgade 10, DK-1350 Copenhagen K, Denmark
lUP 2012-10-103 INTERACT, UniLaSalle, France
mFederal Institute of Agricultural Economics, Marxergasse 2, 1030 Vienna, Austria
nDepartment of Geography, University College Cork, Cork, Ireland
oGroup of International Economy and Development, Department of Economics and Social Sciences, Universidad Politécnica de Valencia, Valencia, Spain
pHighclere Consulting SRL, Romania
qDepartment of Economics and Management, University of Helsinki, FI-00014, Finland
rTallinn University, School of Humanities (Centre for Landscape and Culture), School of Natural Sciences and Health, Uus-Sadama 5, 10120, Tallinn, Estonia
sBaltic Studies Centre, Kokneses Prospekts 26-2, Riga, LV, 1014, Latvia
tSocial, Economic and Geographical Sciences Group, The James Hutton Institute Craigiebuckler, AB15 8QH, Aberdeen, Scotland, UK
uNational Institute of Geophysics, Geodesy and Geography, Bulgarian Academy of Sciences, Acad. G. Bonchev Str., Bl. 3, Sofia, Bulgaria
vDepartment of Agricultural Economy and Development, School of Food, Biotechnology and Development, Athens University of Agriculture, 75 Iera Odos, 11855, Athens, Greece
wInstitute of Agricultural Economics, Romanian Academy, Calea 13 Septembrie no. 13, 050711, Bucharest, Romania
xDepartment of Human Geography, Stockholm University, 10691, Stockholm, Sweden
A R T I C L E I N F O
Keywords:
Small-scale farming systems Farm size
Spatial distribution Cluster analysis Typologies
A B S T R A C T
The contribution of small farms to local food supply, food security and food sovereignty is widely acknowledged at a global level. In the particular case of Europe, they often are seen as an alternative to large and specialised farms. Assessing the real role of small farms has been limited by a lack of information, as small farms are frequently omitted from agricultural censuses and national statistics. It is also well acknowledged that small farms differ widely, and are distributed according to different spatial patterns across Europe, fulfilling different roles according to the agriculture and territorial characteristics of each region. This paper presents the result of a novel classification of small farms at NUTS-3 level in Europe, according to the relevance of small farms in the agricultural and territorial context of each region, and based on a typology of small farms considering different dimensions of farm size. The maps presented result from an extensive data collection and variables selected according to European wide expert judgement, analysed with advanced cluster procedures. The results provide a
https://doi.org/10.1016/j.landusepol.2018.04.012
Received 18 May 2017; Received in revised form 21 December 2017; Accepted 6 April 2018
⁎Corresponding author.
E-mail address:nunogui@uevora.pt(N. Guiomar).
0264-8377/ © 2018 The Authors. Published by Elsevier Ltd. This is an open access article under the CC BY-NC-ND license (http://creativecommons.org/licenses/BY-NC-ND/4.0/).
T
fine grained picture of the role of small farms at the regional level in Europe today, and are expected to support further data analysis and targeted policy intervention.
1. Introduction
Recent analyses of national agricultural census data from 167 countries and territories indicate that there are globally at least 570 million farms, corresponding family farms to more than 90% of all farms (FAO, 2013;Lowder et al., 2016). In the European Union (EU) small farms are located particularly in peripheral regions, such as the Northern Scandinavia, Scotland and Ireland, South-eastern Europe and in all the Mediterranean countries (Claros, 2014). Small farms are also often related to areas of marginal agricultural productivity, such as mountain ranges (e.g.Pinter and Kirner, 2014;Salvioni et al., 2014). All in all, they correspond to 67% of all farms in the EU (Kania et al., 2014).
Seen from the perspective of the current economic conditions in the agricultural sector, dominated by global markets, farm specialisation, scale increase and disconnection between rural communities and the farm business, small farms might appear inefficient and irrelevant for modern agriculture. However, the importance of small farms for rural sustainability in Europe has been demonstrated in numerous studies (Shucksmith and Rønningen, 2011;Grubbström and Sooväli-Sepping, 2012; McDonagh et al., 2017), including the continued role as food providers for the farm household in many regions (HLPE, 2013;Tudor, 2015). Further, different case studies have shown that small farms are efficient in mobilizing resources beyond those pertaining to farm commercialization through market exchange, such as social capital, local knowledge and cultural heritage (Knickel, 1994;van der Ploeg, 2013; Šūmane et al., 2017). Small farms also support high levels of biodiversity and promote ecological resilience due to their inherent heterogeneity and diversity (Marini et al., 2009; Babai et al., 2015;
Konvicka et al., 2016). Additionally, they are more straightforward to achieve trade-offs in the landscape (Bezák et al., 2007) playing, for example, a key role infire and soil erosion prevention by maintaining meadows and pastures in mountain areas (e.g. Tasser et al., 2003;
Höchtl et al., 2005). Moreover, small farms often develop innovative business models to overcome their intrinsic structural limitations, like informal land cessions (Koutsou et al., 2011), expansion strategies based on the provision of agricultural services (Moragues-Faus, 2014) or multi-family arrangement (Moreno‐Pérez and Lobley, 2015). These innovative models make the ‘real’structure of some holdings larger than what is captured by official statistics.
The continued importance of the small-scale agriculture in the aftermath of economic and financial crisis (e.g. Shucksmith and Rønningen, 2011), and the quest for developing policies to support them in different contexts (Pe’er et al., 2014), have renewed interest in the development of methodologies to assess and mapping small farms in recent years (e.g.Kuemmerle et al., 2009;Samberg et al., 2016;García- Pedrero et al., 2017). At the European level, typologies focused on farming systems (D’Amico et al., 2013;van der Zanden et al., 2016;
Andersen, 2017) or in rural types (van Eupen et al., 2012;Pinto-Correia et al., 2016b) were also applied, but none were developed exclusively on the basis of different measures of the farm size at regional level.
Thus, even if their role is acknowledged, not much is known on the spatial distribution, context specificity, typology, and production ca- pacity of small farms, nor on their integration and role in food systems (Graueb et al., 2016;Lowder et al., 2016). This may be due to lack of detailed data, but also due to the lack of adequate and tailored analy- tical approaches to grasp the diversity of small farms and the factors impacting on their distribution (Samberg et al., 2016). In Europe, this assessment is extremely complex since small farms display a wide range of organizational and structural patterns (Brookfield and Parsons, 2007;
Davidova et al., 2013), not only due to differences in farm size and
contextual diversity, but also due to profound social and political changes that have occurred in the last century (e.g.Jepsen et al., 2015).
1.1. Defining small farms
It should be noted that there is no universally accepted definition of a small farm (or a smallholder) (Davidova and Thomson, 2014). Farm size can be assessed using farm structural size, economic size, herd size, labour force and farms’market participation (e.g. purchased inputs, crop sales) (EC, 2011), although the most common criterion used for this purpose is farmland area. Small farms are usually defined using thresholds on these different farm size indicators (Davidova and Thomson, 2014;Lowder et al., 2016). Considering the structural size, small farms are defined by EUROSTAT and the Food and Agriculture Organization (FAO) as those with an agricultural area measuring less than 5 ha (Davidova et al., 2012), and this threshold has been used in several publications (Davidova, 2014;Galluzzo, 2015;Papadopoulos, 2015). However, the definition of the threshold is strongly influenced by the geographical context of the analysis, since the distribution of farm sizes is very heterogeneous across regions and countries (e.g.
Hazell et al., 2010;Lowder et al., 2016).
Definitions including only the criterion of farm size have universal appeal as they are relatively easy to apply and allow simple compar- isons across countries and world regions. However, they don’t capture all the complexities of farm systems. Ideally, where data is available, additional criteria might be used, such as the number of people working part- or full-time on the farm; the number of commodities produced and degree of specialization; and farm income or sales. Nevertheless, some of the indicators are related with specific types of farming, and are of limited use for a general assessment of the spatial distribution of small farms (e.g.EFSA et al., 2015used a threshold of 75 cows and a family workforce of at least 80% to classify the small-scale dairy farms).
The use of only one group of indicators will always constrain the overall applicability and relevance of classification systems intended for a general assessment of small-scale farming systems. For example, Davidova et al. (2012)report the existence of high-specialized small farms representing significant business operations. Obviously, the op- posite can also be observed, i.e., farms with large area but with small economic size. These latter farm types will probably be more common due to the large extent of less-intensive farming systems (e.g.Neumann et al., 2009; Temme and Verburg, 2011; Estel et al., 2016) and of biophysically constrained areas across Europe (e.g.Tóth et al., 2013;
Borrelli et al., 2014;Aksoy et al., 2016;Hijbeek et al., 2017). Thus, intensity of capital and labour can compensate and sometimes even overcome the constraints related to land area. Vice-versa, abundance of land can make the use of labour and capital intensive strategies less necessary. Information about the two criteria, labour and capital, is thus required to define farm size. In this way the additional analysis of the distribution of these two criteria leads to afine grained typology of regions. Thus, the choice of variables and their thresholds allowing the quantification of small farms in their different dimensions are critical.
Focusing on labour force,Petit et al. (2006) classified the small- scale farming systems as those employing less than 1.5 annual agri- cultural annual work units (AWU). However, only a few countries provide this data at a regional scale. Regarding the economic size, which is widely used for statistical and policy purposes within the European Union (EU) farms with less than 8 Economic Size Units (ESU) of Standard Gross Margin (SGM) are considered as small farms (EC, 2011). This threshold was used byAngelova and Bojnec (2012)to se- parate very small and small farms from high-income farms. Since 2010,
the economic size of farms is measured as the total Standard Output (SO) expressed in euro. Definitions involving use of additional criteria to farm size are more comprehensive, particularly those including in- dicators of the farm economic output, but data availability is often a limitation (Ruane, 2016).
1.2. Aims and scope
A territorial approach to food and nutrition security is currently high on the policy agenda (OECD, FAO and UNDCDF, 2016), bringing with it an emphasis on new approaches that shift from sectoral and top- down strategies to multi-sectoral, bottom-up and context specific tai- lored made solutions to local and regional development challenges.
This approach enhances the tone for more advanced analytical tools than what we had so far, to determine not only the spatial distribution of small farms and farming systems, but also their relative importance in relation to the specific context they are part of (Baumgartner et al., 2015;Lowder et al., 2016;OECD, FAO and UNDCDF, 2016).
There is thus a need for understanding the relative importance of small farms in each particular context (Ruane, 2016), both for further analytical purposes and to support the design of European and national policies. This is crucial for many regions in Europe, and in particular for the Mediterranean countries, where changes in the farm sector occur at an exceptionally strong pace (Hill et al., 2008;Estel et al., 2015).
The purpose of this paper is to develop a map of Europe showing regions where small farms have different degrees of importance, in relation to the regional context of agriculture and the territorial char- acteristics. This map is a synthesis of a complex and multistep analysis, with results contributing to a novel understanding of the role of small farms in Europe, with the relevant regional differentiation. Maps of the distribution of small farms in Europe have been produced before (e.g.
Kempen et al., 2011;Andersen, 2017) but not considering the particular context of each region –and this is where this analysis builds upon these previous efforts.
The classification of the NUTS-31regions in Europe results from an extensive collection of data available across Europe and an informed exploration of the possible analytical steps to exploit these data. A cluster analysis has been performed at NUTS-3 level using the available statistical data on farm size. The distribution of the number of farms and the utilized agricultural area by farm size classes is analysed and discussed, as also a map with the distribution of the clusters re- presenting different patterns of the distribution of small farms throughout Europe. Further, the main differences between the clusters are also discussed and some perspectives for policy formulation are offered as a conclusion.
2. Material and methods 2.1. Data sources and indicators
Data at NUTS-3 level for all European countries except for Germany (NUTS-2 level due to data availability) (Fig. 1) on the Utilized Agri- cultural Area2 (UAA) and on the Number of Holdings3 (hereafter Number of Farms, NF) distributed by structural and by economic size classes were extracted from EUROSTAT (Structure of agricultural
holdings by NUTS-3 regions – http://ec.europa.eu/eurostat/en/web/
products-datasets/-/EF_R_NUTS) and from official national databases on agricultural statistics. The NUTS-3 level was selected as it is the most detailed administrative level to which data can be found for all Eur- opean countries. Data comes from the latest agricultural censuses and farm structure surveys (2007-2010), although there are two exceptions for which the data are less up-to-date (Croatia and Austria). Despite changes evidenced in the last decades in the number of farms (e.g.
Bojnec and Latruffe, 2013), showing a faster decrease in the EU New Member States4than in the EU Old Member States, differences in the farm structure between countries maintained (Alexandri et al., 2015).
Because the regional differences caused by the structural change are small during a short time period we do not expect slight differences in comparison periods to affect the outcome of our research.
These data were used to calculate a set of indicators (Table 1), such as the percentage of farms and of utilized agricultural area below the above-mentioned size thresholds (5 ha of utilized agricultural area for the structural size and 8 ESU of SGM for the economic size), farm density based on the ratio of the total number of farms by total land area in agriculture (the higher the density of farms, the higher the prevalence of small farms), and the mean size of total farms and of small farms. In our study we used farm’s SGM instead of economic output, due to data availability at NUTS-3 level. Data on family labour force was also collected as a proxy for the importance of small farms in a region. Previous studies have shown that farms in mountain areas tend to be small (e.g.Pinter and Kirner, 2014;Salvioni et al., 2014) and, therefore, number of farms and land area in agriculture in mountain ranges were also collected.
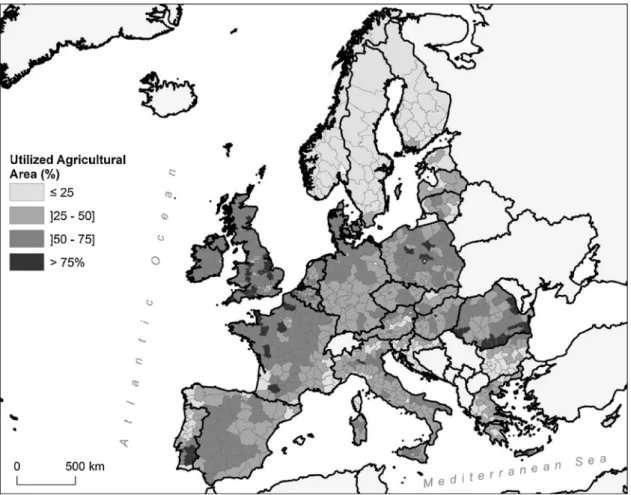
Nevertheless, decoupling the analysis from the total land area used for farming of each region can lead to misleading interpretations. Since we are aiming to identify different regional types of small farms and to assess their distribution, we needed to take the regional agricultural system into account. For this purpose, we also included the percentage of utilized agricultural area (pUAA) in each region in our analysis.Fig. 1 illustrates the spatial distribution of thepUAA in the EU-28 member states and Norway at NUTS-3 level (except for Germany at NUTS-2 level). The map shows that UAA covers less than 25% of the Nordic countries (Sweden, Norway and Finland) while UAA is more hetero- geneously distributed within the remaining EU countries.
2.2. Data analysis
The analysis of the data was divided into two fundamental steps: a) analysis of the distribution of utilized agricultural area (UAA) and number of farms (NF) by farm size classes, and b) cluster analysis using the data listed inTable 1to assess the distribution of small farms in Europe at the NUTS-3 scale. All the analysis was conducted in R version 3.1.3 (R Development Core Team, 2015) and ArcGIS 10 (ESRI, 2011).
The distribution of the UAA and the NF by structural and by eco- nomic farm size was analysed through notched box plots (McGill et al., 1978), where the box shows the interquartile range, the whiskers the non-outlier range, and the notch displays the 95% confidence interval surrounding the median.
The non-parametric Wilcoxon rank sum test was applied to compare the distribution of the number of small farms and the area covered by these farms, defined by the thresholds considered in our study (5 ha of utilized agricultural area for the structural size and 8 ESU for the eco- nomic size). The normalized difference between the utilized agri- cultural area in farms with less than 8 ESU and in farms measuring less than 5 ha of UAA was also computed, to identify regions with larger farms and with low economic size (positive values) and regions with small farms representing substantial business operations (negative
1The NUTS classification (Nomenclature of Territorial Units for Statistics) is a hier- archical system subdividing the territory of the European Union into regions at three levels (NUTS 1, 2 and 3). NUTS-3 level correspond to the smaller territorial units for specific socio-economic diagnoses.
2The Utilized Agricultural Area (UAA) comprise the total area covered by arable land (irrigated or non-irrigated), permanent pastures, meadows, permanent crops (olive groves, vineyards and orchards) and kitchen gardens.
3According toRegulation 2008, (EC) No 1166/2008of the European Parliament and of the Council on farm structure surveys and the survey on agricultural production methods, a holding can be defined as“a single unit, both technically and economically, which has a single management, and which undertakes agricultural activities”.
4Bulgaria, Czech Republic, Estonia, Hungary, Latvia, Lithuania, Poland, Romania, Slovakia, Slovenia.
Fig. 1.Percentage of the utilized agricultural area (pUAA) in EU-28 and Norway at NUTS-3 level (except for Germany, at NUTS-2 level) (Source: EUROSTAT; national statistics).
Table 1
List of the variables used to analyse the distribution of small farms in Europe at NUTS-3 level and descriptive statistics.
Variable Abbrev. Units Mean Median IQR CV
Utilized agricultural area UAA ha 191720.39 128065.00 46505.0-276246.5 1.03
Percentage of utilized agricultural area pUAA % 42.55 43.43 28.07-57.84 0.48
Total number of farms tNF – 15,537.12 7267.00 2700.00-16830.00 1.61
UAA in small farms (< 5 ha of UAA) UAAstructural ha 16444.09 5019.50 1335.00-17165.89 1.86
UAA in small farms (< 8 ESUa)) UAAeconomic ha 44073.92 20700.00 7305.00-45335.00 1.43
Percentage of UAA covered by UAAstructural pUAAstructural % 12.13 3.43 1.15-17.14 1.37
Percentage of UAA covered by UAAeconomic pUAAeconomic % 25.77 19.67 7.41-39.45 0.85
Percentage of the region covered by UAAstructural prUAAstructural % 4.30 1.47 0.52-5.33 1.50
Percentage of the region covered by UAAeconomic prUAAeconomic % 9.75 6.57 2.50-13.61 1.00
Number of small farms (< 5 ha of UAA) NSFstructural – 11,189.73 2595.00 630.00-11476.00 2.10
Number of small farms (< 8 ESUa)) NSFeconomic – 13,817.37 4020.00 1165.00-14545.00 1.85
Percentage of small farms (< 5 ha of UAA) pSFstructural % 49.50 46.15 22.55-75.93 0.58
Percentage of small farms (< 8 ESUa)) pSFeconomic % 63.17 68.89 40.48-86.56 0.43
Farm density FD n/ha 0.12 0.05 0.03-0.15 1.46
Small farm density SFD n/ha 0.09 0.02 0.01-0.11 1.83
Mean size of farms MSF ha 29.97 20.41 6.71-39.80 1.24
Mean size of small farms (< 5 ha of UAA) MSSF ha 1.92 1.95 1.32-2.47 0.40
Total labour force tLF AWUb) 12,714.41 7655.00 2490.00-15380.00 1.27
Total family labour forcec) tFLF AWUb) 10,207.01 4830.00 1750.00-11715.00 1.46
Proportion of the family labour force pFLF % 72.53 80.26 62.33-90.17 0.33
Number of farms in mountain areas NFmountain – 2766.32 0.00 0.00-2820.00 2.40
Land use in agriculture in mountain areas LUAmountain ha 29403.18 0.00 0.00-32280.00 2.17
IQR: interquartile range; CV: coefficient of variation.
a ESU: European size unit, which is a standard gross margin of 1200€that is used to express the economic size of an agricultural holding.
b AWU: Annual Work Units, corresponding to the work performed by one person occupied on a full-time basis.
c Family labour force of the agricultural holding refers to persons who carry out farm work on the holding and are classified either as a holder or the members of the sole holder’s family (spouse, relatives and brothers and sisters of the holder or his/her spouse).
values), resulting not only from farm specialization, but also from the integration, into the small-farm production structure, of multiple uses (for example, crops and animal husbandry). We used the formula:
= −
ND UAA +UAA
UAA UAA
UAA economic structural
economic structural
where NDUAAis the normalized difference between utilized agricultural area in small farms in terms of economic size (< 8 ESU; UAAeconomic) and utilized agricultural area in small farms in terms of structural size (< 5 ha of UAA; UAAstructural).
Before conducting cluster analysis, we reduced the number of variables through the identification of highly correlated pairs (r > |0.7|;Tabachnick and Fidell, 2007). We also have used the coef- ficient of variation (Table 1) as an indicator of variability and plotted the spatial distribution of the remaining variables to assess their suit- ability for the subsequent analysis. We selectedfive variables after the above mentioned procedure: the percentage of utilized agricultural area (pUAA); percentage of utilized agricultural area covered by small farms in terms of structural size (< 5 ha of UAA;pUAAstructural); percentage of the region covered by small farms in terms of economic size (< 8 ESU;
prUAAeconomic); percentage of small farms in terms of economic size (< 8 ESU;pSFeconomic); and mean size of small farms (< 5 ha of UAA;
MSSF). pUAA allows for measuring the importance of agriculture in regional land use.pUAAstructuralexpresses the importance of small farms in each region, whileprUAAeconomicdescribes to what extent regional land use is associated with economically fragile/small holdings.
pSFeconomicproxy the economic characteristics of small farms and MSSF illustrates the structural characteristics of small farms.
We did not consider the family labour force given its very low variability (CV =∼0.33) and its homogeneous spatial distribution, which shows that the large majority of farms across the European re- gions is characterized by family farms (see Section A1 and Fig. A1 in the Supplementary Material). Thus, this indicator may be misleading, since many larger farms also fall in the category of family farms (see alsovan Vliet et al. (2015), who pointed out that farm size is not directly related to farm ownership). The land use in agriculture and the number of farms in mountain areas were also omitted from the cluster analysis, since we found different types of relations between farm size classes in hilly and mountainous areas given the presence of livestock oriented farms (e.g.Marini et al., 2011; Bojnec and Latruffe, 2013;Battaglini et al., 2014;Niedermayr et al., 2015), being unsuitable to be used as proxy variable of the prevalence of small farms at regional level (see Section A1 and Fig. A2 in the Supplementary Material).
TheclValidpackage for R (Brock et al., 2008) was used to select the clustering algorithm from five clustering methods: divisive analysis (DIANA), partition around the medoids (PAM), clustering large appli- cations (CLARA), self-organizing tree algorithm (SOTA) and model- based clustering (MODEL). Dunn index (Dunn, 1974), silhouette width (Rousseeuw, 1987) and connectivity (Handl and Knowles, 2005) were used to assess the compactness, connectedness, and separation of the cluster partitions (Brock et al., 2008). The comparison between the performances of the clustering algorithms are presented inFig. 2a-c.
Considering that the connectivity should be minimized (Fig. 2a), and both the Dunn index (Fig. 2b) and the silhouette width (Fig. 2c) should be maximized, the results have showed that partition around the me- doids (PAM) was the best solution for our data. After the selection of the
Fig. 2.Results from the comparison between thefive clustering algorithms using connectivity (a), Dunn index (b), and silhouette (c) to select the best clustering method, and the gap statistic (d) to select the optimal number of clusters. The partition around the medoids (PAM) was chosen as the best method to analyse our data.
clustering method, cluster analysis was implemented using thecluster package for R (Maechler et al., 2017), and the number of clusters was determined through the Gap Statistic (Tibshirani et al., 2001) which were obtained using 100 Monte Carlo samples. Euclidean distance was used as the dissimilarity measure. Gap statistics suggested examining our data based on an 8-cluster solution (Fig. 2d).
Maximum and average dissimilarities, diameter, separation and average silhouette were retained to assess the performance of the cluster partition, and Kruskall-Wallis and Median tests were performed to evaluate intergroup differences.
3. Results
3.1. Distribution of the utilized agricultural Area and the number of farms by farm size classes
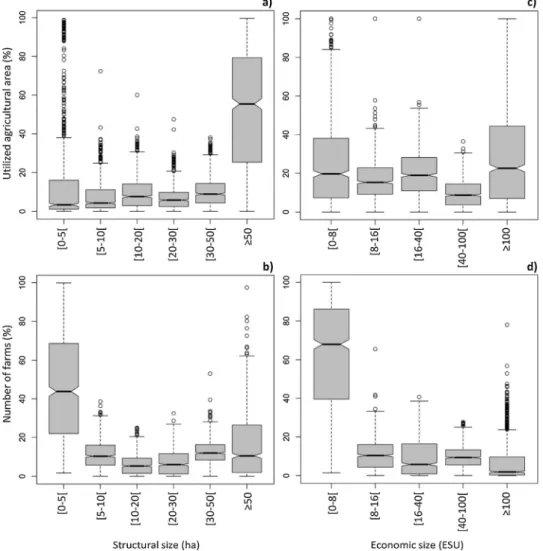
The distribution of the utilized agricultural area (UAA) and the number of farms (NF) by structural size classes (Fig. 3a and b respec- tively) shows that a large number of small farms occupy a small pro- portion of the land use in agriculture in each region, and a smaller number of large farms covering a higher percentage of the agricultural area. When we distribute the same indicators by economic size classes, the same behavior can be observed for the NF (Fig. 3d), but the dis- tribution of the UAA is much more balanced (Fig. 3c). Still, the inter- quartile range and non-outlier range of this distribution allows fore- seeing that some regions may eventually present bi-modal distributions with higher percentages of small and very large farms, and a lower
proportion of the middle-sized classes.
Moreover, both the distribution of the number of small farms and of the area covered by them are statistically different considering different measures of farm size (Wilcoxon rank sum tests: number of small farms –W= 304,460,p< 0.001; percentage of area covered by small farms– W= 224,690,p< 0.001).
We observe several differences across Europe when small farms are assessed by structural or economic size.Fig. 4shows the normalized difference between the utilized agricultural area in small farms defined by economic size (< 8 ESU) and in small farms in terms of structural size (< 5 ha of UAA), and it is possible to equate some explanations for these differences. Values close to zero indicate strong relation between the two farm size dimensions. Positive values represent regions with larger farms (in area) with small economic size while negative values may represent high intensity and profitable small-scale farms (large farms in economic size, but small farms in terms of the area used for farming). Examples of the latter ones that emerge from our analysis are the Champagne region in France, Trento in Italy, the Dalmatian wine region in Croatia representing added-value wine productions, the Va- lencia region in Spain where citrus plantations play a major role in agricultural economy and large parts of the Netherlands.
3.2. Characterization of the clusters
The cluster sizes and a set of indicators showing the overall per- formance of the cluster analysis can be observed inTable 2(the cluster plot is presented in Fig. A2 in the Supplementary Material).Table 3
Fig. 3.Distribution of the Utilized Agricultural Area (UAA) and the number of holdings by structural and by economic size classes.
presents the results of the Kruskal-Wallis and Median tests showing that the performances of the variables in the different groups were sig- nificantly different from each other (p< 0.001).
The distribution of the variables throughout the clusters (Fig. 5) highlights three larger groups (means and standard deviations for each cluster are also provided in the Supplementary Material –Table A1).
The first group, composed by clusters 1, 2 and 3, comprise pre- dominantly agricultural regions with a percentage of utilized agri- cultural area (pUAA) higher than 50%. The clusters within the second group (clusters 4 and 5) show a balance betweenpUAA and other land uses (pUAA between 40 and 50%), while the third group includes the clusters with less than 25% of land area in agriculture (clusters 6, 7 and 8), where are represented large forested and/or urban areas.
Clusters 1, 2 and 3 include predominantly agricultural regions with average values of pUAA higher than 50% (54.86%, 59.26% and 66.94%, respectively) (Fig. 5a). Romania and the southern and south-
Fig. 4.Normalized difference between the utilized agricultural area (UAA) in small farms with less than 8 ESU and in small farms measuring less than 5 ha of UAA.
Values close to zero indicate strong relation between the two farm size dimensions, whereas positive values represent regions with larger farms (defined by structural size) with small economic size and negative values may represent high intensity and profit small-scale farms (large farms in economic size, but small farms considering their structural size). (Source: based on data from EUROSTAT and official national databases on agricultural statistics).
Table 2
Cluster sizes and indicators of performance of the cluster analysis, including maximum and average dissimilarity, diameter, separation and average silhouette.
Cluster number Cluster size (number of regions) Maximum dissimilarity Average dissimilarity Diameter Separation Average silhouette
Cluster 1 70 53.063 20.215 88.475 3.985 0.316
Cluster 2 167 32.292 13.808 55.633 3.054 0.444
Cluster 3 113 36.040 14.477 58.831 2.104 0.331
Cluster 4 128 37.312 15.984 54.757 2.753 0.236
Cluster 5 141 25.545 13.582 44.566 2.104 0.310
Cluster 6 75 56.802 18.309 73.382 4.791 0.299
Cluster 7 148 34.484 17.354 55.344 1.885 0.191
Cluster 8 74 42.602 16.830 66.358 1.885 0.349
Table 3
Results from Kruskal-Wallis and Median tests.
Kruskal-Wallis test Median test
H p Chi-sq. p
pUAA 717.891 < 0.001 549.352 < 0.001
pUAAstructural 613.758 < 0.001 424.304 < 0.001
prUAAeconomic 554.721 < 0.001 364.541 < 0.001
pSFeconomic 784.043 < 0.001 692.460 < 0.001
MSSF 186.053 < 0.001 186.053 < 0.001
pUAA: percentage of utilized agricultural area;pUAAstructural: percentage of UAA covered by small farms in terms of structural size (< 5 ha of UAA);
prUAAeconomic: percentage of the region covered by small farms in terms of economic size (< 8 ESU);pSFeconomic: percentage of small farms in terms of economic size (< 8 ESU); MSSF: mean size of small farms (< 5 ha UAA).
eastern Poland (Cluster 1 inFig. 6) are highlighted in our results as agricultural regions with extremely many small low-income farms (about 96.19% of the total farm units have less than 8 ESU of SGM).
These regions also show the highest values of the percentage of utilized agricultural area covered by small farms measuring less than 5 ha of land used for agriculture (pUAAstructural) and of the region covered by small farms in terms of economic size (prUAAeconomic) (42.39 and 33.35%, respectively;Fig. 5a). The mean size of small farms in terms of their structural size (MSSF) is the second smallest among the clusters (1.69 ha inFig. 5b).
Clusters 1 and 2 are in opposite positions. The regions included in Cluster 2 are representative of large-scale farming systems, presenting the lowest values of pUAAstructural (1.43%) andpSFeconomic(24.50%), and the second lowest value ofprUAAeconomic(2.54%) (Fig. 5a). This cluster includes most of the French and Belgian regions, and northern Germany, southern and eastern Ireland, south-western and eastern Scotland, The Netherlands and Denmark (Fig. 6). These regions are characterized by a very low proportion of small-scale farms and by a high share of relatively large and high-income farms.
Cluster 3 includes small farms of north-central Poland, south-wes- tern Iberian Peninsula, central and southern United Kingdom, north and northwestern Ireland and Scottish uplands (Fig. 6) which are mainly defined by their economic size. Only∼3.50% of the total land used in agriculture is found on farms with utilized agricultural area smaller than 5 ha, while∼66.36% of the total farm units have less than 8 ESU of SGM and cover∼12.83% of the total area in these regions (Fig. 5a).
The regions included in Cluster 4 have average values of the
percentage of utilized agricultural area (pUAA) less than 50% (46.92%).
However, the average values of pUAAstructural, prUAAeconomic and pSFeconomicare higher than in Cluster 3 (10.41%, 13.85% and 87.67%, respectively), showing a higher importance of low income farms (Fig. 5a). The small size of agricultural holdings is in this case de- termined by the economic size. These farms are common in Hungary, southern Slovakia, northern and eastern Poland and in southeastern Austrian regions with structural deficits and in southern and western mountainous Austrian regions (Fig. 6).
Regions found in Cluster 5 are characterized by an averagepUAA of 41.14%, also showing lower values of agricultural area covered by small farms in terms of structural size (pUAAstructural; 3.31%) and of the region covered by small farms considering their economic size (prUAAeconomic; 6.36%) (Fig. 5a). The mean size of small farms mea- suring less than 5 ha of land used for farming (MSSF) is the third highest among the clusters (2.27 ha) (Fig. 5b). In addition, more than half of the total farms have less than 8 ESU (pSFeconomic; 52.54%) (Fig. 5a). Re- gions included in Cluster 5 can be found in northern Spain, in southern and eastern France (French Alps and Vosges area), in some regions of northern Italy (Alps and Apennines), in advantaged Austrian arable and grassland regions, in western Czech Republic and also in the central part and southern Germany.
The lowest average value of MSSF are found in regions included in Cluster 6 (Fig. 5b). The regions included in Cluster 6 are located in Croatia, central and northern Portugal, southern Bulgaria, and the west coasts of Greece and Italy (Fig. 6). Despite the smaller agricultural area (average values ofpUAA of 16.51%;Fig. 5a), these regions show the smallest farms in terms of their structural dimension (∼1.29 ha;
Fig. 5b). About 45.81% of the total UAA is found on farms measuring less than 5 ha of UAA (pUAAstructural) and a large percentage of the holdings have less than 8 ESU of SGM (the average value ofpSFeconomic
is 87.90%;Fig. 5a).
Cluster 7 is distinguished from Cluster 6 because it has a higher average value ofpUAA (23.79%) and a lower average ofpUAAstructural
(14.28%), but the average percentage of small farms in terms of eco- nomic size is very high (∼80.90%) and the mean size of the farms with less than 5 ha of utilized agricultural area (MSSF) is below 2 ha. The regions belonging to this cluster are scattered throughout Europe, most notably in Croatia, Greece, Sweden, Slovenia, Estonia, Latvia, western Lithuania, central Bulgaria, northern Slovakia, central-southern mountainous Austria and north-western Spain (Fig. 6).
The regions included in Cluster 8 have the lowest average values of agricultural area (pUAA; 14.94%) andprUAAeconomic(1.27%), and the second lowest values ofpUAAstructural(2.23%) andpSFeconomic(31.68%) (Fig. 5a), indicating that these are regions where agriculture is less representative and land use is dominated by forest or other semi-natural vegetation (e.g. Norway and Finland;Fig. 6).
4. Discussion
4.1. Variability in the farm structures
Globally, most of farms are small, but larger farms comprise more of the total land area in agriculture (Lowder et al., 2016). This was also pointed out byDavidova et al. (2012), who found that farms smaller than 8 ESU represented∼80% of all agricultural holdings in Europe, but only covered 25% of the total agricultural area. This skewed dis- tribution was also observed in other studies performed at national and regional scales (e.g.Eurostat, 2013;Tudor, 2014;Unay-Gailhard and Bojnec, 2015). Nevertheless, there are differences between countries.
According with Blacksell (2010), in Bulgaria, Czech Republic and Hungary∼10% of the largest farms occupy∼80% of the agricultural land, whereas in Slovenia, Poland, Romania and Estonia,∼10% of the largest farms cover just∼40% of the agricultural area.
Moreover, when we distribute farm area by economic size this bi- polarity is not so evident.Davidova et al. (2012)andTocco et al. (2013) Fig. 5.Mean plots (with the standard error) showing the distribution of the
variables in the clusters.
highlighted the high prevalence of small farms in terms of agricultural area in some regions but with high economic values. This pattern can be observed in the Netherlands, in southern Croatia, and some scattered regions across Europe (Fig. 4). However, the opposite is more common, i.e., large farms in terms of area but with low incomes and thus, small in economic size. Furthermore, the distribution of the number of farms is more sensitive to differences in the thresholds for data collection be- tween countries than farm area. Thus, to accurately assess the dis- tribution of European small farms we need not only to consider more than one dimension of farm size, but also to include both farm area and number of farms in the analysis, since their distributions show different patterns. Through the integration of the percentage of agricultural area in each region, the analysis undertaken has also made it possible to differentiate predominantly agricultural regions from other regions where agricultural use has the same relative importance as other uses, and also from those dominated by forest or urban land uses.
The following discussion will present the characteristics of these three main types of regions more in depth including the historical drivers leading to the current situation.
4.2. Predominantly agricultural regions
Large part of Romania and the southern and south-eastern regions of Poland (included in Cluster 1) are highlighted in our results as pre- dominantly agricultural regions containing“hotspots”of small farms (Fig. 6). About one third of all agricultural holdings in our study area are located in Romania (Eurostat, 2013), including 43% of the Eur- opean small farms measuring less than 5 ha (Alexandri et al., 2015), whereas Poland shows higher variability in the farm structure (Szumelda, 2013). The dominance of small farms has long character- ized the Romanian agrarian farm structure, even in the pre-communist
era (Rusu and Tudor, 2015;Tudor, 2015). After the communism col- lapse, the land restitution to former landowners was initially limited to 10 ha (Tomczak, 1991; Swinnen, 1999), explaining the highest land fragmentation among the European countries. In Poland the failure of collectivization process may enlighten the prevalence of the small-size farm structure in some regions (Kaliński, 1988) whereas its persistence may be explained by high off-farm unemployment (Szumelda, 2013).
Although increasing trend of the farm size in the last decades were noted in both countries (Bordanc, 1996;Dannenberg and Kuemmerle, 2010;Alexandri et al., 2015), and the recent emergence of land grab- bing and land concentration (Franco and Borras, 2013;van der Ploeg et al., 2015;Petrescu-Mag et al., 2017), the general pattern of varia- bility in the farm structures at European scale still prevails. This is particularly evident in Poland, where one can observe consistency with Kostrowicki's (1970) typologies, not only regarding the spatial dis- tribution of small farms in southern and eastern Poland as also reported by Szumelda (2013), but with the general pattern of the agrarian structure.
In contrast, the predominantly agricultural regions included in Cluster 2 are representatives of large-scale farming systems. This cluster includes regions of countries with a long tradition for land consolida- tion, such as for example Denmark and France (Jacoby, 1959). Land consolidation can be described, in general terms, as a planned read- justment of land ownership to improve the agrarian structure in ex- cessively fragmented farmland and, consequently, to increase land use effectiveness and to ensure rural development (Jacoby, 1959;Crecente et al., 2002;Sklenicka, 2006;Pašakarnis and Maliene, 2010). In Den- mark, a sequence of land reforms in the early 20th century led to the creation of 28,000 smallholder farmsteads, measuring 2–5 ha, thus larger than many small farms currently found in several other European countries (Kristensen et al., 2009). Land consolidation in France Fig. 6.Spatial distribution of the 8 clusters by the EU-28 and Norway at NUTS-3 level (except in Germany, at NUTS-2 level).
(“remembrement”) started in 1918 (Gatty, 1956), being more effec- tively implemented since the 1940s (Baudry and Burel, 1984), whereas in Germany (“Flurbereinigung”) and in the Netherlands (“ruilverka- veling”) it was from the 1950s that the process of land consolidation occurred quickly, after a period of application, maturation and eva- luation of thefirst laws regarding the reduction of land fragmentation (King and Burton, 1983;van den Noort, 1987;van Huylenbroeck et al., 1996). Regions of Southern Ireland and southern Scotland are also in- cluded in this cluster. In Ireland, most of these areas are characterized byMatin et al. (2016)as having a low likelihood of occurrence of High Nature Value farmland, representing high-intensity farming systems. In addition to land consolidation, the agricultural sector reforms after the Second World War in France, led to a regional specialization of farming systems on the basis of their economic efficiency, which also led to a strong decrease of small farms in both grassland and arable crops areas (Boinon, 2011).
The main difference between the Clusters 2 and 3 is related to the economic size of the holdings. Cluster 3 includes a high percentage of farm holdings with the economic size less than 8 ESU (both in number and area). This cluster includes regions characterized by large-scale and low-intensity Mediterranean agroforestry systems in Iberian Peninsula and silvo-pastoral systems in Italian islands (Eichhorn et al., 2006;
Godinho et al., 2016;den Herder et al., 2017). The recent development has, however, indicated land use intensification in these regions, both due to the increasing of highly intensive olive production and of live- stock grazing (e.g. Godinho et al., 2016). In the Alentejo region of southern Portugal, small farms measuring less than 5 ha, are spatially clustered nearby the urban areas and are, therefore, highly attractive for newcomers (Pinto-Correia et al., 2016a). Sheep farming systems of the northwestern Ireland and croft regions of the Scottish uplands are also included in this cluster (Fernandes and Guiomar, 2006;Shucksmith and Rønningen, 2011). English and Welsh regions, where farms are small in economic size, are also showing difficulties to engage in stra- tegies of farm diversification to increase farm income (McNally, 2001).
4.3. Regions with a balanced distribution between agriculture and other land uses
Regarding the regions with a balanced distribution between the agricultural land use and other land uses, the main difference between Clusters 4 and 5 is the higher percentage of small farms in Cluster 4.
However, the large-size farm structures prevail in these regions (e.g.
van Dijk and Kopeva, 2006;Andersen, 2017;Janovska et al., 2017).
According tovan Dijk and Kopeva (2006)the regions of the Central and Eastern European countries included in Cluster 4 show favorable farm structures, without problems of land fragmentation. In Czechoslovakia, Hungary, Bulgaria and in the Soviet Union, including the Baltic states, the Soviet model of collective agriculture was more strictly followed (Bartoš, 1987;Lerman et al., 2004a;Kohlheb and Krausmann, 2009). As a result, most small farms disappeared due to the nationalization and collectivization of the economy and, therefore, the large-scale and corporate farm structures with an intensified agriculture became dominant. The high variability in cluster distribution among the Central and Eastern European countries, and even within some countries (e.g.
Poland), may be due to differences not only in agricultural collectivi- zation process when establishing large production units through the consolidation of individual land holdings into collective farms (Swinnen et al., 1997;Lerman et al., 2004a,2004b), but also in con- sequence of the land reforms conducted after the collapse of the so- cialist regime in 1989 (Swinnen, 1999; Lerman et al., 2004b;
Hartvigsen, 2014). Despite reports about the failure of collectivization in Poland, the western regions (formerly part of Germany until 1945) are included in this cluster, and the variability in the spatial distribution of the farm types reported byKostrowicki (1970)andBański (2011) suggests that different processes have occurred in different parts of the country in the 20th century. Thus, apart from collectivization and land
restitution, other dynamics may help to explain the higher prevalence of large farms in the regions included in this cluster. These processes also affected the agrarian structure indirectly by triggering changes in land use (Hostert et al., 2011). In Slovakia, the change from a central planned regime to a market economy in the 1990′s was accompanied by farmland abandonment, and the traditional agricultural landscapes were reduced to less than 1% of the country (Špulerová et al., 2011;
Lieskovský et al., 2015). Similar processes of farmland abandonment were observed in Hungary (Biró et al., 2013;Csatári and Farkas 2008), and in Latvia and Lithuania (Prishchepov et al., 2012). In the Hun- garian lowlands, the population living on small farms decreased by
∼80% from World War II to 1990 (Duró, 2004inPándi et al., 2014).
According to Lieskovský et al. (2015) the implementation of the Common Agricultural Policy (CAP) has favored the farming in large- scalefields, and was not suitable for the small Slovak farmers. An op- posite trend to increasing farm size in most European regions was re- ported byJanovska et al. (2017)in the Czech Republic, where an in- crease in the number of holdings and a decrease in farm size was observed. After the Velvet Revolution in 1989, the small-farms began re-emerging with the privatization process (Kušková, 2013), but large- scale farms still predominate today (Janovska et al., 2017).
In Italy, Clusters 4 and 5 differentiate the central and southern from the northern Apennines. Regarding the regions included in Cluster 5, it is interesting to observe that they are closely related to mountain ranges (e.g. Alps, Pyrenees, eastern Iberian Central System, southern Cantabrian mountain range, Catalan coastal range, Northern Apennines in Italy, eastern and western Massif Central in France, Central German Uplands). Large parts of these regions were classified by Andersen (2017)as medium to large-scale mixed or cattle farming systems. While Marini et al. (2011)reported the decline of traditional small farms in Alps, which have been replaced by large and specialized dairy farming systems,Battaglini et al. (2014)showed the reduction of 26.6% in the area covered by meadows and pastures between 1990 and 2010 be- cause of that changes. Similar dynamics are highlighted byMármol and Vaccaro (2015)including farmland abandonment in the Catalan Pyr- enees. These dynamics may explain the reduced area covered by small farms in these regions, both considering the structural and economic dimensions.
4.4. Regions with low proportion of agricultural area
Finally, the clusters with less than 25% of the land surface used for farming (Clusters 6, 7 and 8) includes regions with a high proportion of forest area and natural (or semi-natural) vegetation communities, but also highly urbanized regions. Despite the limited agricultural area, the regions included in clusters 6 and 7 encompass the majority of the smallest farms in terms of physical dimension. The explanation for this small size of the farms may lie in the failure of the land consolidation programmes in regions with biophysical constraints limiting agri- cultural land use. In Slovenia, and in some other parts of the former Yugoslavia, collectivization was not introduced and most of the small- scale farm structure remained (Bojnec and Swinnen et al., 1997;Bakucs et al., 2013), explaining why farm size in Slovenia is still among the smallest in Europe (Bojnec and Ferto, 2013). In Portugal, land con- solidation programmes in the North (Moreira, 1989; Monke et al., 1992) and the proposals of the industrialists in the 1950′s, for splitting the large farms in the South (Baptista, 1994), were also ineffective due to several factors, maintaining the dichotomy between the North and the South in mainland Portugal that our results also shows.Salvioni et al. (2014) reported the importance of these small farms in three Mediterranean countries (Greece, Italy and Portugal), highlighting that these types of farms are related with mountain areas (e.g. northern Portugal; also in Austria as pointed out byPinter and Kirner (2014)) and with peri-urban areas where off-farm employment supports farm household pluriactivity (e.g. west coast of Italy). Most of the regions included in these two clusters coincide with areas where forest area
grew in the last century (Spiecker, 1999).Conti and Fagarazzi (2004) estimated that the forest area increased 30% and 16% in western and southern Europe respectively, in the second half of the 20th century.
Forest transitions in Portugal, northern Spain and Austria (Gingrich et al., 2007;Marey-Pérez and Rodríguez-Vicente, 2009;Oliveira et al., 2017) and afforestation of agricultural areas in Greece (Kassioumis et al., 2004;Arabatzis, 2005) may help explain the lower proportion of agriculture land cover-types in these regions. In Sweden, small farms are also more common in forested areas, since the agricultural re- structuring processes has increased farm size on the agriculture plains (i.e., in Scania in southern Sweden) (Ihse, 1995). Another factor behind the smaller percentage of agriculture in these regions is farmland abandonment, as described in Croatia (Mikulićet al., 2014), Greece (Oikonomakis and Ganatsas, 2012) Italy (Agnoletti, 2007) or Estonia (Peterson and Aunap, 1998). For example, the abandonment of the agricultural land in the least accessible areas of the Alps reached 70% in the last 150 years (Tasser et al., 2007). In addition to the importance of these small farms highlighted by Salvioni et al. (2014), which are characterized, in many of these regions, by an agricultural production and subsistence farming essentially for household food consumption (e.g.Bojnec and Latruffe, 2013), or to their conservation value (Mikulić et al., 2014), the collapse of these agrarian farm structures poses other problems in Mediterranean woodland-dominated landscapes, which are related with wildfires (e.g.Viedma et al., 2015).
Finally, the regions included in cluster 8 have the lowest average value of agricultural land use (< 15%), and a lower proportion of small farms (considering both dimensions of farm size used in our study) in this specific geographical context. For example, it is possible to found large forestry areas in Finland, while in Norway, continuous natural and semi-natural grasslands are also common. These grasslands, parti- cularly in northern Fennoscandia, are used for large-scale reindeer grazing (Käyhkö and Pellikka, 1994;Fernandes and Guiomar, 2006). In southern Fennoscandia, the abandonment of grazing and agricultural areas is also reported in literature (e.g.Staaland et al., 1998), which helps explaining the small agricultural area, and particularly the smaller proportion of small farms. In remote regions in northern and eastern Finland, some agricultural land has been abandoned, but most of the agricultural area is still in use in western and southern regions (e.g.Rautiainen et al., 2016).
4.5. Limitations of the approach
One of the major limitations to the development of an analysis on this scale and with this complexity is related to the quality of the data, and with particular elements which are considered relevant drivers of farm size in each country. Moreover, different eligibility criteria for data inclusion in agricultural census may also comprise a limitation, being a source of unknown heterogeneity and constraining the results.
To complement the picture provided by the present analysis, it would be relevant to add data on subsistence farming. The farms which mainly have a role as subsistence production units frequently fall out of the existing data sets (EC, 2011; Claros, 2014; Lowder et al., 2016).
Davidova et al. (2013)andFredriksson et al. (2016)also highlighted the lack of adequate data for subsistence farming, since they were ex- cluded from several official statistical surveys as they fall below the size thresholds for data collection. Their inclusion in a future analysis will contribute to a more accurate picture of the relative importance and distribution of small farms in Europe.
Moreover, each country has its own legal definition of farm, and the official agricultural statistics are built upon very heterogeneous thresholds (which have changed between 2007 and 2010, also reducing comparability between periods) on what is considered farms and farming (EC, 2013). Indicators based on the number of holdings are extremely sensitive to these differences and changes (positively skewed distribution), whereas indicators based on area are more robust (ne- gatively skewed distribution).
We must also to consider that a considerable part of the farms that have emerged from collectivized and state farms of Socialist regime have retained their corporate structure,“operating as cooperatives or limited liability companies”(Blacksell, 2010, 17 pp.), and with the data available it is difficult to differentiate complex situations such as those where the landowner is not the land manager or the land user.
5. Conclusions
The study shows that the distribution of small farms in Europe, through our regional scale approach, confirm many of the research findings from literature regarding farm size distribution at national level or in particular regions. The map hereby produced (Fig. 6) re- presents the farm structure in terms of its structural and economic sizes and in terms of the relative importance of agriculture in each region. It provides a territorial approach to the classification of regions in relation to the importance and role of small farms, and it brings new knowledge on the context-specific importance of small farms in the different re- gions of Europe.
From this classification, it is not possible to infer with certainty si- milarities or dissimilarities between regions concerning farming types or land use intensity. However, it is possible to associate some aspects of land use, land cover change processes and biophysical constraints which characterize the regions in each class. Our aim was not to capture the diversity, heterogeneity and/or variability in each country, parti- cularly in those where the most extreme situations occur. For this, more detailed national scale analysis is required, and only in some countries the available data makes such an analysis possible. The goal of the presented analysis was to progress beyond the state of the art, using the existing (and limited) datasets at European level. Even considering the above mentioned limitations of the datasets, our applied approach allow to differentiate the Scottish highlands from the lowlands, identify the three main farm structures characterized byKostrowicki (1970)in Poland, individualize the regions subjected to intense afforestation and where the small individual plots remain in Portugal, separate the coastal and mountain or Apennine areas in Italy, and differentiate the Southern and Alpine areas from the rest of the regions in France, which appear rather homogenous in terms of small farms.
Nevertheless, the indicators explored, and the maps produced, are a step forward in clarifying how small farms are important and how they are distributed in the different regions in Europe, and how they are positioned in relation to the agricultural context and the overall terri- torial characteristics, in each region. This territorial approach is a condition for the design of more integrated and multisectoral policy strategies that recent rural development guidelines defend (Hodge, 2016). Thus, including the regional context in the assessment of the small farms role and distribution in Europe, brings new insights highly needed for more targeted public policies. Defining typologies and as- sessing the distribution of small farms are critical for a better for- mulation of the Rural Development Plan (Pillar II of the Common Agricultural Policy–CAP) which affects the maintenance of small farms able to generate social, cultural and environmental benefits from agri- culture and support sustainable rural development and, therefore, is capable to fulfill all three main objectives of the CAP: viable food production, sustainable management of natural resources, and balanced territorial development.
Moreover, the demanding administration of the CAP, in many new member states, discourages recent or potential smallholders to become part of the system (e.g.Wegener et al. 2011,Bezák and Mitchley, 2014).
However, our results also reinforce the need for a re-formulation of the future European agricultural policy, in order to address other values related with small farms, particularly the services provided by these farming types. Our approach also attempts to address the need for novel perspectives to support and design sustainable food and nutrition se- curity strategies, where the context specific characteristics are taken in consideration and tailored solutions are conceived and implemented,