O R I G I N A L A R T I C L E
Impaired metabolism in donor kidney grafts after steroid pretreatment
Julia Wilflingseder,1,2Alexander Kainz,1,2Irmgard Mu¨hlberger,3Paul Perco,3 Robert Langer,4 Ivan Kristo,5Bernd Mayer3 and Rainer Oberbauer1,2
1 Department of Nephrology KH Elisabethinen, Linz, Austria
2 Department of Nephrology Medical University of Vienna, Vienna, Austria 3 Emergentec Biodevelopment GmbH, Vienna, Austria
4 Department of Transplantation and Surgery, Semmelweis University, Budapest, Hungary 5 Department of Transplant Surgery Medical University of Vienna, Vienna
Introduction
Kidney transplantation is the preferred treatment for end- stage renal disease (ESRD) because it is considerably less expensive than dialysis on an overall basis and allows for an almost normal life. One of the main reasons of graft failure is delayed graft function (DGF), a form of acute renal failure resulting in post-transplantation oliguria, increased allograft immunogenicity and risk of acute rejection episodes, and decreased long-term survival [1].
Roughly one-third of transplant patients receiving an organ from a deceased donor develop DGF and have to be treated by dialysis until the engrafted organ resumes function. The hazard ratio for graft failure is almost twice
as high in recipients who experienced DGF when compared with those without initial complications [2].
Factors which contribute to DGF can be divided into donor-related and recipient-related factors. Donor-related factors include donor age, diseases such as hypertension, brain death-associated causes such as hemodynamic insta- bility, massive cytokine release and vasopressor use. A thorough discussion of donor and recipient factors con- tributing to DGF was published by Schwarz et al. [3].
The fact that DGF is a rare exception in live kidney trans- plantation suggests that donor factors rather than the transplant procedure itself mainly contribute to DGF.
Next to the histopathological examination of renal biopsies the determination of gene expression profiles in
Keywords
bioinformatics, delayed graft function, renal transplantation, system biology,
transcriptome.
Correspondence
Rainer Oberbauer MD, MSc, Department of Nephrology, Medical University of Vienna, Wa¨hringer Gu¨rtel 18-20, 1090 Vienna, Austria. Tel.: +43 70 7676 4305; fax: +43 70 7676 4306; e-mail: rainer.oberbauer@
meduniwien.ac.at
Additional information: http://www.
meduniwien.ac.at/nephrogene/data/
Received: 3 December 2009
Revised requested: 23 December 2009 Accepted: 30 December 2009 Published online: 9 February 2010 doi:10.1111/j.1432-2277.2010.01053.x
Summary
We recently showed in a randomized control trial that steroid pretreatment of the deceased organ donor suppressed inflammation in the transplant organ but did not reduce the rate or duration of delayed graft function (DGF). This study sought to elucidate such of those factors that caused DGF in the steroid-treated subjects. Genome-wide gene expression profiles were used from 20 steroid- pretreated donor-organs and were analyzed on the level of regulatory protein–
protein interaction networks. Significance analysis of microarrays (SAM) yielded 63 significantly down-regulated sequences associated with DGF that could be functionally categorized according to Protein ANalysis THrough Evo- lutionary Relationships ontologies into two main biologic processes: transport (P< 0.001) and metabolism (P< 0.001). The identified genes suggest hypoxia as the cause of DGF, which cannot be counterbalanced by steroid treatment.
Our data showed that molecular pathways affected by ischemia such as trans- port and metabolism are associated with DGF. Potential interventional targeted therapy based on these findings includes peroxisome proliferator-activated receptor agonists or caspase inhibitors.
donor organs poses an option to determine graft quality and even predict transplant outcome to a certain extent [4,5]. In a recent study from our group, we reported a number of differentially regulated genes when comparing donor organs from living and deceased donor organs.
Up-regulated genes in tissue samples from deceased donors were mainly involved in inflammatory processes, complement activation, apoptosis and cell adhesion [6].
Based on these findings, we initiated a randomized, dou- ble-blinded, placebo-controlled trial to elucidate whether pretreatment of deceased organ donors with corticosteroids (1 g methylprednisolone) before organ retrieval will reduce inflammation and subsequently the rate of DGF after engraftment. One main finding of this study with 447 renal allograft recipients was that steroid pretreatment caused a reduction of inflammatory signatures in the donor kidney as monitored on the level of gene expression profiles. How- ever, neither the rate nor the duration of DGF was different in the treatment and placebo group. We therefore hypothe- size that additional pathways beyond those related to inflammation are involved in the development of DGF.
Thus the analysis of the steroid treatment arm provides a unique opportunity to investigate molecular mechanisms other than inflammation which contribute to DGF.
Brain death is associated with rapid swings in blood pressure, hypo- and hypertension, coagulopathies, pulmo- nary changes, hypothermia and electrolyte aberrations [7–9]. Therefore, donor brain death not only results in increased inflammation but also leads to hypoperfusion and hypoxia of the donor organ [10].
The main objective of this study was to elucidate molecular causes of DGF that were not abolished by the steroid donor pretreatment. Specifically, we compared the molecular signature of kidney biopsies from steroid-trea- ted donors with primary graft function in relation to kid- neys with DGF. We sought to identify potential new targets for intervention that ultimately may reduce the current high rate of DGF.
Material and methods
Donor- and recipient characteristics
Out of the 238 recipients of steroid pretreated donor kid- neys, we randomly identified 10 of 52 who developed DGF and matched an equal number of primary graft kid- neys. Matching variables of controls were cause of donor death (stroke versus trauma) and caliper-matching of donors’ last creatinine and donor age.
The rationale behind the sample size was that based on previous data that 20 biopsies would be sufficient to detect a more-than-twofold difference in the expression of 30 predefined genes at an adjusted P-value of <0.05 using the Bonferroni–Holm method [6,11].
Trial design
Details on the multicenter trial may be found elsewhere (http://www.controlled-trials.com/ISRCTN78828338 and Kainz & Wilflingseder et al. [Abstract TTS Sydney 2008
#859, Annals of Internal Medicine submitted 2009] [12].
In brief, 269 donors stratified for age were equally ran- domized in blocks of 4–1000 mg of corticosteroid or pla- cebo injection 6 h before organ recovery. Before transplantation, kidney wedge biopsies were obtained and subjected to genomics analyses. The post-transplant clini- cal course was monitored.
The study protocol was approved by the Institutional Review Board (Ethical Committee of the Medical Univer- sity of Vienna # EK-067/2005, to be found at http://
ohrp.cit.nih.gov/search/) and the EUROTRANSPLANT kidney advisory committee (#6021KAC06) at each study site and conducted according to IRB standards at each institution. DGF was defined as the need for more than one dialysis treatment within the first week after trans- plantation or creatinine values above 3 mg/dl during the first week after transplantation.
Laboratory procedures and biostatistical analyses Donor kidney biopsy specimen, RNA isolation and amplification
All organs were perfused with a histidine-tryptophan- ketoglutarate (HTK) cold preservation solution at 4C during organ procurement [13]. The cold ischemic time was not longer than 24 h. Wedge biopsies of each kidney were taken under sterile conditions at the end of the cold ischemic time right before transplantation. The biopsy specimens were immediately submerged in RNAlater (Ambion, Austin, TX, USA) and stored at 4C.
Total RNA was isolated and purified using chloroform and trizol reagent (Invitrogen, Carlsbad, CA, USA). RNA yield and quality was checked with the Agilent 2100 Bio- analyzer and RNA6000 LabChip kit (Agilent, Palo Alto, CA, USA). Stratagene Universal human reference RNA was used as reference (Stratagene, La Jolla, CA, USA).
Two micrograms of isolated total RNA were amplified using the RiboAmp RNA amplification kit (Arcturus, Mountain View, CA, USA). The amplified RNA was inspected on an ethidium bromide stained 1% agarose gel and on the Agilent 2100 Bioanalyzer. For the 20 zero- hour kidney biopsies, the RNA was of sufficient quality to proceed with microarray analysis.
Microarray hybridization and scanning
Complementary DNA (cDNA) microarrays holding 41 421 (batch: SHEO) features were obtained from the Stanford University Functional Genomics core facility. All
microarray experiments were performed as described ear- lier [14]. The detailed protocols are available at http://
genome-www.stanford.edu/. Using a type II experimental setup, 1lg of sample and standard Stratagene Universal human reference aRNA were labeled with CyScribe cDNA postlabeling kit (Amersham Pharmacia Biotech, Bucking- hamshire, UK) in a two-step procedure.
Samples were loaded onto arrays and incubated for 18 h in a 65C water bath. After three washing steps, the fluorescence images of the hybridized microarrays were examined using a GenePix 4100A scanner (Molecular Devices, Sunnyvale, CA, USA). Thegenepix pro6.0 soft- ware (Molecular Devices, Sunnyvale, CA, USA) was used to grid images and to calculate spot intensities. Arrays were numbered according to the anonymous organ donor ID, and were processed in random order. Image-, grid- and data-files were submitted to the Stanford Microarray Database (http://genome-www5.stanford.edu/MicroArray/
SMD/) and followed MIAME guidelines for arrays experi- ments [15,16]. Raw data files as well as the MIAME checklist are available at our laboratory webpage at http://
www.meduniwien.ac.at/nephrogene/data/DGF/.
Microarray data analysis
The microarray dataset consisted of 41 421 cDNA fea- tures. 41 025 of those held a UniGene Cluster ID (27 442 unique genes), 396 were expressed sequence tags (ESTs) not assigned to a UniGene Cluster. Mean sector and printing plate anovaR2-values of the microarray experi- ments were on average 4.5·10)2 and 3.1·10)2 respec- tively, suggesting no dependency of results on spatial location or plate printing procedures. In a first prepro- cessing step a quality filter was applied on the dataset by considering only genes and ESTs with spot intensities of at least 1.5-fold over background in either channel 1 or 2 of the microarray thus leaving 32 588 cDNA features in the dataset. Only genes and ESTs with at least 80% of valid entries were considered for successive analysis steps thus further reducing the dataset to 24 624 cDNA fea- tures. The remaining missing data points were substituted applying ak-nearest-neighbor algorithm, where the num- ber of neighbors,k, was set to 10 [17]. No correction for a putative batch bias was necessary because only one array batch was used in the whole analysis for all arrays.
We used the SAM methods as well as the Student’st-test in order to find differentially regulated genes (DEGs) between patients experiencing DGF and the control group with primary functioning (PF) grafts [18]. The P-value threshold was set to <0.05 with fold-change values >2.
The number of permutations in the significance analysis of microarrays (SAM) method was set to 20 000 and a false discovery rate of 2.5% was selected. Differentially expressed genes were hierarchically clustered and graphi-
cally represented using the MultiExperiment Viewer developed at The Institute for Genomic Research [19].
The cosine correlation and complete linkage were used as distance measure and linkage rule in the hierarchical clus- ter algorithm respectively [19,20].
Functional data enrichment
Differentially regulated genes (DEGs) were furthermore analyzed with respect to their molecular functions, associ- ated biological processes, and cellular locations using gene ontology terms (GO-Terms) as provided by the Gene Ontology Consortium [21]. The SOURCE tool from the Stanford Genomics Facility was used for linking GO-Terms to the genes of interest [22]. Functional group- ing of genes was based on GO-Terms, Protein ANalysis THrough Evolutionary Relationships (PANTHER) ontolo- gies, and information derived from the protein data retrie- val system iHOP [23,24].
Regulatory network analysis
All identified DEGs were mapped on a molecular depen- dency graph holding about 70 000 annotated human pro- teins [25]. Each graph node codes for a particular protein and edges between nodes encode pairwise depen- dencies. Dependencies were computed based on protein–
protein interaction information, similarity in gene expression, conjoint regulatory patterns on the level of transcription factors and microRNAs, as well as assign- ment to functional ontologies. Subnetworks holding at least two DEGs were retrieved and further analyzed on a functional level.
Statistical analysis
Continuous data were analyzed by Wilcoxon rank-sum tests, categorical data by chi-squared tests or Fisher’s exact tests when appropriate. AP-value <0.05 was consid- ered statistically significant. For all analyses sas for Win- dows 9.2 (The SAS Institute, Inc., Cary, NC, USA) was used.
Results
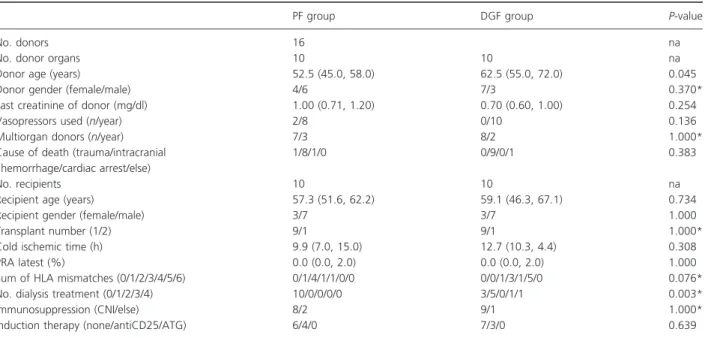
Demographic data on transplant donors and recipients are provided in Table 1.
Molecular signatures separating DGF from primary function (PF) in steroid-treated donor organs
Using the SAM method, 63 transcripts could be identified as significantly differentially regulated. Both gene lists are provided in Tables S1 and S2 sorted by fold-change values.
In total, 147 features showed fold-change values >2 and P-values smaller than 0.05 following at-test. The majority of features were suppressed with only 10 genes being up-regulated in the DGF as compared with the PF group.
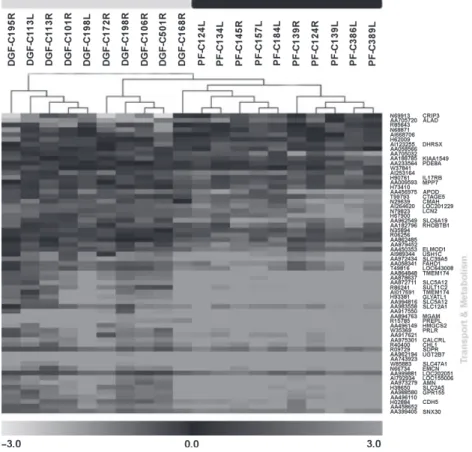
An expression profile-based clustering resulted in an almost complete discrimination between DGF and PF samples as given in Fig. 1.
Functional analysis
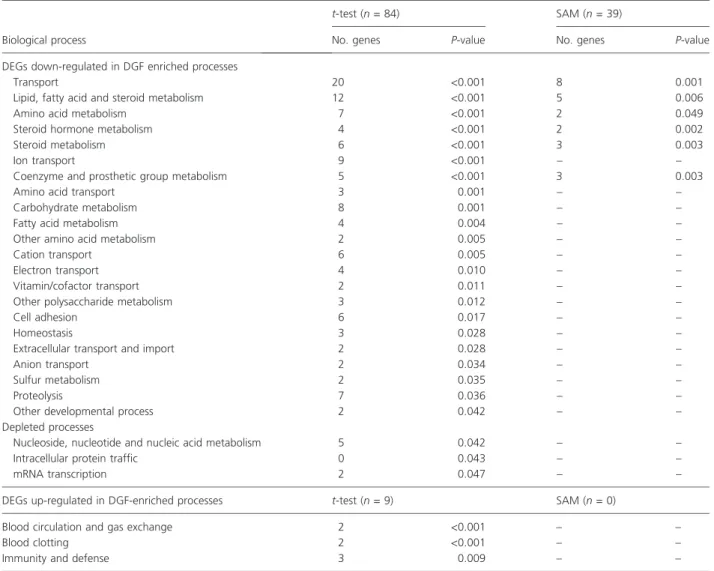
Thirty-nine out of the 63 transcripts (SAM, 41 unique genes) and 84 out of the 135 down-regulated transcripts (t-test, 91 unique genes) could be mapped to PANTHER IDs. Significantly enriched or depleted biological processes with at least two members are given in Table 2 (P-value
<0.05 given by a chi-squared test when comparing the number of genes associated to the category with the total number of genes belonging to this particular process).
Enriched processes mainly include genes involved in trans- port and metabolism. DGF-associated down-regulated genes include many transcripts encoding solute carriers (ion, amino acid and glucose transporters) in the plasma membrane and other transporters in the cytoplasma and extracellular space. Prominent members are the organic anion transporter (SLC22A8), neutral amino acid trans- porter (SLC6A19), the sodium/glucose cotransporter (SLC5A12), lipocalin 2 (LCN2), and apolipoprotein D (APOD). Proteins involved in metabolism, including lipid, fatty acid, and steroid metabolism, were predominantly
down-regulated in DGF samples. Depleted processes are nucleoside and protein metabolism, mRNA transcription and intracellular protein traffic. Up-regulated transcripts (t-test, nine unique genes) were mainly associated with blood clotting as well as immunity and defense.
Interactome analysis
We retrieved in total seven networks holding at least two of the differentially regulated genes (Fig. 2). Members of network cluster 1 holding 13 proteins are mainly involved in blood clotting with fibrinogen gamma (FGG), fibrino- gen alpha (FGA), and the frizzled homology 8 being up-regulated in patient samples experiencing DGF.
Hypoxia and an older donor age might lead to the activa- tion of fibrotic pathways which contribute to DGF. The central protein of network cluster two is the suppressor of cytokine signalling 3 (SOCS3) that shows higher expression values in the group of patients with DGF post- transplant. The other network clusters contain mainly down-regulated genes with members of cluster 6 being involved in steroid metabolism and members of clusters 4 and 7 being involved in lipid and fatty acid metabolism (Fig. 2).
Discussion
In this study, we elucidated molecular mechanisms associ- ated with DGF after renal transplantation in zero-hour
Table 1.Demographic data of transplant donors and recipients stratified by treatment assignment. Continuous data are provided as median (first, third quartile), categorical data are shown as counts.
PF group DGF group P-value
No. donors 16 na
No. donor organs 10 10 na
Donor age (years) 52.5 (45.0, 58.0) 62.5 (55.0, 72.0) 0.045
Donor gender (female/male) 4/6 7/3 0.370*
Last creatinine of donor (mg/dl) 1.00 (0.71, 1.20) 0.70 (0.60, 1.00) 0.254
Vasopressors used (n/year) 2/8 0/10 0.136
Multiorgan donors (n/year) 7/3 8/2 1.000*
Cause of death (trauma/intracranial hemorrhage/cardiac arrest/else)
1/8/1/0 0/9/0/1 0.383
No. recipients 10 10 na
Recipient age (years) 57.3 (51.6, 62.2) 59.1 (46.3, 67.1) 0.734
Recipient gender (female/male) 3/7 3/7 1.000
Transplant number (1/2) 9/1 9/1 1.000*
Cold ischemic time (h) 9.9 (7.0, 15.0) 12.7 (10.3, 4.4) 0.308
PRA latest (%) 0.0 (0.0, 2.0) 0.0 (0.0, 2.0) 1.000
Sum of HLA mismatches (0/1/2/3/4/5/6) 0/1/4/1/1/0/0 0/0/1/3/1/5/0 0.076*
No. dialysis treatment (0/1/2/3/4) 10/0/0/0/0 3/5/0/1/1 0.003*
Immunosuppression (CNI/else) 8/2 9/1 1.000*
Induction therapy (none/antiCD25/ATG) 6/4/0 7/3/0 0.639
na, not applicable.
*Fisher’s exact test.
donor kidney biopsies pretreated with corticosteroids.
Based on our findings, poor initial function can be explained by a partial shutdown of metabolism and trans- port activity on a molecular level.
One possible explanation of reduced transport and metabolism is hypoxia. In the absence of oxygen, severe energy depletion, i.e. less production of ATP and subse- quent activation of number of critical alterations in metabolism, occurs [26]. The effects of limited oxygen supply are aggravated by the higher demand associated with the high tubular oxygen consumption necessary for solute exchange [27] and the high rate of aerobic glycoly- sis [28]. Hypoxia is also a profibrogenic stimulus for tubular cells, interstitial fibroblasts, and renal microvascu- lar endothelial cells. Hypoxia can also activate fibroblasts and change the extracellular matrix metabolism of resi- dent renal cells [29,30] and has been shown to play a role in the progression of chronic kidney disease [31]. There- fore, the use of effective preservation solutions and reduc- tion of cold ischemia times may improve kidney function after transplantation [32].
The down-regulation of many transporters is probably caused by less oxygen supply and subsequent energy depletion. The solute carrier family 4, sodium bicarbonate cotransporter, member 4 (SLC4A4) built a small cluster with the carbonic anhydrase IV (CA4) and is involved in the regulation of bicarbonate secretion and absorption and intracellular pH suggesting tubular acidosis (Fig. 2).
Protein–protein interactions of transporters in the molec- ular dependency graph are rare suggesting that these pathways are under-represented in the interactome analy- sis.
Lipid metabolism, fatty acid metabolism and steroid metabolism are down-regulated in DGF samples and are the most enriched functional categories next to transport function (Fig. 2, network clusters 4, 6, 7). Although the hydroxyprostaglandin dehydrogenase 15-(NAD) (HPGD), the sulfotransferase family, cytosolic, 1C, member 2 (SULT1C2), and the three glucuronosyltransferase 2 family polypeptides UGT2B15, UGT2B4, UGT2B7 are members of the steroid metabolism, they cannot be linked directly to methylprednisolone treatment. Another
Figure 1Dendrogram derived by unsupervised hierarchical clustering of gene expression profiles dichotomizing delayed graft function (DGF) group (grey bar) from primary function (PF) (black bar), all received steroid pretreatment. Grey spots indicate up-regulated or down-regulated tran- scripts relative to the reference RNA used. The differentially regulated genes associated with DGF could be categorized according to GO-terms mainly into transport and metabolism.
prominent gene, the suppressor of cytokine signaling 3 (SOCS3), belongs to a family of negative-feedback regula- tors of cytokine signaling. This regulator is induced by its corresponding cytokines leading to the subsequent shut- down of the respective signaling cascade [33]. SOCS3 is involved in the JAK/STAT-dependent cytokine signaling pathways and is linked to the down-regulated prolactin receptor. On the other side, SOCS3 is linked over IRS2 (insulin receptor substrate 2) to the down-regulated insu- lin receptor (Fig. 2, cluster 2).
Reduced transport activity and metabolism indicating poorer quality of renal grafts was also reported by other trancriptomics studies of donor kidney biopsies develop- ing DGF [6,34,35]. Approximately one-third of reported down-regulated genes by Mueller et al. were also identi- fied in our study, thus strengthening the validity of
obtained results. The common theme of inflammation and immune response in the context of DGF was delin- eated in all three studies. The suppression of inflamma- tion with corticosteroids in our study led to the identification of novel molecular mechanisms besides inflammation and complement activation associated with the development of DGF, namely limited transport capa- bilities and decreased metabolic activity of the renal organ. However, one cluster in the dependency graph with the down-regulated major histocompatibility com- plex, class II, DR beta 3 (HLA-DRB1) and the up-regu- lated CD3d molecule, delta (CD3-TCR complex) (CD3D) belongs to immunity response.
A fair number of induced genes in DGF samples could be linked to blood clotting with fibrinogen gamma and fibrinogen alpha being two prominent members. This
Table 2.Functional classification of DEGs using PANTHER ontologies: Enriched or depleted biological processes Separating DGF and PF as derived on the level of differential gene expression byt-test and SAM. Categories are ranked by theP-value (comparison of expected number of genes and observed number of genes in each biological process) indicating the relevance of a particular process.
Biological process
t-test (n= 84) SAM (n= 39)
No. genes P-value No. genes P-value
DEGs down-regulated in DGF enriched processes
Transport 20 <0.001 8 0.001
Lipid, fatty acid and steroid metabolism 12 <0.001 5 0.006
Amino acid metabolism 7 <0.001 2 0.049
Steroid hormone metabolism 4 <0.001 2 0.002
Steroid metabolism 6 <0.001 3 0.003
Ion transport 9 <0.001 – –
Coenzyme and prosthetic group metabolism 5 <0.001 3 0.003
Amino acid transport 3 0.001 – –
Carbohydrate metabolism 8 0.001 – –
Fatty acid metabolism 4 0.004 – –
Other amino acid metabolism 2 0.005 – –
Cation transport 6 0.005 – –
Electron transport 4 0.010 – –
Vitamin/cofactor transport 2 0.011 – –
Other polysaccharide metabolism 3 0.012 – –
Cell adhesion 6 0.017 – –
Homeostasis 3 0.028 – –
Extracellular transport and import 2 0.028 – –
Anion transport 2 0.034 – –
Sulfur metabolism 2 0.035 – –
Proteolysis 7 0.036 – –
Other developmental process 2 0.042 – –
Depleted processes
Nucleoside, nucleotide and nucleic acid metabolism 5 0.042 – –
Intracellular protein traffic 0 0.043 – –
mRNA transcription 2 0.047 – –
DEGs up-regulated in DGF-enriched processes t-test (n= 9) SAM (n= 0)
Blood circulation and gas exchange 2 <0.001 – –
Blood clotting 2 <0.001 – –
Immunity and defense 3 0.009 – –
might in part be explained by the advanced age of the donors in the DGF group. Donor age is a well known risk factor of DGF but not all grafts from old donors have necessarily poor graft function. Determination of the graft quality based on demographic/clinical and molecular risk factors probably provides a much better forecast model [4]. Especially the shortage of donor organs makes an expansion of donor criteria to include older and non- heart-beating donors necessary with the risk of higher rates of DGF. Therefore a better understanding of molec- ular mechanisms leading to DGF is of great interest and new strategies and better donor management is of great importance for the prevention of this disease.
A limitation of this study is probably the use of cDNA arrays which cannot discriminate between different splice variants in the measurement of expression levels. None- theless, we could identify genes mainly involved in trans- port and lipid, glucose metabolism associated with DGF in renal transplants.
Based on these results, it can be hypothesized that the activation of lipid and glucose metabolism may prevent the graft from developing acute renal failure. One possible treatment strategy is the administration with peroxisome proliferator-activated receptor (PPAR) agonists. The PPARs are ligand-activated transcription factors that con- trol lipid and glucose metabolism. Activation of PPARs negatively regulates the expression of genes induced by cerebral ischemia/reperfusion injury and was shown to prevent post-ischemic inflammation and neuronal dam- age in severalin vitroandin vivomodels [36].
Another possible strategy to revert the effects of hypoxia is the treatment with caspase inhibitors. The administration of caspase inhibitors in vivo was demon- strated to protect against cell death in animal models of ischemic acute renal failure [37]. The pancaspase inhibi-
tor Q-VD-OPH prevents the rise in caspase activity and apoptosis [38]. Therefore PPAR-agonists and caspase inhibitors may be adopted in the donor pretreatment to prevent ischemic/reperfusion injury in the kidney. Donor pretreatment has great advantages for the recipient because improved long-term survival could thus be achieved cost-efficiently and without great effort or side- effects.
In summary, our analyses provide novel insight into the biological processes that are associated with postis- chemic DGF. Based on our findings prospective trials with targeted therapy, including PPAR-agonists or caspase inhibitors, may be designed to elucidate the causal infer- ence of these risk markers of DGF.
Funding
This study was supported by grants from the Austrian Science Fund (FWF P-18325) and the Austrian Academy of Science (OELZELT EST370/04) to R.O.
Acknowledgements
This study was supported by grants from the Austrian Science Fund and the Austrian Academy of Science (FWF P-18325 to R.O.). We acknowledge the valuable contribu- tion of the OPO coordinators.
Supporting information
Additional Supporting Information may be found in the online version of this article:
Table S1. Sixty-three differentially regulated transcripts computed with the significance analysis of microarrays (SAM) method sorted by fold-change values. The number
Figure 2Seven identified networks with at least two differentially regulated genes between delayed graft function (DGF) and primary function (PF) samples. Dark grey nodes depict up-regulated genes in DGF samples whereas light grey nodes depict down-regulated genes. Differentially expressed proteins showed a high connectivity in these networks, thus indicating concerted interaction and relevance in the development of DGF.
of permutations in the SAM method was set to 20 000 and a false discovery rate of 2.5% was selected.
Table S2. One hundred and forty-seven differentially regulated transcripts computed with the Student’s t-test sorted by fold-change values. The P-value threshold was set to <0.05 with fold-change values >2.
Please note: Wiley-Blackwell are not responsible for the content or functionality of any supporting materials sup- plied by the authors. Any queries (other than missing material) should be directed to the corresponding author for the article.
References
1. Perico N, Cattaneo D, Sayegh MH, Remuzzi G. Delayed graft function in kidney transplantation.Lancet2004;364:
1814.
2. Ojo AO, Wolfe RA, Held PJ, Port FK, Schmouder RL.
Delayed graft function: risk factors and implications for renal allograft survival.Transplantation1997;63: 968.
3. Schwarz C, Oberbauer R. The influence of organ donor factors on early allograft function.Curr Opin Urol2003;
13: 99.
4. Koppelstaetter C, Schratzberger G, Perco P,et al.Markers of cellular senescence in zero hour biopsies predict out- come in renal transplantation.Aging Cell.2008;7: 491.
5. Perco P, Kainz A, Wilflingseder J, Soleiman A, Mayer B, Oberbauer R. Histogenomics: association of gene expres- sion patterns with histological parameters in kidney biop- sies.Transplantation2009;87: 290.
6. Hauser P, Schwarz C, Mitterbauer C,et al.Genome-wide gene-expression patterns of donor kidney biopsies distin- guish primary allograft function.Lab Invest2004;84: 353.
7. Bruinsma GJ, Nederhoff MG, Geertman HJ,et al.Acute increase of myocardial workload, hemodynamic instability, and myocardial histological changes induced by brain death in the cat.J Surg Res1997;68: 7.
8. Novitzky D. Detrimental effects of brain death on the potential organ donor.Transplant Proc1997;29: 3770.
9. Power BM, Van Heerden PV. Acute increase of myocardial workload, hemodynamic instability, and myocardial histo- logical changes induced by brain death in the cat.Anaesth Intensive Care1997;68: 7.
10. Legrand M, Mik EG, Johannes T, Payen D, Ince C. Renal hypoxia and dysoxia after reperfusion of the ischemic kid- ney.Mol Med2008;14: 502.
11. Kainz A, Mitterbauer C, Hauser P,et al.Alterations in gene expression in cadaveric vs. live donor kidneys suggest impaired tubular counterbalance of oxidative stress at implantation.Am J Transplant2004;4: 1595.
12. Kainz A, Wilflingseder JMC, Haller M,et al.A multicenter prospective, randomised, double-blind, placebo-controlled trial of deceased organ donor pretreatment with corticos- teroids for the prevention of postischemic acute renal fail-
ure after kidney transplantation.Ann Intern Med2009;
submitted.
13. Groenewoud AF, Thorogood J. Current status of the Eurotransplant randomized multicenter study comparing kidney graft preservation with histidine-tryptophan- ketogluterate, University of Wisconsin, and Euro-Collins solutions. The HTK Study Group.Transplant Proc1993;
25: 1582.
14. Perou CM, Sorlie T, Eisen MB, et al. Molecular portraits of human breast tumours. Nature 2000; 406:
747.
15. Brazma A, Hingamp P, Quackenbush J,et al.Minimum information about a microarray experiment (MIAME)- toward standards for microarray data.Nat Genet2001;29:
365.
16. Gollub J, Ball CA, Binkley G,et al.The Stanford Micro- array Database: data access and quality assessment tools.
Nucleic Acids Res2003;31: 94.
17. Troyanskaya O, Cantor M, Sherlock G,et al.Missing value estimation methods for DNA microarrays.Bioinformatics 2001;17: 520.
18. Tusher VG, Tibshirani R, Chu G. Significance analysis of microarrays applied to the ionizing radiation response.
Proc Natl Acad Sci USA2001;98: 5116.
19. Saeed AI, Sharov V, White J,et al.TM4: a free, open- source system for microarray data management and analy- sis.BioTechniques2003;34: 374.
20. Eisen MB, Spellman PT, Brown PO, Botstein D. Cluster analysis and display of genome-wide expression patterns.
Proc Natl Acad Sci USA1998;95: 14863.
21. Ashburner M, Ball CA, Blake JA,et al.Gene ontology: tool for the unification of biology. The Gene Ontology Consor- tium.Nat Genet2000;25: 25.
22. Diehn M, Sherlock G, Binkley G,et al.SOURCE: a unified genomic resource of functional annotations, ontologies, and gene expression data. Nucleic Acids Res 2003;31: 219.
23. Mi H, Lazareva-Ulitsky B, Loo R,et al.The PANTHER database of protein families, subfamilies, functions and pathways.Nucleic Acids Res2005;33: D284.
24. Hoffmann R, Valencia A. A gene network for navigating the literature.Nat Genet2004;36: 664.
25. Bernthaler A, Muhlberger I, Fechete R, Perco P, Lukas A, Mayer B. A dependency graph approach for the anal- ysis of differential gene expression profiles. Mol Biosyst 2009; 3: 3.
26. Devarajan P. Update on mechanisms of ischemic acute kidney injury.J Am Soc Nephrol2006;17: 1503.
27. Rosen S, Epstein FH, Brezis M. Determinants of intrarenal oxygenation: factors in acute renal failure.Ren Fail1992;
14: 321.
28. Cohen JJ. Is the function of the renal papilla coupled exclusively to an anaerobic pattern of metabolism?Am J Physiol1979;236: F423.
29. Norman JT, Clark IM, Garcia PL. Hypoxia promotes fibrogenesis in human renal fibroblasts.Kidney Int2000;
58: 2351.
30. Norman JT, Orphanides C, Garcia P, Fine LG. Hypoxia- induced changes in extracellular matrix metabolism in renal cells.Exp Nephrol1999;7: 463.
31. Rudnicki M, Perco P, Enrich J,et al.Hypoxia response and VEGF-A expression in human proximal tubular epithelial cells in stable and progressive renal disease.
Lab Invest2009;89: 337.
32. Moers C, Smits JM, Maathuis MH,et al.Machine perfusion or cold storage in deceased-donor kidney transplantation.N Engl J Med2009;360: 7.
33. Heeg K, Dalpke A. TLR-induced negative regulatory circuits: role of suppressor of cytokine signaling (SOCS) proteins in innate immunity.Vaccine.2003;21(Suppl. 2):
S61.
34. Mas VR, Archer KJ, Yanek K,et al.Gene expression patterns in deceased donor kidneys developing delayed
graft function after kidney transplantation.Transplantation 2008;85: 626.
35. Mueller TF, Reeve J, Jhangri GS, et al. The transcrip- tome of the implant biopsy identifies donor kidneys at increased risk of delayed graft function. Am J Transplant 2008; 8: 78.
36. Collino M, Patel NS, Thiemermann C. PPARs as new therapeutic targets for the treatment of cerebral ischemia/
reperfusion injury.Ther Adv Cardiovasc Dis2008;2:
179.
37. Melnikov VY, Faubel S, Siegmund B, Lucia MS, Ljubanov- ic D, Edelstein CL. Neutrophil-independent mechanisms of caspase-1- and IL-18-mediated ischemic acute tubular necrosis in mice.J Clin Invest2002;110: 1083.
38. Jani A, Ljubanovic D, Faubel S, Kim J, Mischak R, Edelstein CL. Caspase inhibition prevents the increase in caspase-3, -2, -8 and -9 activity and apoptosis in the cold ischemic mouse kidney. Am J Transplant 2004; 4:
1246.