Simulation of the performance of Cognitive Radio Networks with unreliable servers ∗
Mohamed Hedi Zaghouani
a, János Sztrik
a, Arban Uka
baSchool of Informatics, Faculty of Informatics University of Debrecen, Debrecen, Hungary zaghouani.hedi,sztrik.janos@inf.unideb.hu
bEPOKA University, Tirana, Albania auka@epoka.edu.al
Submitted: September 17, 2019 Accepted: January 19, 2020 Published online: January 31, 2020
Abstract
This paper deals with a Cognitive Radio Network (CRN) which is modeled using a retrial queuing system with two finite-sources. This network includes two non-independent service units treating two types of users: Primary Users (PU) and Secondary Users (SU). The primary unit has priority queue (FIFO) and a second service unit contains an orbit both units are dedicated for the Primary Users and Secondary Users, respectively.
The current work highlights the unreliability of the servers as we are as- suming that both servers of this network are subject to random breakdowns and repairs. All the inter-event times in this CRN are either exponentially or non-exponentially distributed. The novelty of our investigation is to ana- lyze the effect of several distributions (Gamma, Pareto, Log-normal, Hypo- Exponential and Hyper-Exponential) of the failure and repair times on the main performance measure of the system. By the help of simulation we show some interesting results concerning to sensitivity problems.
Keywords:Finite source queuing systems, Simulation, Cognitive Radio Net- works, Performance and Reliability measures, Non-reliable servers.
∗The work of Dr. János Sztrik is supported by the EFOP-3.6.1-16-2016-00022 project. The project is co-financed by the European Union and the European Social Fund. The work of Mohamed Hedi Zaghouani is financed by the Stipendium Hungaricum Scholarship.
doi: https://doi.org/10.33039/ami.2020.01.002 url: https://ami.uni-eszterhazy.hu
255
1. Introduction
Recent years have seen a significant increase in the demand for radio spectrum.
As this kind of network provides a maximum use rate for customers, by allowing unlicensed (Secondary) users to process their services, while there is no licensed (Primary) user in the spectrum. Cognitive Radio (CR) is an intelligent technology that can sense automatically the available channels in a wireless spectrum and mod- ify the transmission parameters allowing more communications to be established, additionally improves the network’s behavior. The CRN’s ultimate goal is to ex- ploit the free sections of the primary frequency bands for the benefit of unlicensed customers, without any disadvantage for the licensed users, more explanations can be found in [2, 3, 14]. As the idea of the cognitive radio was introduced to the re- search community of wireless communications, the establishment of CRNs becomes more realistic day by day, since so many researchers consider this innovation a big benefit for the network field. There are two types of CRN, the first is known as (underlay network) in which unlicensed users are entitled at the same time to use the primary channels with the PUs, depending on some predefined conditions. The second type is called (overlay networks) where the secondary customers are allowed to use the Primary Service Unit if this unit does not contain licensed customers, more explanation was introduced by the authors of [10, 13, 16]. Theoretically, the current paper treats the second mentioned type of CRN (overlay), by modeling a CRN that uses two finite-source subsystems with non-reliable servers (Primary and Secondary) exposed to breakdowns and repairs.
We are taking into consideration two subsystems in this queuing system. The first sub-system is built for the primary users (PU) requests. The number of sources is finite, moreover, in exponentially distributed time each source generates a pri- mary request for the PU, these tasks should be sent with a preemptive discipline to a single server which is called the Primary Channel Service (PCS), to start the service based on an exponentially distributed time as well. The second part of the model is dedicated to the secondary unit requests arriving from a finite-source as well, knowing that the service and the source times of the secondary customers are exponentially distributed. All the generated primary requests are headed to the primary server in order to check its accessibility. If the service unit is free the service starts instantly. However, if the primary unit is already busy with another primary request this last packet joins a FIFO queue. Nevertheless , if the primary unit is busy by treating a secondary user service, as consequence this packet dis- connects right away and will be sent back to the Secondary Channel Service (SCS).
Based on the availability of the secondary server this postponed task either starts the service again or joins the orbit. In the other hand, the secondary requests are sent to the secondary server to verify its availability. If the aimed server is available the service of request starts instantly, otherwise these unlicensed requests will try to join the Primary Service Unit (PSU). If it is free the service of the low priority task begins. If not, they must join the orbit automatically. Canceled requests in the orbit retry to be served after an exponentially distributed random interval,
more details can be found in [2, 3, 10, 13, 14, 16]. The servers used in our network are subject to some random breakdowns the interrupted requests are sent to the queue or to the orbit, respectively.
In our case, we assume that the servers failure and repair times are non- exponentially distributed (Hypo-Exponential, Hyper-Exponential, Gamma, Pareto and Log-normal). All the random times concerned in this model construction are supposed to be independent of each other.
In a similar work [6] authors considered that the network has a single server which is subject to breakdowns and repairs. This type of network suffers from difficulty with processing the requests as the breakdown of the only server effects the whole system, if the server is down then the whole network is down. Some other papers investigated further the retrial queuing model by modeling a cognitive radio network using two service channels (Primary and Secondary) both are subject to breakdowns and repair. For example, the authors of [9] assumed that both servers are unreliable and used different distributions for the inter-event times, Hypo and Hyper Exponential were used for the failure and repair times and Exponential distribution was assumed for the rest of the inter-event times (arrival, service and retrial). As extended work authors of [15] have added Gamma distribution to the above mentioned above distributions.
The main aim of this work is to study the effect of distributions for the failure and repair time on the main performance measures of the system. By the help of simulation we show some interesting results concerning to sensitivity problems.
2. System Model
As shown in Figure 1 our system model is a finite source queuing system with retrials which contains two sub-systems for the PUs and SUs knowing that these two subsystems are connected to each other. The model’s first subsystem will be dedicated for PU requests, in which𝑁1is the finite number of sources. Each inter- arrival time is exponentially distributed with rate 𝜆1 thus a primary request will be created and sent to a preemptive priority queue (FIFO). If the target server is idle the service starts instantly and last for an exponentially distributed time with parameter𝜇1. Otherwise, the new created request will have to wait in the queue.
The calls of the SUs will be generated randomly as well as, thus every inter-request time is assumed to be exponentially distributed with parameter 𝜆2 and will be served according to an exponentially distributed random variable with parameter 𝜇2. The number of sources in this second subsystem is𝑁2.
It should be noted that if a high priority request joins the primary server and finds it busy with an unlicensed (secondary) request the latter request will be interrupted and sent back either to the SSU (Secondary Service Unit) or to the orbit depending on the accessibility of the secondary channel. However, if the primary server is processing a licensed request the new customer will have to wait in the queue.
In case of secondary users they can process their services immediately if the
Figure 1: Cognitive Radio Network with finite-source retrial queu- ing system
dedicated channel is free. If it is busy they will check the availability of the primary channel hoping to start the service, furthermore, if the primary channel is busy too the involved task will be forwarded to the orbit. These postponed packets will try to get served after an exponentially distributed time with parameter𝜈.
As mentioned before the two subsystems of our network will be subject to breakdowns and repairs the failures of the service units can occur both in busy and idle status.
Failure and repair times will appear randomly for primary and secondary servers according to Hyper-Exponential, Hypo-Exponential, Gamma, Log-normal and Pa- reto distributions with given parameters. The corresponding intensities which are the inverse of the mean are denoted by𝛾1, 𝛾2 and𝜎1, 𝜎2, respectively.
Using the following stochastic model we can identify our system through the notations:
• 𝑘1(𝑡): represents the number of licensed sources at given time 𝑡;
• 𝑘2(𝑡): refers to the number of unlicensed at time given𝑡;
• 𝑞(𝑡): is the number of primary requests in the queue at certain time𝑡;
• 𝑜(𝑡): denotes the number of tasks in the orbit at time𝑡;
• 𝑦(𝑡) = 0, if the primary channel is idle, 𝑦(𝑡) = 1, if the primary channel is processing (busy) a high-priority request and𝑦(𝑡) = 2, if the primary service unit is processing (busy) a low-priority request at time𝑡;
• 𝑐(𝑡) = 0, if the secondary service unit is idle(free) and 𝑐(𝑡) = 1, if the sec- ondary service unit is busy at given time𝑡.
As consequence we can see that:
𝑘1(𝑡) =
{︃𝑁1−𝑞(𝑡), 𝑦(𝑡) = 0,2, 𝑁1−𝑞(𝑡)−1, 𝑦(𝑡) = 1, 𝑘2(𝑡) =
{︃𝑁2−𝑜(𝑡)−𝑐(𝑡), 𝑦(𝑡) = 0,1, 𝑁2−𝑜(𝑡)−𝑐(𝑡)−1, 𝑦(𝑡) = 2.
Beside these we have to know if the server is operational or failed. We assume that the random variables involved in the model construction are either exponen- tially or non-exponentially distributed. Due to the non-exponential distributions the determination of stationary distribution of the system is too difficult so we de- cided to use a stochastic simulation using C coding language with GSL stochastic library.
Several previous works were analyzing and investigating the behavior and the performance measure of CRN, authors of [11] have dealt with two reliable servers in which all the inter-event times (arrival, service and retrial) were exponentially distributed.
In papers [8, 12] authors took into consideration that the servers are subject to breakdowns. In these works all the inter-event times including the failure and repair times were exponentially distributed. Same authors of papers [8, 12] have investigated further the CRN with breakdowns, in paper [9] the failure and repair time of the servers are non-exponential distributed (Hypo-exponentially and Hyper- exponentially).
In the present work we add Gamma, Pareto and Log-normal distributions to the Hypo-Exponential and Hyper-Exponential for the failure and repair times and we provide different parameters for these distributions, in order to investigate and show the impact of the distributions and their parameters on the behavior of the system.
Parameters Value at moment 𝑡 Maximum Value
Primary sources 𝑘1(𝑡) N1
Secondary Sources 𝑘2(𝑡) N2
Primary arrival rate 𝜆1
Secondary arrival rate 𝜆2
Number of requests at the queue (FIFO) 𝑞(𝑡) N1-1
Number of requests at the orbit 𝑜(𝑡) N2-1
Primary service rate 𝜇1
Secondary service rate 𝜇2
Failure rate of the primary server 𝛾1
Failure rate of the secondary server 𝛾2
Repair rate of the primary server 𝜎1
Repair rate of the secondary server 𝜎2
Table 1: Parameters of the simulation
The set of parameters used in the simulation are shown in Table 1. Table 1 presents all the values needed for the simulation and their maximums (if exists), we can see that the primary number of sources is 𝑘1 at moment 𝑡, however the Maximum number for this values is 𝑁1, similarly for the second server has 𝑘2 a number of sources and 𝑁2 is the max number of secondary sources. As the Maximum number of primary sources in the system is 𝑁1, the Maximum of the requests in the queue will be 𝑁1−1 since the server deals with one user in the same time, likewise for the orbit the maximum number of requests at the orbit will be 𝑁2−1.
3. Simulation Results
We used the batch-mean method to estimate the mean response times of each request. This method is one of the most common confidence interval techniques which is used for steady-state simulation output analysis. See for example [1, 7, 12].This method aims to obtain a series of independent samples(batches) by accu- mulating a number of contiguous observations of the simulation in order to produce point and interval estimators. Each batch size needs to be enough large so that the sample averages will not be highly correlated. Then we take the average of the data points in each batch in order to get the final mean or variance.
A confidence interval for the mentioned above technique can be obtained using the corresponding theorem as can be seen in [5].
The distribution’s confidence intervals are displayed in Table 2.
̂︀
𝜇𝑁 ±𝑡𝑁,1−𝛽
2
√𝑆
𝑁 with confidence level 1−𝛽.
• ̂︀𝜇𝑁: Estimator for the mean response time
• 𝑁: Number of Batches
• 𝑡𝑁,1−𝛽
2: The1−𝛽2 critical value of the Student t distribution with𝑁 degrees of freedom
• 𝑆: Sample standard deviation.
Using our simulation program we could display different figures for several case combinations in which we focused on the effect of the distribution of the failure and repair times on the mean response time of secondary users using different distributions.
Both Figure 2 and 3 show the mean response time of secondary users in function of the primary repair intensity𝜎1 using different distributions (Hypo-Exponential, Hyper-Exponential, Gamma, Pareto and Log-normal) for the primary operating time, knowing that the Exponential distribution was used for the rest of the inter- event times (arrival, service, retrial and failure).
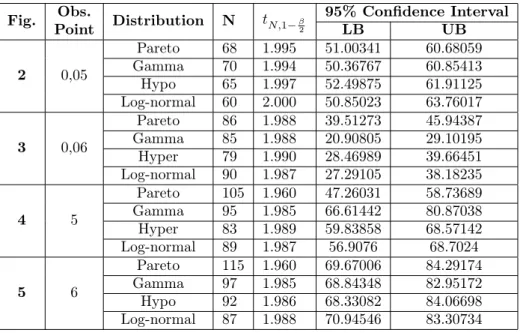
Fig. Obs.
Point Distribution N 𝑡𝑁,1−𝛽
2
95% Confidence Interval
LB UB
2 0,05
Pareto 68 1.995 51.00341 60.68059
Gamma 70 1.994 50.36767 60.85413
Hypo 65 1.997 52.49875 61.91125
Log-normal 60 2.000 50.85023 63.76017
3 0,06
Pareto 86 1.988 39.51273 45.94387
Gamma 85 1.988 20.90805 29.10195
Hyper 79 1.990 28.46989 39.66451
Log-normal 90 1.987 27.29105 38.18235
4 5
Pareto 105 1.960 47.26031 58.73689
Gamma 95 1.985 66.61442 80.87038
Hyper 83 1.989 59.83858 68.57142
Log-normal 89 1.987 56.9076 68.7024
5 6
Pareto 115 1.960 69.67006 84.29174
Gamma 97 1.985 68.84348 82.95172
Hypo 92 1.986 68.33082 84.06698
Log-normal 87 1.988 70.94546 83.30734 Table 2: Confidence intervals of the figures
Figure No. 𝑁1 𝑁2 𝜆1 𝜆2 𝜇1 𝜇2 𝜎1 𝜎2 𝛾1 𝛾2
Figure 2,3 6 10 0.6 0.1 1.5 1 x-axis 0.5 5 4 Figure 4,5 6 10 0.6 0.1 1.5 1 0.5 0.5 5 x-axis
Table 3: Numerical values of model parameters
Distribution Hyper Hypo Gamma Pareto Lognormal Figure 2,5
Mean N/A 0.2 0.2 0.2 0.2
Variance N/A 0.03 0.03 0.03 0.03
Parameters N/A 𝜆1= 0.0292 𝛼= 1.333 𝛼= 2.5275 m=-1.889 𝜆2= 0.1707 𝛽= 6.667 k=0.6043 𝜎= 0.74807 Figure 3,4
Mean 0.2 N/A 0.2 0.2 0.2
Variance 0.4 N/A 0.4 0.4 0.4
Parameters 𝜆1= 0.2
N/A 𝛼= 0.1 𝛼= 2.04880 m=-1.657 𝜆2= 0.632 𝛽= 0.5 k=0.51191 𝜎= 1.5485
Table 4: Values of the distribution parameters
As expected the mean response time of the users decreases with the increment of the repair intensity. In Figure 2 we can observe the insensitivity of the distribu- tions where the squared coefficient of variation was less than one, as the difference between the distributions was almost negligible. However, the difference between distributions is very significant in Figure 3 as the squared coefficient of variation is greater than one.
The last two results are related to the effect of the failure intensity for the
Figure 2: The effect of the Primary repair intensity on the mean response time of the Secondary Users
Figure 3: The effect of the Primary repair intensity on the mean response time of the Secondary Users
secondary server𝛾2versus the mean response time of secondary users. It should be noted that in all the figures we assumed that both Primary and Secondary servers of our network are non-reliable.
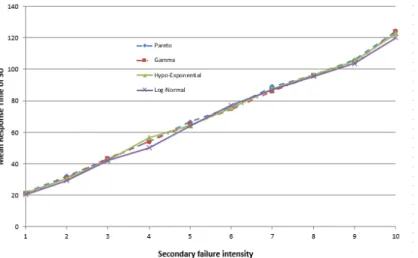
Figure 4 shows the mean response time of SU in function with the secondary failure intensity, knowing that all the means and variances of the different distri- butions were equals and their squared coefficient of variation was greater than one as shown in Table 3.
Figure 4: The effect of the Secondary failure intensity on the mean response time of the Secondary Users
Figure 5: The effect of the Secondary failure intensity on the mean response time of the Secondary Users
Even though the mean and the variance of the distributions were equals, a sig- nificant difference can be seen between the values of mean response time of the SUs, mainly for Gamma and Pareto distribution. The effect of the used distributions can be obviously observed in this figure and it shows sensitivity to the involved distributions.
In Figure 5 where the squared coefficient of variation was less than one we
can see how the the mean response time of the secondary users increases with the increment of the failure intensity. By examining closely the figure no effect can be seen regardless of the different distributions. Furthermore, all the values of mean response time were nearly similar which means insensitivity to the type of distributions.
4. Conclusion
In this paper a finite-source retrial queuing system is presented with a non-reliable server in each subsystem. We showed the effect of several distributions concerning the failure and repair times of the servers on the mean response time of secondary users. A significant effect of these distributions was seen when the squared co- efficient of variation was greater than one having the same mean and variance, however the impact was almost negligible when it was less than one. Lastly, as future works we would like deal with more distributions, in order to investigate further their influence on the cognitive radio networks.
Acknowledgments. The authors are very grateful to the reviewers for their valu- able comments and suggestions which improved the quality and the presentation of the paper.
References
[1] E. Carlstein,D. Goldsman:The use of subseries values for estimating the variance of a general statistic from a stationary sequence, Ann. Stat. 14 (1986), pp. 1171–1179,
doi:https://doi.org/10.1214/aos/1176350057.
[2] N. Devroye,M. Vu,V. Tarock:Cognitive radio networks, IEEE Signal Process. Mag. 25 (2008), pp. 12–23,
doi:https://doi.org/10.1109/MSP.2008.929286.
[3] S. Gunawardena,W. Zhuang:Modeling and Analysis of Voice and Data in Cognitive Radio Networks, Berlin 2191–5768: Springer, 2014,
doi:https://doi.org/10.1007/978-3-319-04645-7.
[4] C. Henk,A. Tijms:First Course in Stochastic Models, Jhon Wiley and sons LTD, 0–471–
49880–7, 2003,
doi:https://doi.org/10.1002/047001363X.
[5] E. Jack Chen, W. David Kelton: A Procedure for Generating Batch-Means Confi- dence Intervals for Simulation: Checking Independence and Normality, SIMULATION 83.10 (2007), pp. 683–94,
doi:https://doi.org/10.1177/0037549707086039.
[6] A. Kuki,T. Berczes,B. Almasi,J. Sztrik:Heterogeneous finite-source retrial queues with server subject to breakdowns and repairs, J. Math. Sci. 132.2006, pp. 677–685, doi:https://doi.org/10.1007/s10958-006-0014-0.
[7] A. Law,W. Kelton:Simulation Modeling and Analysis, 2nd edn.New York: McGrawHill College, 1991.
[8] H. Nemouchi,J. Sztrik:Performance evaluation of finite-source cognitive radio networks with collision using simulation, IEEE Inter. Conf. on Cognitive Infocommuni. 49 (2018), pp. 109–122,
doi:https://doi.org/10.33039/ami.2018.12.001.
[9] H. Nemouchi, J. Sztrik: Performance simulation of finite source cognitive radio with servers subjects to breakdowns and repairs, Journal of Mathematical Sciences 37 (2019), pp. 1072–3374.
[10] F. Paluncic, A. Alfa, B. Mahraj,H. Simba: Queueing Models for Cognitive Radio Networks: A survey, IEE Access 6 (2018), pp. 10–1109,
doi:https://doi.org/10.1109/ACCESS.2018.2867034.
[11] J. Sztrik,T. Berczes,B. Almasi,A. Kuki,J. Wang:Performance modeling of finite- source cognitive radio networks, J. Acta Cybern. 22.3 (2016), pp. 617–631,
doi:https://doi.org/10.14232/actacyb.22.3.2016.5.
[12] J. Sztrik,T. Berczes,H. Nemouchi,A. Z. Melikov:Performance modeling of finite- source cognitive radio networks using simulation, Com. Comput. Inform. Sci. 678 (2016), pp. 64–73,
doi:https://doi.org/10.1007/978-3-319-51917-3_7.
[13] T. Van Do,H. Nam,A. Horvath,W. Jinting:Modelling opportunistic spectrum renting in mobile cellular networks, Journal of Network and Computer Applications Elsevier 52 (2015), pp. 129–138,
doi:https://doi.org/10.1016/j.jnca.2015.02.007.
[14] E. Wong,C. Foch,F. Adachi:Analysis of cognitive radio spectrum desicion for cognitive radio networks, IEEE J. Select. Areas Common. 29 (2011), pp. 757–769,
doi:https://doi.org/10.1109/JSAC.2011.110408.
[15] M. H. Zaghouani,J. Sztrik,A. Z. Melikov:Reliability Analysis of Cognitive Radio Networks, (IDT) (pp. 557–562). IEEE (2019),
doi:https://doi.org/10.1109/DT.2019.8813383.
[16] Y. Zhao,L. Bai:Performance Analysis and Optimization for Cognitive Radio Networks with Classified Secondary Users and Impatient Packets, Mobile Information Systems, Hin- dawi (2017), Article ID 3613496,
doi:https://doi.org/10.1155/2017/3613496.