Analysis of Kinetic Flow Cytometry Measurements
PhD thesis
Ambrus Kaposi MD
Semmelweis University Doctoral School of Clinical Medicine
Supervisor: Barna Vásárhelyi MD, PhD, DSc
Opponents: Lacza Zsombor MD, PhD
György Nagy MD, PhD Chairman of Examination Committee: László Smeller PhD, DSc Members of Examination Committee: János Matkó PhD, DSc
György Ferenczy PhD
Budapest 2013
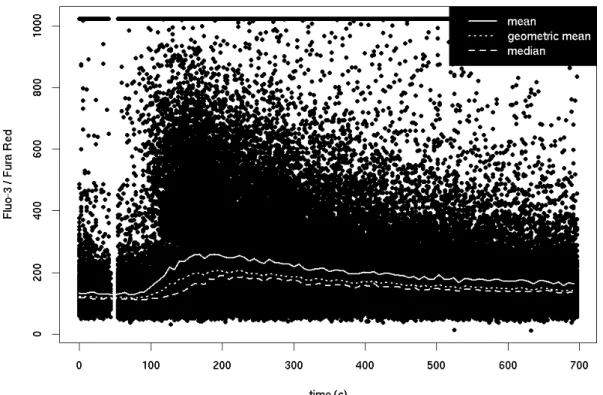
Figure 1: Demonstration of different methods for calculating “average” values on a Flow Cytometry measurement. Each dot on the plot corresponds to an individual cell. The mea- surement time frame was divided into 100 time-intervals of the same length and the mean (continuous curve), geometric mean (dotted curve) and median (dashed line) has been determined in each interval. The measurement was carried out on human PBMC cells, CD4+ lymphocytes were selected during the gating procedure. During measurement, first a 1 minute baseline was recorded, then PHA (phytohemagglutinin) was added to the sam- ple and recording was stopped after additional 11 minutes.
1 Introduction
Flow Cytometry is a technology capable of detecting light absorption and fluorescence properties of large amount of cells. It’s main strength is giving information about cells in an individual way providing data not only about properties of the average cell contained in the sample but also about the distribution of those properties among all cells. This allows the identification of sub-populations of cells. Flow cytometry has been used for the assessment of different cell subsets’ prevalence for decades in medical diagnostics and research. However, the development of specific dyes sensitive for quickly changing intracellular analytes provided an opportunity for the real-time monitoring of intracellular processes with flow cytometry. The topic of this work is the analysis of such, so called kinetic measurements.
In order to compare flow cytometric measurements, one has to calculate numerical attributes from measurement parameters such as the number of cells with a parameter lower than a given value, mean or median of a parameter, bin counts calculated by the Probability Binning method etc. In the case of kinetic measurements one of the measured parameter’s distribution depends on time (kinetic parameter). The common method for calculating numerical attributes from such a measurement is first smoothing the measure- ment along time using moving average, moving median or other averaging method (Figure 1), then reading different parameters from the smoothed curve such as maximum, time to reach maximum, slope etc. The exact values of these parameters depend on the properties of the smoothing method used and the exact definition of the parameters. Because of this parameters obtained from measurements recorded or analyzed under different conditions cannot be compared objectively.
2 Aims
We aimed to develop an algorithm for the description and comparison of kinetic Flow Cytometry measurements which has the following properties:
1. Gives objective numeric value providing the opportunity of statistical comparison.
2. Does not depend on ad-hoc user-defined setting and gives reproducible results.
3. Is able to quantify different aspects of the kinetic process (maximum, speed of response).
4. Is able to describe the kinetics of Calcium flux measurements but is robust enough to describe other kinetic processes having similar complexity.
5. Can be implemented effectively and used in research.
3 Methods
Smoothing methods are suitable for displaying data, carrying out explorative data analy- sis and for establishing hypotheses but are not capable of verifying hypotheses. By using mathematical models our hypotheses about the kinetic process become explicit and hence verifiable. Models correspond to functions: the main idea of our method was to fit func- tions to measurement data and describe measurements by the parameters of the fitted function. We implemented the methods below in R and Java programming languages.
3.1 Substitution
The measurements were divided into 100 time-intervals of equal length and 201 quantiles were calculated in each interval. Fitting was performed over this modified data set.
3.2 Fitting functions
We fitted the functions corresponding to empirical models:
• Logistic function:
logist(t;b, c, d, e) = c+ d−c 1 + etb
• Hormesis function (hormesis is a property of certain dose-response curves having opposite reactions on low than on high doses; we also used a modified version of this function):
hormesis(t;b, c, d, e, f) =c+d−c+f ∗exp t−10,25
1 + teb
• Constant function:
constant(t;y) = y
Parameter constraint:y≥0
• Positive logistic function (this function starts at a giveny0value, it’s value increases continuously until it reaches a giveny2value in infinity):
logist+(t;y0, y2, x1, m1) = y0 + (y2−y0) 1 +exp4∗m1∗(−t+x1)
y2−y0
Parameter constraints:y0, y2, x1, m1≥0andy0< y2
• Negative logistic function (this function starts at a given y0 value, it’s value de- creases continuously until it reaches a given y2 value in infinity): it’s formula is similar to that of the positive logistic function.
• Positive double logistic function (this function starts at a giveny0value, it’s value increases continuously until it reaches a maximum (y1) atx1, then decreases until it reaches a giveny2value in infinity):
dlogist+(t;y0, y1, y2, x1, xd0, xd2, m0, m2) =
=
y0 + y1−y0
1+(x1−txd0 )4∗xd0∗m0y1−y0 ift < x1
y2 + y1−y2
1+(t−x1xd2 )4∗xd2∗m2y2−y1 ift ≥x1
Parameter constraints:y0, y1, y2, m0, x1, xd0, xd2≥0,m2≤0, xd0≤x1,y1> y0,y1> y2
• Negative double logistic function (this function starts at a giveny0value, it’s value decreases continuously until it reaches a minimum (y1) atx1, then increases until it reaches a giveny2value in infinity): it’s formula is similar to that of the positive double logistic function.
We used the following iterative methods for fitting the above functions:
• Newton-method: capable of minimizing arbitrary functions, the second derivatives of the function are necessary.
• Gauss-Newton method: minimizes SSD (Sum of Squared Deviation).
• robust version of the Gauss Newton method (Iterated Reweighted Least Squares, IWLS): minimizes SSD.
• BFGS method: a quasi-Newton method, uses function values and gradients, imple- mented for quantile regression.
• Nelder-Mead method: simplex algorithm for the minimization of any function.
• SANN (Simulated ANNealing) method as implemented in R.
We fitted more than one function to a measurement and to decide which is the best fitting function we used SSD and SAD (Sum of Absolute Deviation) values and 10-fold Cross Validation.
3.3 Standardization
In order to be able to compare measurements recorded under various conditions we used standardization: the horizontal standardization (which is actually an offset along the time axis) was performed by the careful selection of parameters, while vertical stan- dardization was performed by dividing all parameters which have a vertical component (y, y0, y1, y2, m0andm2) by one of the following values:
• the starting value of the function: hence the starting value of the new function will be exactly 1.
• the median value of the initial segment of the measurement. If a separate baseline measurement was performed we used the median calculated from that. In this case the starting value of the function can be different from 1, the function will have value of 1 at the beginning of the measurement (at time point 0).
3.4 Generating distributions of parameters
We define median method as fitting only to the middle of the measurement, that is, to the medians in each time interval. This way, after selecting the best fitting function, the anal- ysis results in one value for each parameter of the function: we characterize the average (middle, median) cells. In order to describe the whole measurement range we used the following methods to generate parameter distributions:
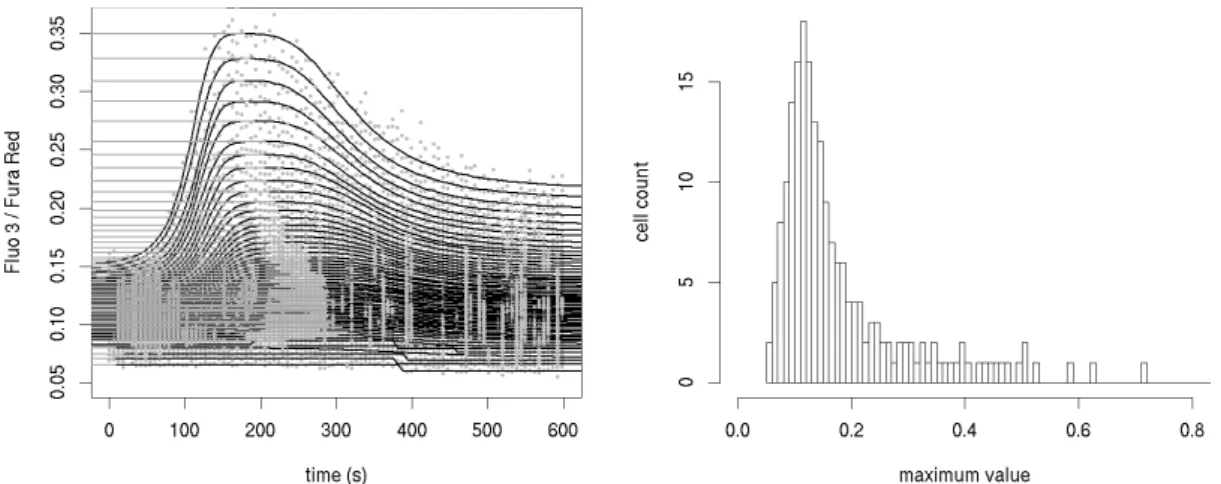
Figure 2: The quantile method: fitting double logistic function to different quantiles of a Calcium flux measurement (left side: the grey dots correspond to the quantile values, the grey lines are the maximum values of each fitted function) and determining the distribu- tion of the maximum parameter (right side).
• Distribution of median: using bootstrap method we obtain the distributions for each median parameter.
• Quantile method: we fit functions to each of the 201 quantiles; assuming that the kinetic processes are going parallel in each cell, we obtain the full distribution of each parameter (Figure 2).
• “Reticular” fitting: we fit functions to the whole measurement at the same time by describing the quantile-dependence of parameters by new meta-functions. While the quantile method fits a model described by an 8-parameter function with essen- tially8∗201 = 1608parameters, if we are able to describe to quantile-dependence of each parameter with a 2-parameter function, we can use a much more robust, 2∗8 = 16 parameter model. We used first, second and third degree polynomials and modified normal distribution quantile function as metafunction.
4 Results
4.1 Substitution
Fitting to the data set obtained after substitution is much more efficient as fitting to the original measurement data set possibly containing millions of values. Assuming uniform distribution of cells along time fitting to both data sets result in the same parameters. The degrees of freedom important from the statistical point of view does not come from the individual measurements but from the measurement count in each measurement group, the decrease of the degrees of freedom does not cause trouble.
4.2 Fitting functions
The parameters of the logistic and hormesis function are hard to estimate and not straight- forward to interpret biologically. The hormesis function is shiftable along the horizontal axis, however by setting one of it’s parameters to 0, it transforms into the simpler, logis- tic function. Because we evaluate the goodness of fit by cross validation (see below), we wouldn’t use this advantage. The function set consisting of the constant, positive and neg- ative logistic and positive and negative double logistic functions was found to be able to describe any measurement having a constant, increasing or decreasing (one inflection) or first increasing then decreasing or first decreasing then increasing (two inflections) kinetic process.
The algorithm converging the most times was found to be a combination of the Nelder- Mead and SANN algorithms using many different starting estimations. We found that the best method of selecting the best fitting function is using 10-fold Cross Validation which prevents overfit which happens frequently when using such a multiparameter model. This method provides a numeric value for each function, and the less the value the better the fit.
4.3 Standardization
If the model (and the corresponding function) does not fit the measurement, standardizing by the fitted function inserts an additional error into the data set, this is why perform standardization according to the initial part of the measurement.
4.4 Generating distributions of parameters
We were able to use the maximum, time to reach maximum, slope at 50% value and AUC parameters of the median function to describe the change of T-lymphocyte activation in
different diseases (type 1 diabetes, SM, Preeclampsia, RA) and conditions (newborns, specific inhibition of certain Potassium and Calcium channels). The median method can be viewed as a straightforward enhancement of the commonly used smoothing methods.
This method, according to our aims has the following properties:
1. calculates objective numeric values from the measurements namely the parameters of the fitted function which can be used for statistical comparison. To compare different measurements one has to use the same model.
2. apart from the measurement data it does not depend on other settings and gives reproducible results: analyzing the same measurement 40 times the parameters of the double logistic functions were in 36 cases the same in their first 3 decimals, in 4 cases there was hardly any difference in the parameters that could be estimated from the measurement time frame.
3. by providing a Cross Validation value it is able to determine the best fitting model hence group measurements by their kinetic character and characterizes measure- ments according to different aspects of the kinetic process by different parameters 4. it is suitable to describe Calcium flux and other kinetic Flow Cytometry measure-
ments: we fitted the function set comprising of 5 functions to the median values of 1846 measurements (the majority of which were Calcium flux measurements) and determined the best fitting function by Cross Validation. Out of these we observed that in 2 cases (0.07%) the function did not converge to the minimum, in 68 (3.68
%) cases the measurements displayed such a kinetic process which neither func- tion was able to describe. Our method was applicable to describe the kinetics of mitochondrial Calcium levels, ROS production and plasma membrane potential.
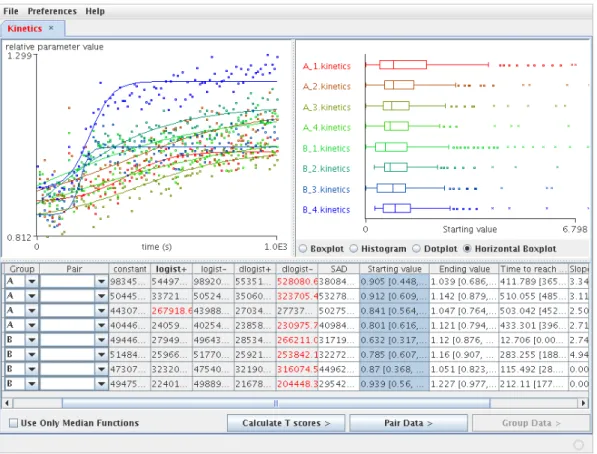
5. Together with the quantile method we implemented the median method in a user friendly computer program named FacsKin (Figure 3). We made the software avail- able to the scientific community on the http://www.facskin.comURL. 76 researchers registered on the website and between 27 January 2011 and 26 Septem- ber 2012 they performed the analysis of 1846 measurements with our method. Us- ing out algorithm Toldi et al investigated the changes in lymphocyte Calcium flux in neonate, Type 1 Diabetes, Preeclampsia, Sclerosis Multiplex and in Rheumatoid Arthritis. Toldi et al provided information about the differences in Calcium kinetics between the Th1 and Th2 lymphocyte sub populations of healthy individuals using out program.
We found that the bootstrap parameter distributions are useful for determining relia- bility of the parameters. The quantile method is able to describe the whole measurement
range with functions but gives different results as the median method. The “reticular” fit- ting method decreases the deviation of the parameters artificially, hence we found that it is not capable to describe kinetic measurements in it’s current form.
Figure 3: User interface of FacsKin version 0.6.4. 8 measurements are open, 4 of which classified as A and the 4 others classified as B. The kinetic modellogist+(positive lo- gistic function) is selected and the parameter distributions given by the quantile method are displayed as median [quartiles]. One row corresponds to one measurement and one column (right from the column titled SAD) corresponds to one parameters. The “starting value” parameter is selected and it’s distribution is plotted in the right upper corner with box and whisker’s diagrams. The upper left corner shows the median values and the func- tions fitted to them for each measurement. The measurement was carried out on human PBMC cells, CD4+ lymphocytes were selected during the gating procedure.
5 Conclusions
1. We developed a set of functions which is able to describe the majority of kinetic Flow Cytometry measurements. Each function corresponds to a kinetic model: the constant function corresponds to the lack of kinetic process, the positive logistic function corresponds to processes starting from a given value, increasing and reach- ing a given value, the negative logistic function describes the inverse of this process, the positive double logistic function describes a combined positive and negative lo- gistic process, while the negative double logistic function describes the inverse of a process corresponding to the positive double logistic function.
2. Our algorithm is able to select the best fitting kinetic function by 10-fold Cross Val- idation, hence qualitatively grouping measurements. To quantify the predictability of each parameter we use relative standard deviations.
3. Different parameters of a fitted function describe different aspects of the kinetic process corresponding to distinct biological meaning: the maximum parameter de- scribes the size of the kinetic reaction, the time to reach parameter gives it’s speed, the distances of the 50% values from the maximum give the speed of the increas- ing and decreasing phase, while the slope values describe it’s suddenness. From the starting and ending values one can deduce the level of the kinetic parameter before and after measurement. The AUC parameter gives the summated size of the kinetic process, e.g. in the case of Calcium flux it is proportional to the time that Calcium ions spent in the cytoplasm during measurement.
4. On the basis of different parameters we are able to compare different aspects of the measurements thus refining the summated differences such as that given by the AUC parameter. This allows us to detect differences that are not visible when doing rough, summated comparisons.
5. Our method was used in several cases to analyze Calcium flux data and draw bio- logical conclusions. In the last 3 years 6 publications using our program appeared in international journals.
6. The algorithm implementing our method is available to the scientific community on thehttp://www.facskin.comwebsite in the form of a user friendly program.
The program is capable of manually gating measurements, fitting functions, giving the parameters of the fitted functions, grouping and comparing measurements based on these parameters.
7. The not yet validated so called quantile method is capable of describing not only the middle (median) of the measurements but it’s whole range.
6 List of publications
6.1 Publications related to the thesis
Cumulative impact factor:17,351, as a first author:3,729.
• International publications:
1. Kaposi A, Veress G, Vasarhelyi B, Macardle P, Bailey S, Tulassay T, Treszl A. (2008) Cytometry-acquired calcium-flux data analysis in activated lympho- cytes. Cytometry Part A, 73A: 246-53. IF:3,729
2. Toldi G, Vásárhelyi B,Kaposi A, Mészáros G, Pánczél P, Hosszufalusi N, Tu- lassay T, Treszl A. (2010) Lymphocyte activation in type 1 diabetes mellitus:
The increased significance of Kv1.3 potassium channels. Immunol Lett, 133:
35-41. IF:2,526
3. Toldi G, Folyovich A, Simon Z, Zsiga K,Kaposi A, Mészáros G, Tulassay T, Vásárhelyi B. (2011) Lymphocyte calcium influx kinetics in multiple sclerosis treated without or with interferon beta. J Neuroimmunol, 237: 80-86. IF:2,959 4. Mészáros G, Szalay B, Toldi G,Kaposi A, Vásárhelyi B, Treszl A. (2012) Ki- netic Kinetic Measurements Using Flow Cytometry: New Methods for Moni- toring Intracellular Processes. ASSAY and Drug Development Technologies, 10: 97-104. IF:1,727
5. Toldi G,Kaposi A, Zsembery Á, Treszl A, Tulassay T, Vásárhelyi B. (2012) Human Th1 and Th2 Lymphocytes are Distinguished by Calcium Flux Regu- lation During the First Ten Minutes of Lymphocyte Activation. Immunobiol- ogy, 217: 37-43. IF:3,205
6. Toldi G, Bajnok A, Dobi D, Kaposi A, Kovács L, Vásárhelyi B, Balog A.
(2012) The effects of Kv1.3 and IKCa1 potassium channel inhibition on cal- cium influx of human peripheral T lymphocytes in rheumatoid arthritis. Im- munobiology, 218: 311-6. IF:3,205
• Book chapter:
7. Kaposi A, Toldi G, Mészáros G, Szalay B, Veress G, Vásárhelyi B. Experi- mental conditions and mathematical analysis of kinetic measurements using flow cytometry - the FacsKin method. In: Flow Cytometry/Book 1. Schmid I (ed.). Intech, 2012. ISBN 979-953-307-355-1.
• Hungarian publication:
8. Mészáros G, Rónai K, Toldi G,Kaposi A, Vásárhelyi B, Treszl A. (2008) Se- jtélettani folyamatok jellemzése „real-time” áramlási citometriás módszerrel.
Magyar Immunológia, 7: 22-29.
6.2 Publications not related to the thesis
Cumulative impact factor:3,705, as a first author: 0.
• International publications:
9. Treszl A, Kaposi A, Hajdú J, Szabó M, Tulassay T, Vásárhelyi B. (2007) The Extent to Which Genotype Information May Add to the Prediction of Disturbed Perinatal Adaptation: None, Minor, or Major? Pediatr Res, 62: 610- 4. IF:2,7
10. Gombos P, Langer RM, Korbely R, Varga M,Kaposi A, Dinya E, and Müller V. (2010) Smoking Following Renal Transplantation in Hungary and Its Possi- ble Deleterious Effect on Renal Graft Function. Transplantation Proceedings, 42: 2357–2359. IF:1,005
• Book chapter:
11. Mihalik A, Kaposi A, Kovacs IA, Nanasi T, Palotai R, Rak A, Szalay MS, Csermely P. How creative elements help the recovery of networks after crisis:
lessons from biology. Networks in Social Policy Problems. B Vedres and M Scotti (ed.). Cambridge University Press, Cambridge, 2011.
• Hungarian publication:
12. Lantos B, Riesz P, Gulácsi A, Keszthelyi A, Sz˝ucs M, Kaposi A, Romics I.
(2009) Hólyagrák-diagnosztikai program klinikai felhasználása. Uroonkoló- gia, 6: 51-56.
Acknowledgments
I joined the Research Group of Pediatrics and Nephrology at the First Department of Pe- diatrics as a third year student researcher in 2006. Without the professional and friendly research and social environment I experienced here I wouldn’t have been able even to finish the medical university. I am most grateful to my advisor, Professor Barna Vásárhe- lyi who created this environment, encouraged and was always available. I would like to thank Professor Tivadar Tulassay for his personal encouragement. I have learned a lot about medical statistics from Andra Treszl. My fellow students, Gergely Toldi, Gerg˝o Mészáros and Balázs Szalay were the main users of the FacsKin program. They helped the development of the program with their comments, questions and demands about the software. They gave the motivation to improve the program and were also responsible for the nice atmosphere of the Laboratory.
I would like to thank mathematician Gábor Veress, under the professional control of whom I developed the algorithm. He was able to come up with a new, interesting idea that helped us step forward in every time we discussed the algorithm.
I express my gratitude to Elek Dinya who taught me the basics of medical statistics and supplied me with never ending tasks related to statistics.
I thank Gergely Éliás, Péter Diviánszky and Ádám Egri for their invaluable comments on the FacsKin software and also all the users of the program.
Finally, I thank all volunteers and patients who helped carrying out the experiments by providing blood samples.