Ecology Letters, (2018) 21: 1390–1400 doi: 10.1111/ele.13109
Resisting annihilation: relationships between functional trait dissimilarity, assemblage competitive power and allelopathy
Rika M. W. Muhl,1 Daniel L.
Roelke,1,2* Tamar Zohary,3 Maria Moustaka-Gouni,4 Ulrich Sommer,5 G'abor Borics,6,7 Ursula Gaedke,8
Frances G. Withrow,1 and Joydeb Bhattacharyya1
Abstract
Allelopathic species can alter biodiversity. Using simulated assemblages that are characterised by neutrality, lumpy coexistence and intransitivity, we explore relationships between within-assem- blage competitive dissimilarities and resistance to allelopathic species. An emergent behaviour from our models is that assemblages are more resistant to allelopathy when members strongly compete exploitatively (high competitive power). We found that neutral assemblages were the most vulnera- ble to allelopathic species, followed by lumpy and then by intransitive assemblages. We find sup- port for our modeling in real-world time-series data from eight lakes of varied morphometry and trophic state. Our analysis of this data shows that a lake’s history of allelopathic phytoplankton species biovolume density and dominance is related to the number of species clusters occurring in the plankton assemblages of those lakes, an emergent trend similar to that of our modeling. We suggest that an assemblage’s competitive power determines its allelopathy resistance.
Keywords
Allelopathy, exploitative competition, interference competition, intransitivity, lumpy coexistence, neutrality, species supersaturated assemblages.
Ecology Letters (2018) 21: 1390–1400
INTR ODUC TION
Superior competitors exploit resources better than inferior competitors (Tilman 1977, 1982; Keddy 1989). Yet, species that are poor exploiters may persist by employing interference strategies to gain access to resources (Case & Gilpin 1974). In phytoplankton, where resources are commonly nutrients, an active behaviour to enhance nutrient acquisition employed by some species is allelopathy (Smayda 1997; Legrand et al.
2003; Thornton 2014), a process where exuded chemicals of a species negatively affect the fitness of competing species of the same trophic level (Legrand et al. 2003; Hattenrath-Lehmann
& Gobler 2011). Negative effects could involve lysis, and sub- sequent phagotrophy of cell fragments by the allelopathic spe- cies or uptake of liberated cellular compounds through osmotrophy, or the allelopathic species might simply benefit from microbial regeneration of nutrients from lysed cells that then become available for reuse (Uronen et al. 2007). Note, for our purposes ‘allelopathy’ is different from ‘toxicity’ (see Supporting Information).
While the prima facie cornerstone of allelopathic ecological understanding is that allelopathy facilitates bloom formation by reducing competitor density and subsequently increasing nutrient availability (Lewis 1986; Smayda 1997; Fistarol et al.
2003; Legrand et al. 2003; Jonsson et al. 2009), experimental and field observations of exuded chemical impacts within phy- toplankton assemblages reveal a wide spectrum of effects (Hattenrath-Lehmann & Gobler 2011). For example, pairwise interactions of species exposed to exudate of the dinoflagellate Karenia brevis reveal differential effects among assemblage members (Poulson et al. 2010). Similarly, stimulatory effects of exudates to other phytoplankters have been observed with cyanobacteria and dinoflagellates that otherwise are consid- ered allelopathic groups (Suikkanen et al. 2005; Poulson et al.
2010; Neisch et al. 2012). Succession during some allelopathic blooms is complex, with observed co-dominance of species (Lindholm et al. 1999; Redalje et al. 2008) and persistence of multiple sub-dominant species (West et al. 1996; de Figueir- edo et al. 2006). This variation of exuded chemical effects spotlights our limited understanding of allelopathic function- ing in ecosystems.
Further understanding of allelopathic functioning in plank- ton systems may arise from insights into phytoplankton assemblage structure, and how this structure relates to the degree of exploitative competition occurring within assem- blages, which we now refer to as the ‘competitive power’ of the assemblage. For our purposes here, ‘structure’ refers to the competitive abilities of assemblage members to exploit
1Department of Wildlife and Fisheries Sciences, Texas A&M University, College Station, TX 77843-2258, USA
2Department of Oceanography, Texas A&M University, College Station, TX 77843, USA
3Kinneret Limnological Laboratory, P.O.B. 447, Migdal 14950, Israel
4School of Biology, Aristotle University of Thessaloniki, GR-541 24, Thessaloniki, Greece
5GEOMAR, Helmholtz-Zentrum fu€r Ozeanforschung Kiel, Experimentelle O€ kologie I (Nahrungsnetze), Du€sternbrooker Weg 20, D-24105 Kiel, Germany
6Department of Tisza Research, MTA Centre for Ecological Research, 18/c, Bem square, Debrecen 4026, Hungary
7MTA Centre for Ecological Research, GINOP Sustainable Ecosystems Group, 3.
Klebelsberg Kuno str., H-8237 Tihany, Hungary
8Institute of Biochemistry and Biology, University of Potsdam, Maulbeerallee 2, D-14469 Potsdam, Germany
*Correspondence: E-mail: droelke@tamu.edu
Population density (106 cells liter–1) resources relative to each other, which is typically depicted by the distribution of R* values through the resource trade-off space (sensu Tilman, discussed further below). In theory, this type of structure characterisation is related to biodiversity, succession dynamics, productivity and stability (Tilman 2004;
Chase & Leibold 2014). Here, we explore whether assemblage structure influences allelopathy efficacy with a focus on assem- blages whose structure derives from generalised ecological concepts relating to competition, which are neutrality, lumpy coexistence and intransitivity (see Supporting Information).
As mentioned before, effects of allelopathy on phytoplank- ton are diverse, and our limited understanding of underpin- ning mechanisms might be, in part, a function of our lack of knowledge of distinctive assemblage structures occurring in natural environments. Researchers acknowledge that method- ologies for study of sensitivities of individual phytoplankton species to allelopathic compounds overlook assemblage dynamics (Kubanek et al. 2005), and experiments exploring allelopathic influence on natural assemblages do not directly relate allelopathy and assemblage state (Poulson et al. 2010;
Tang & Gobler 2010; Poulson-Ellestad et al. 2014). We address that here by employing mathematical models to explore the interaction of allelochemical production rate and target species sensitivity on diversity in assemblages governed by neutrality, lumpy coexistence and intransitivity. Emergent
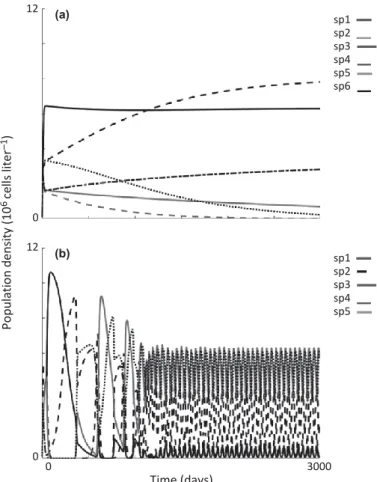
steady-state exceeded the number of limiting resources (Schip- pers et al. 2001). Species supersaturation (ranging between 5 and 8 species co-existing on three resources) was sustained by either neutrality, lumpy coexistence, or intransitivity. A detailed description of the self-organisation process used to generate supersaturated phytoplankton assemblages can be found in Roelke & Eldridge (2008). Population dynamics for these assemblage types in the absence of allelopathy either asymptotically approached a steady state when sustained by either neutrality or lumpy coexistence (Fig. 1a), or showed recurrent and out-of-phase species oscillations when sustained by intransitivity (Fig. 1b).
Conceptual framework
Competitive abilities of species in each assemblage type are demonstrated with a three-dimensional resource trade-off space using the R* for each species for each of the three resources (see Roelke & Eldridge 2008). The distribution of species’ R*s through the three-dimensional resource trade-off space is used to define the assemblage structure. For example, all species in neutral assemblages show close clustering in the
behaviour of our combined models is then tested using phyto- 12 plankton time-series data from several lakes of varied mor- phometry and trophic state.
METHOD S Mathematical model
We started with a well-known numerical model that depicts multiple phytoplankton species competing for multiple growth-limiting resources (Leon & Tumpson 1975; Tilman 1982; Grover 1997). The model structure and its parameterisa- tion and initialisation follows closely with Roelke & Eldridge (2008) (see Supporting Information). Briefly, the model is dimensionless, employing time-dependent ordinary differential equations. To the phytoplankton equations of this model, we added a factor depicting allelopathy, affecting species that were non-allelochemical producing. We added a differential equation that depicted the concentration of the allelochemi- cals where increases in concentrations came about through production by the allelochemical species and decreases in con- centration were through a fixed rate of decay (Martines et al.
2009). We considered only the effect of one allelopathic spe- cies on multiple non-allelopathic species.
We explored how the structure of phytoplankton assem- blages influenced allelopathy efficacy. We used biodiversity collapse (richness reducing to one, where the sole surviving species was the allelopathic species) to define scenarios under which allelopathy led to blooms. The scenarios explored here
(a)
0 12 (b)
0 0 3000
Time (days)
sp1 sp2 sp3 sp4 sp5 sp6
sp1 sp2 sp3 sp4 sp5
were based on the sensitivity of assemblage members to allelo- chemicals and the rate of allelochemical production. Assem- blages used in these analyses (reported in Roelke & Eldridge 2008), in the absence of allelopathy, were species supersaturated, meaning the number of co-existing species at
Figure 1 Representative simulations of population dynamics without allelopathic effects for neutral and lumpy assemblages (a), and intransitive assemblages (b). Neutral and lumpy assemblages show populations asymptotically approaching steady state, while intransitive assemblages show a period of transient dynamics giving way to an periodically oscillating state.
1392 R. M. W. Muhl et al. Letter
R3 (µM)R3 (µM) R3 (µM)R3 (µM)
(a) (b)
0.35 0.35
0.35 0
R2 (µM)
0 0 R1 (µM) 0.35
0 0.35
R2 (µM)
0 0 R1 (µM) 0.35
(c) (d)
0.35 0.35
0 0.35
R2 (µM)
0 0 R1 (µM) 0.35
0 0.35
R2 (µM)
0 0 R1 (µM)
0.35
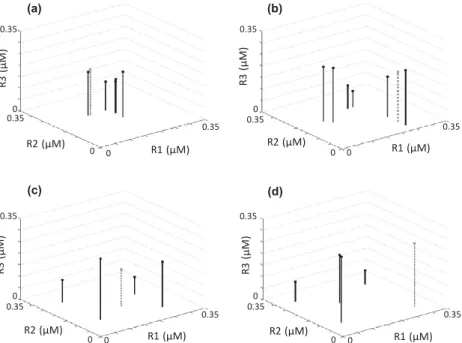
Figure 2 Representative distributions of species’ R*s through the three-dimensional resource trade-off space for neutral (a), lumpy (b) and intransitive (c, d) assemblages. The three resources are designated with R1, R2 and R3. Here, the position of the R*s for the allelopathic species is denoted with a grey dashed line and dot, while non allelopathic species are denoted with a black line and dot. Note that in some simulations employing intransitive assemblages the allelopathic species was centrally located among the other species of the assemblage (c) and for other simulations it was peripherally located (d).
resource trade-off space (Fig. 2a). Species in assemblages characteristic of lumpy coexistence also show close clustering, but with co-occurrence of multiple species clusters (Fig. 2b).
Species in intransitive assemblages were characteristic of a rec- ognizable geometric species distribution with assemblage members being near-equidistant to a centrally located species in the three-dimensional trade-off space (Fig. 2c,d).
Sensitivity analysis of model
We explored the resistance of phytoplankton assemblages to allelopathy by looking at how an allelopathic species influ- ences assemblage diversity over a gradient of allelopathic effect. We varied the allelochemical production rate value (‘ec’ in the equations presented in Supporting Information), and the growth-inhibition coefficient (‘KI’ in the equations pre- sented in Supporting Information), for which low values of KI represented extreme growth-inhibition of the non-allelopathic species, and high values of KI represented less inhibition. This resulted in varying levels of sensitivity to the allelochemical by the non-allelochemical producers. A gradient of 12 values used for ec ranged from 0 to 0.055, which spanned allelochem- ical production rates observed previously for cyanobacteria (Grover et al. 2010). A gradient of 100 values was used for KI, ranging from 0 to 1. During preliminary simulations we observed that values > 1 for the growth inhibition coefficient showed no effect of allelopathy. So those simulations are not reported here.
Each simulation started with all species in the assemblage and ran for 5000 days. For neutral and lumpy assemblages, starting species richness was between six and eight species, whereas for the intransitive assemblages, five species were used. Because the number of species in these assemblage types
varied initially, we analysed the relative diversity instead of diversity (see more below). Using the relative diversity calcula- tions, biodiversity maps showing changes in relative diversity in response to allelopathy were created. These maps displayed the resulting relative diversity of each assemblage at all possi- ble combinations of ec and KI (1212 model simulations for each map).
Assemblage characteristics of interest and emergent behaviour Relative species diversity (Shannon & Weaver 1949), relative assemblage cell density, assemblage resistance and the aver- aged distance of each species from the allelopathic species in the resource trade-off space were determined for the thirty assemblages (i.e. 10 neutral, 10 lumpy and 10 intransitive).
These factors provide a context for ecological study at differ- ent levels of interspecific competition, although assemblage response to allelopathy will involve multiple factors in natural systems.
The assemblage resistance is given by the slopes of the boundary between allelopathic monoculture to a multispecies assemblage in the biodiversity maps (in early explorations of the model we discovered this transition to be abrupt, as we will show in our figures). The slope values were calculated by averaging the changes in ec over the changes in KI along the bloom transition boundary.
One way to characterise the competitive power of resource exploitation between species within an assemblage is through evaluation of the distance between species–specific R* values through the three-dimensional resource trade-off space (Roelke & Spatharis 2015). Here, we take that approach fur- ther by characterising the competitive similarity of the allelo- pathic species to all other members of the assemblage. For
this, the three-dimensional distance between each species and the allelopathic species was calculated using the Pythagorean Theorem and orthogonal triangles. These distances were aver- aged, giving one value for each assemblage. We now refer to this calculation as the allelopathy R* composite distance.
An emergent behaviour of the model is then explored by plotting the allelopathy R* composite distance for each of the assemblages against the resistance of each assemblage to allelopathy. In this way, we were able to explore theoretical relationships between assemblage types (i.e. neutral, lumpy and intransitive) and allelopathy functioning.
Phytoplankton time-series data
For our analysis of plankton time-series, we relied on records collected from several lakes, most of which experienced harm- ful algal blooms at some point in their recent history and the harmful bloom-forming species were known allelochemical producers. The lake data comprised taxa mostly identified to the species level and cellular size information (Table S1). The data did not include information on the same life-history traits used in the numerical modeling that defined species competitive abilities. Instead, competitive abilities within lake assemblages were surmised by us based on the size distribu- tion of phytoplankton species with a specific focus on the inci- dence and number of co-occurring species clusters (explained further below). Insights into mechanisms that link assemblage structure to efficacy of allelopathy were then achieved through comparisons of emergent behaviour of the model and emer- gent behaviour of the assemblages observed in the lakes.
We analysed multiyear time-series data (ranging from weekly to monthly sampling frequency) of phytoplankton composition and biovolume density from eight freshwater lakes. These were Lake Mikri Prespa (2½ years) bordered by Greece and Albania; Lakes Volvi (2 years) and Koronia (1½ years) in Greece; Lake Kinneret (19 years) in Israel;
Lake Constance (15 years) bordered by Switzerland, Austria and Germany; and Lakes Fancsika 1 (19 years), Fancsika 2
(lm3 cell-1). To determine the assemblage cellular size distri- bution for each sampling date, we first log10 transformed cel- lular biovolume values and parsed the transformed data into pre-defined size classes. The pre-defined size classes were based on the largest species from all eight lakes and an opti- mal number of size classes. We identified the number of size classes by exploring multiple pre-defined size classes until a number was found that optimised the tradeoff between num- ber of size classes and the size range over which each size class spanned. This optimisation process resulted in 23 size classes being selected, which spanned the range from the smallest to largest sized taxa found in all eight lakes. Follow- ing this procedure meant that size classes applied to each lake’s assemblages were the same, thus enabling a comparison of assemblages across lakes. We note that the results reported here were robust over a large range of predetermined size classes.
To determine the incidence and number of species clusters occurring within assemblages, we summed the number of spe- cies occurring within each of the 23 size classes at each sam- pling date. The presence or absence of a species was registered once, independent of its biovolume density. In other words, we created size-frequency histograms. We then developed an algorithm to quantify the number of species clusters for each sampling date using a slope criteria applied to the size-fre- quency histograms. The algorithm identified ‘peaks’ in the size-frequency histograms that were only considered as central locations of species clusters if the slope from the preceding minima, or ‘valley’ (moving from smaller size taxa to larger) was ≥ 3, and the slope to the following minima, or the next
‘valley’ (still moving from smaller size taxa to larger) was
≤ -3. In this way, the number of species clusters in the assem- blage was identified for each sampling date from each lake where the minimum number of species comprising a cluster was three.
An emergent behaviour of these lake systems was then explored. For this, we first calculated the average number of species clusters occurring on any given day of sampling in (19 years) and M'ezeshegyi-to' (19 years) in Hungary. The each of the lakes. We plotted this against the biovolume den- lakes vary in morphometry and trophic state. Lakes Con-
stance and Kinneret are of large area and greater depth, while being oligotrophic and mesotrophic to eutrophic, respectively.
Lakes Volvi and Mikri Prespa are of intermediate area and depth, both being eutrophic. Lakes Fancsika 1, Fancsika 2 and M'ezeshegyi-to' are small and shallow, all being eutrophic to hypereutrophic. Lake Koronia is a heavily modified hyper- eutrophic system of large area and shallow depth. Details of the collection methods for the eight lakes, including sampling and microscopy analyses for cellular size measurements can be found in those studies (Gaedke & Schweizer 1993; Gaedke 1998; Borics et al. 2000, 2013; Michaloudi et al. 2009; Zohary et al. 2012; Moustaka-Gouni et al. 2014). Time-series data for Lakes Mikri Prespa, Volvi, Koronia, and Kinneret included temporal variation in species-specific cellular size. Time-series data for Lakes Fancsika 1-es t'arozo', Fancsika 2-es t'arozo',
sity of allelopathic bloom-forming taxa occurring during peri- ods when the summed biovolume densities of allelopathic species reached seasonal peaks. We fitted an exponential regression line through this data. We then calculated the fre- quency of allelochemical-producing species dominance, where we defined ‘dominance’ as a condition where > 80% of the total phytoplankton biovolume was comprised of allelochemi- cal-producing species. We then plotted the average number of species clusters occurring on any given day of sampling in each of the lakes against the lakes’ frequency of allelochemi- cal-producing species dominance. We fitted linear regression lines through this data, the first regression line using data from all eight lakes and the second regression line using only seven of the lakes (Lake Mikri Prespa excluded). We excluded Lake Mikri Prespa from the second regression because of its position as an outlier in this second plot and the known M'ezeshegyi-to'
cellular size.
and Constance employed an averaged extreme weather condition the lake experienced during the time of sampling collection (discussed further below). This Time-series data were processed as species–specific biovol-
ume density (lm3 L-1) and species-specific cellular biovolume procedure enabled exploration of relationships between assem- blage structure (here, the average number of species clusters)
1394 R. M. W. Muhl et al. Letter
Relative diversity
Allelochemical production coefficient (εc, µg cell–1)
and allelopathy functioning (the magnitude of biovolume density maxima of allelopathic species and the frequency of dominance).
During the periods included in our analysis, there were direct measurements of allelochemicals during times of blooms of allelochemical-producing species (i.e. microcystins detected in Lake Koronia during a mixed bloom Prymnesium parvum and cyanobacteria, Michaloudi et al. 2009), and from cultures isolated from blooms of allelochemical-producing species (i.e.
microcystins and cylindrospermopsins in Lake Kinneret, Sukenik et al. 2014), and observations of toxic and allelo- pathic impacts (i.e. fish kills and bird mortalities, copepod mortality, and rapid demise of diatoms in Lake Koronia, Michaloudi et al. 2009) that possess chemicals identified as both allelopathic and toxic (Pflugmacher 2002; Gross 2003;
Mitrovic et al. 2004; Le~ao et al. 2009; James et al. 2011; Sver- cel 2013). There were also direct measurements of allelochemi- cals during blooms of allelochemical-producing species outside periods in our analysis (i.e. microcystins measured in Lakes Volvi and Mikri Prespa, Papadimitriou et al. 2010). From this evidence, we are confident that allelopathic interactions occur in our study lakes where allelochemical-producing species are present.
RE S U LT S
Expectantly, population dynamics and assemblage composi- tion changed with increasing effect of allelopathy in our simu- lations. For assemblages characteristic of neutrality and lumpy coexistence, assemblages asymptotically approached a species-rich steady state when allelopathic effects were low (similar to what is shown in Fig. 1a). As the allelopathic effect increased, either by increasing the sensitivity to allelochemicals (decreasing KI values) or increasing the allelochemical produc- tion rate (ec), the allelopathic species increased in dominance until eventually high allelopathic effects led to monospecific blooms of the allelopathic species. For assemblages character- istic of intransitivity, oscillating and out-of-phase population dynamics occurred when allelopathic effects were low, result- ing in assemblages of three species (similar to what is shown in Fig. 1b). With an allelopathic effect, sometimes a condition of alternating states emerged where the assemblages were comprised of five species oscillating out-of-phase or sometimes a steady-state emerged with co-existence of the allelopathic species with another species. But as the allelopathy effect increased further, a monospecific bloom always resulted.
Biodiversity maps were all similar in that they showed a trend of high relative diversity rapidly transitioning to low rel- ative diversity (monospecific bloom of the allelopathic species) as allelopathic effects increased (Fig. 3). When viewing a bio- diversity map from right to left, transition from a stable mul- tispecies assemblage when KI values were large to an allelopathic monoculture when KI values were small is seen.
When viewing a map from bottom to top, transition from a stable multispecies assemblage when ec values were low to an allelopathic monoculture when ec values were large is seen.
The biodiversity maps differed, however, with regard to the positioning of this transition boundary along the allelochemi- cal production and competitor sensitivity gradients. Because
0.055 (a)
1
0 0
(b) 0.055
1
0 0
0.055 (c) 1
0 0
0 1
Growth inhibition coefficient (KI, µg liter–1)
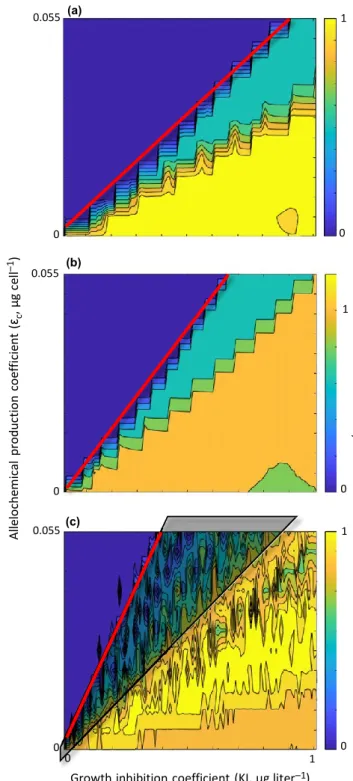
Figure 3 Representative diversity maps for neutral (a), lumpy (b) and intransitive (c) assemblages where dark blue areas indicate combinations of growth inhibition levels (where inhibition decreases with higher values of KI) and allelochemical production level resulting in monospecific blooms of the allelopathic species, and yellow areas (or orange for panel b) indicate combinations where the resulting diversity of the assemblage was not lost (or increased, in the case for panel b). Neutral diversity maps show the lowest slopes (marked by a red line) of the first transition boundary (across which monospecific blooms occur), lumpy diversity maps show steeper slopes, and intransitive diversity maps show the steepest slopes. Collapses in relative diversity that occurred in intransitive assemblages in regions of the biodiversity maps to the right of the transition boundaries were not always associated with emergence of the allelochemical producing species (c, area under transparent triangle).
Assemblage resistance to allelopathy (first transition slope from the biodiversity maps)
the transition boundaries were mostly linear over the range of ec and KI values explored here, the differing positions of the transition boundaries between assemblages could be quantified based on their slopes. This enabled a comparison between assemblages characteristic of neutrality, lumpy coexistence and intransitivity.
Neutral assemblages had low transitional boundary slopes indicating a low resistance to allelopathy (representative assemblage shown in Fig. 3a). Lumpy assemblage maps had steeper bloom transition slopes than neutral maps, indicating greater resistance to allelopathic effects than neutral assem- blages (Fig. 3b). Both neutral and lumpy assemblages always showed a monotonic change from high diversity to low diver- sity as allelopathic effect increased. Intransitive assemblages showed the steepest slopes of the bloom transition boundaries, indicating even greater resistance to allelopathic effect. With these assemblages, however, the change from high to low rela- tive diversity as allelopathic influence increased was not monotonic, as relative diversity values sometimes increased with strengthening allelopathic effect (Fig. 3c). With intransi- tive assemblages, collapses in relative diversity that occurred in regions of the biodiversity maps to the right of the monospecific bloom transition boundaries were not associated with emergence of the allelochemical producing species (shaded region in Fig. 3c).
Our characterisation of resistance to allelopathy, based on the slope of the bloom transition boundary, was positively correlated (r2 = 0.63) to the allelopathic R* composite distance, the average distance between all non-allelopathic species of the assemblage and the allelopathic species (Fig. 4). This
Assemblage type
relationship was observed within and across assemblage type.
Neutral assemblages fared worst in this regard with allelo- pathic influence, followed by lumpy assemblages, then by intransitive assemblages where the allelopathic species was centrally-located among competitor’s R*s, and finally by intransitive assemblages where the allelopathic species was peripherally located with competitor’s R*s.
Allelopathic species biovolume density and dominance, and assemblage size structure from lake data
Biovolume density (lm3 L-1) of all allelopathic species com- bined typically showed seasonal maxima (representative exam- ple for Lake Kinneret, Fig. 5a). The biovolume density of these summed allelopathic species maxima varied between lakes, with Lakes M'ezeshegyi-to', Fancsika 1, and Fancsika 2 showing the highest values, Lake Constance showing the low- est values, and the other lakes showing intermediate values (Fig. 6a).
The frequency of allelopathic species dominance also varied between lakes, with Lakes M'ezeshegyi-to', Fancsika 1, and Mikri Prespa having higher frequencies, Lake Constance hav- ing the lowest frequency, and the other lakes having interme- diate frequencies (Fig. 6b).
The size structure of assemblages varied over time, as did the number of species clusters (representative example for Lake Kinneret, Fig. 5b,c). The average number of species clusters observed on a sampling day for each lake varied between lakes, with Lakes Mikri Prespa, Kinneret, Volvi and Constance having higher values, followed by Lakes Koronia, Fancsika 1, Fancsika 2 and M'ezeshegyi-to' (Fig. 6).
A negative relationship between the number of averaged 0.3
0
Neutral Lumpy
Intransitive (central) Intransitive (peripheral)
0.05 0.3
Dissimilarity between allelopathic species and rest of assemblage (allelopathic R* composite value)
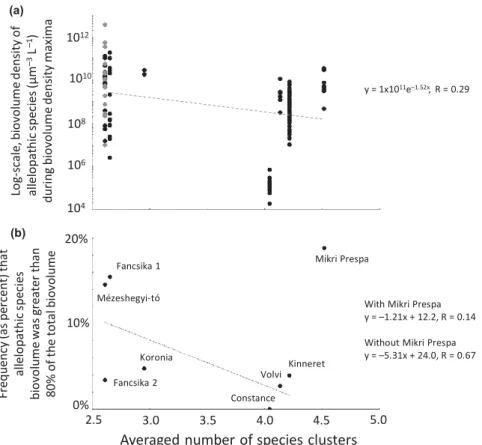
species clusters in lake assemblages and allelopathic species biovolume densities was observed. An exponential curve fit regression model suggested a c. 10-fold decrease in allelo- pathic species biovolume density over the c. 2.5 to c. 4.5 assemblage species cluster range (Fig. 6a). Allelopathic species biovolume density showed greater variance from the regres- sion model prediction when the number of species clusters was lower.
Negative relationships between the number of averaged spe- cies clusters in lake assemblages and frequency of dominance were also observed. Linear fit regression models suggest a c.
5-fold decrease in frequency of dominance of allelopathic spe- cies over the c. 2.5–4.5 species cluster range (Fig. 6b). A stronger regression model (i.e. higher R-value) was obtained when Lake Mikri Prespa was omitted.
DISC USS I ON Figure 4 A positive correlation exists between an assemblage’s ability to
resist a monospecific bloom of the allelopathic species (reflected by the slopes from the biodiversity maps of the transition boundaries between monospecific blooms of the allelopathic species and other assemblage compositions, y-axis) and the combined ability of assemblage members to compete for resources (reflected by the allelopathic R* composite value, x-axis). A near-consistent ranking emerged going from neutral (filled black circles), to lumpy (open circles), to intransitive assemblages with centrally located allelopathic species (filled black squares), and finally to intransitive assemblages with peripherally located allelopathic species (open diamonds).
In our model, transitions were abrupt between non-bloom states of higher biodiversity and monospecific bloom states of the allelopathic species. The bloom states were monospecific because of the suppressing effect by interference competition from the allelopathic species on exploitative competition. The transitions were abrupt because of the positive feedback resulting from increased toxin concentration by increasing densities of the allelopathic species, leading to a stronger sup- pression of their non-allelopathic competitors and a further
1396 R. M. W. Muhl et al. Letter
Nu mber of spe ci e s
Bi n n u mb er (b ased on ce ll si ze) Bi o volu me de nsity (10
10µm
–3L
–1)
Nu mber of spe ci e
s *
25 (a)
All phytoplankton taxa Allelopathic taxa
5 1
0
(b)
23 10
1
1996 97 98 99 00 01 02 03 04 05 06 07 08 09 10 11 12 13 14 15
Time (calendar year)
0
2016
(c)
5
*
*
0
1 2 3 4 5 6 7 8 9 10 11 12 13 14 15 16 17 18 19 20 21 22 23
Bin number (based on cell size)
Figure 5 From the Lake Kinneret data, biovolume density over time for total phytoplankton and the sum of all allelopathic taxa (a), the number of taxa occurring in each of the standardised size classes over time (b), and the cell-size frequency distribution at a single point in time are shown. For the single point in time (c), three species clusters are noted (peaks marked with ‘*’, see text for explanation of rule followed for cluster identification).
Frequency (as percent) that allelopathic species biovolume was greater than 80% of the total biovolume Log-scale, biovolume density of allelopathic species (µm–3L –1) during biovolume density maxima (a)
1012
1010
y = 1x10¹¹e–1.52x, R = 0.29
108 106
(b)
104 20%
Fancsika 1 Mikri Prespa
10%
0%
Mézeshegyi-tó
Koronia
Fancsika 2 Volvi
Constance Kinneret
With Mikri Prespa y = –1.21x + 12.2, R = 0.14
Without Mikri Prespa y = –5.31x + 24.0, R = 0.67
2.5 3.0 3.5 4.0 4.5
Averaged number of species clusters 5.0
Figure 6 An emergent trend consistent with our modeling is observed among the time-series data from all lakes, in which a negative relationship exists between a lake’s log-scale, averaged biovolume density of allelopathic species (during biovolume density maxima, which tend to be seasonal) and the lake’s averaged number of species clusters (a); and a negative relationship exists between a lake’s frequency of occurrence of assemblages dominated by 80% or more allelopathic-producing species and the lake’s averaged number of species clusters (b).
reduced exploitative competitive effect by the non-allelopathic species. Positive feedbacks leading to rapid bloom formation, such as this, have been surmised from field observations and experiments (Sunda et al. 2006; Gran'eli et al. 2012). In addi- tion, near-monospecific blooms are commonly observed in nature (Keating 1978; Michaloudi et al. 2009; Hattenrath- Lehmann & Gobler 2011). Through our modeling here, we mechanistically demonstrate the functioning of one such posi- tive feedback.
The emergent behaviour of our model suggests that an assemblage’s resistance to monospecific bloom formation of the allelopathic species may be tied to the degree of competi- tive interactions between assemblage members. In our simula- tions, the more dissimilar assemblage members were from the allelopathic species in their ability to exploit resources, the more resistant the assemblages became to monospecific blooms of the allelopathic species. In other words, stronger allelochemical effects (through ec and KI) were required to overcome assemblages with greater competitive power. This observation of our model’s emergent behaviour is similar to what has been observed in plant systems that have experi- enced invasions, where invasion success and impact on resi- dents were a function of the invaders life history traits relative to the life history traits of the residents (Von Holle et al.
2003; Ortega & Pearson 2005; Gruntman et al. 2014).
For some simulations, assemblage states other than the dichotomous biodiverse and monospecific bloom states
occurred. Specifically, for some of the intransitive assemblages non-allelopathic species with dissimilar traits from the allelo- pathic species were able to survive in monoculture or persist with the allelopathic species under high allelopathic effect. In these instances, the population losses arising from allelochemi- cal exposure did not completely mask the advantage gained by being competitively dissimilar. Though the combinations of ec and KI where this was observed were few, it occurred several times for some intransitive assemblages. Perhaps this is why sometimes near-monospecific blooms of allelopathic species are observed in nature, as referenced above, and other times non allelopathic species are able to co-exist with allelo- pathic species during blooms (West et al. 1996; Lindholm et al. 1999; Redalje et al. 2008; de Figueiredo et al. 2006).
Our model results also showed that the incidence of monospecific blooms of the allelopathic species was a function of the assemblage type. For example, neutral assemblages occupied the smallest volume of the three-dimensional resource tradeoff space. Consequently, these allelopathic R*
composite distances were the least. The neutral assemblages were also the most vulnerable to monospecific blooms of the allelopathic species. An explanation for this may be that an allelopathic species can be expected to affect the population dynamics of all functionally equivalent members in the same way. Conversely, assemblages characteristic of lumpy coexis- tence and intransitivity occupied larger volumes of the three- dimensional resource tradeoff space, had greater allelopathic
1398 R. M. W. Muhl et al. Letter
R* composite distances and exhibited stronger resistance to monospecific blooms of the allelopathic species. An explana- tion for this may be that an allelopathic species can be expected to affect the population dynamics of assemblage members differentially when they are competitively dissimilar.
Interestingly, other modeling studies comparing the resistance and resilience of neutral, lumpy and intransitive assemblages to various other processes common in aquatic environments showed that intransitive assemblages were generally much more vulnerable to biodiversity collapses than neutral and lumpy assemblages, suggesting incidence of intransitivity in plankton systems might be rare (Roelke & Eldridge 2008;
Bhattacharyya et al. 2018; Withrow et al. 2018). Here, we show that when allelopathic interactions are considered, intransitive assemblages are more resistant, which suggests intransitivity in plankton systems might not be as rare as pre- viously suggested.
Observations from the eight lakes used in this study are consistent with our model findings. Lake M'ezeshegyi-to' had among the highest biovolume densities of allelopathic species.
It also had the least number of assemblage species clusters.
Relatively high biovolume densities and low average species clusters are also observed with Lakes Fancsika 1, Fancsika 2 and Koronia. Contrastingly, high average number of species clusters and generally lower biovolume densities of allelo- pathic species were observed with Lakes Kinneret, Constance, Volvi and Mikri Prespa. Similarly, Lakes M'ezeshegyi-to' and Lakes Fancsika 1 had higher frequencies of dominance of allelopathic species, while Lakes Kinneret, Constance, and Volvi had lower frequencies of allelopathic species dominance.
If we assume that the biovolume density and frequency of allelopathic species dominance are, in part, influenced by the resistance of the phytoplankton assemblage to monospecific blooms of allelopathic species (which our model shows); and if we assume that an assemblage characteristic of species clus-
(whether comprised of allelopathic species or not), it is also likely that population dynamics of greater magnitude occur.
That is, larger and more rapid changes in population densities might lead to greater prevalence of ‘boom and bust’ cycles (Rosenzweig 1971). In addition, the shallow depths of these lakes also likely lead to greater dynamics in nitrogen to phos- phorus ratios and ammonium to nitrate ratios as aperiodic winds drive upward mixing of nutrient-rich and possibly oxy- gen-depleted bottom waters. Taken together, this would sug- gest that at the time of resource replenishment following a mixing event, the composition of the phytoplankton and the stoichiometry of the nutrients would be highly variable. Given that succession dynamics and resulting assemblage composi- tion can be sensitive to initial conditions (Roelke 2000; Huis- man & Weissing 2001), the large variance observed in our regression model at low numbers of species clusters is not surprising.
Conversely, when lakes are deeper and less eutrophic, allelo- pathic species biovolume variance is lessened. The exception is our largest and deepest lake, Lake Constance, which has much lower allelopathic species biomass than the regression model predicts. This system has undergone a high rate of olig- otrophication with implementation of nutrient loading reduc- tion strategies (Sommer et al. 1993; Murphy et al. 2018). It may be that over time the phytoplankton assemblage of this lake will continue to change towards a state where there are even more species clusters, or it might change towards a state where the biomass of allelopathic species becomes greater. An investigation of changing number of species clusters and allelopathic species over time is left for future research.
The frequency of dominance of allelopathic species is c.
5-fold higher when assemblages have fewer species clusters, as predicted by our regression model with Lake Mikri Prespa excluded. Again, variance from the model prediction is greater when there are fewer species clusters. For example, Lakes tering is more resistant to allelopathic species than assem- M'ezeshegyi-to' and Fancsika 1, which have extremely high blages without species clusters (which our model shows); then
an inverse relationship should exist between biovolume den- sity of allelopathic species and species clustering, and also the frequency of allelopathic species dominance and species clus- tering, which is indeed the case with the lakes analysed here.
However, other processes may also influence biovolume density and frequency of allelopathic species dominance.
Other biological processes, such as disruption of grazing (Caron et al. 1989) and adaptation to low light environments (Jo€hnk et al. 2008), can influence algal bloom density. Other factors also play roles in determining algal bloom biomass, such as lake trophic state (Smith 2003) and morphometry as it influences mixing depth (Huisman & Sommeijer 2002).
River discharges also influence the frequency of blooms (Mitrovic et al. 2011; Roelke et al. 2011). Indeed, in both our regression models there is variance from the model predic- tions, suggesting that other processes were at play.
Regarding allelopathic species biovolume density, for fewer species clusters the allelopathic species biovolume is c. 10-fold higher and the variance is greater. Lakes M'ezeshegyi-to', Fancsika 1, Fancsika 2 and Koronia are all nutrient rich and of shallow depth. While enriched waters certainly allow for phytoplankton assemblages to reach higher biovolume density
levels of nutrients, have higher frequencies of allelopathic spe- cies dominance than predicted by the regression model, while Lakes Fancsika 2 and Koronia, also with high nutrients, but not as high as the previous two lakes (Borics et al. 2016;
Michaloudi et al. 2009, although this study measures soluble reactive phosphorus in the lake while the other lakes were measured for total phosphorus), have lower frequencies of allelopathic species dominance than predicted by the regres- sion model. It may be that with extreme eutrophication the incidence of light limitation is greater, likely selecting for spe- cies able to form and maintain surface scums, like many allelopathic species of cyanobacteria are able to do. This notion is also left for future research. Regarding our exclusion of Lake Mikri Prespa from this latter regression model, an extreme drought condition persisted at the time of sampling for this lake, which likely led to an uncommon condition of allelopathic species persistence.
CO NCL U S I ON S
Central to niche theory is the idea that tradeoffs in competi- tive abilities for multiple resources promote coexistence among species, a cornerstone of widely embraced theory of
resource competition (Tilman 1982). We showed that the rela- tive magnitude of the tradeoffs may lead to differential effects of exploitative and interference competition on individual spe- cies. Even small changes in the R* values can strongly influ- ence fitness of assemblage members confronted with allelopathy. While many factors contribute to the develop- ment of allelopathic blooms, with our research we show for the first time that differences in assemblage competitive power can affect an assemblage’s resistance to allelopathy. This hard-to-measure characteristic of natural phytoplankton assemblages may help explain why some blooms appear sud- denly when other environmental factors seem stable. This research represents a first step in characterising another mech- anism, assemblage competitive power, to explain the incidence of allelopathic blooms in natural assemblages.
AC KN OWLE DG EME N T S
This was unfunded research. The authors are grateful to anonymous reviewers for their constructive comments on a previous iteration of this manuscript.
AU THO R SHIP
RM and DLR conceived the idea and designed the study.
RM, DLR, JB and FGW performed the numerical modeling and analysis of time-series data. All authors (RM, DLR, TZ, MMG, US, GB, UG, FGW and JB) contributed to the eco- logical interpretation of the research. RM and DLR wrote the first iteration of the manuscript. All authors revised and edi- ted the manuscript.
DA TA AC CE SS IB ILIT Y
Data available from the Dryad Digital Repository: http://doi.
org/10.5061/dryad.3vk16fq
CO NFL I CT O F IN TE RE S T
The authors have no conflicts of interest.
RE F E R E N C E S
Bhattacharyya, J., Roelke, D.L., Muhl, R.M.W. & Withrow, F.G. (2018).
Exploitative competition of invaders differentially influences the diversity of neutral, lumpy and intransitive phytoplankton assemblages in spatially heterogeneous environments. Ecol. Mod., 370, 59–66.
Borics, G., Grigorszky, I., Szabo, S. & Padisak, J. (2000). Phytoplankton associations in a small hypertrophic fishpond in East Hungary during a change from bottom-up to top-down control. Hydrobiologia, 424, 79–
90.
Borics, G., Nagy, L., Miron, S., Grigorszky, I., Laszlo-Nagy, Z., Lukacs, B.A. et al. (2013). Which factors affect phytoplankton biomass in shallow eutrophic lakes? Hydrobiologia, 714, 93–104.
Borics, G., Wolfram, G., Chiriac, G., Belkinova, D. & Donabaum, K.
(2016). Eastern continental lakes. BQE, Phytoplankton, 24 p.
Caron, D.A., Lim, E.L., Kunze, H., Cosper, E.M. & Anderson, D.M.
(1989). Trophic interactions between nano- and microzooplankton and the ‘brown tide’. In: Novel Phytoplankton Blooms. Coastal and Estuarine Studies (Formerly Lecture Notes on Coastal and Estuarine
Studies), Vol. 35 (eds Cosper, E.M., Bricelj, V.M. & Carpenter, E.J.).
Springer, Berlin, Heidelberg, pp. 265–294.
Case, T.J. & Gilpin, M.E. (1974). Interference competition and niche theory. Proc. Natl Acad. Sci., 71, 3073–3077.
Chase, J.M. & Leibold, M.A. (2014). Ecological Niches, Linking Classical and Contemporary Approaches. Interspecific Interactions. University of Chicago Press, Chicago, IL.
de Figueiredo, D.R., Reboleira, A.S.S.P., Antunes, S.C., Abrantes, N., Azeiteiro, U., Gonsalves, F. et al. (2006). The effect of environmental parameters and cyanobacterial blooms on phytoplankton dynamics of a Portuguese temperate lake. Hydrobiologia, 568, 145–157.
Fistarol, G.O., Legrand, C. & Gran'eli, E. (2003). Allelopathic effect of Prymnesium parvum on a natural plankton community. Mar. Ecol.
Prog. Ser., 255, 115–125.
Gaedke, U. (1998). Functional and taxonomical properties of the phytoplankton community, Interannual variability and response to re- oligotrophication. Adv. Limnol., 53, 119–141.
Gaedke, U. & Schweizer, A. (1993). The first decade of oligotrophication in Lake Constance. Oecologia, 93, 268.
Gran'eli, E., Edvardsen, B., Roelke, D.L. & Hagstro€m, J.A. (2012). The ecophysiology and bloom dynamics of Prymnesium spp. Harmful Algae, 14, 260–270.
Gross, E.M. (2003). Allelopathy of aquatic autotrophs. CRC Crit. Rev.
Plant Sci., 22, 313–339.
Grover, J.P. (1997). Resource Competition. Chapman and Hall, London.
Grover, J., Crane, K., Baker, J., Brooks, B. & Roelke, D.L. (2010).
Spatial variation of Harmful Algae, and their toxins in flowing-water habitats, a theoretical exploration. J. Plank. Res., 33, 211–227.
Gruntman, M., Pehl, A.K., Joshi, S. & Tielborger, K. (2014). Competitive dominance of the invasive plant Impatiens glandulifera, using competitive effect and response with a vigorous neighbor. Biol.
Invasions, 16, 141–151.
Hattenrath-Lehmann, T.K. & Gobler, C.J. (2011). Allelopathic inhibition of competing phytoplankton by North American strains of the toxic dinoflagellate, Alexandrium fundyense: evidence from field experiments, laboratory experiments, & bloom events. Harmful Algae, 11, 106–116.
Huisman, J. & Sommeijer, B. (2002). Population dynamics of sinking phytoplankton in light-limited environments, simulation techniques and critical parameters. J. Sea Res., 48, 83–96.
Huisman, J. & Weissing, F.J. (2001). Fundamental unpredictability in multispecies competition. Am. Nat., 157, 488–494.
James, S.V., Valenti, T.W., Roelke, D.L., Grover, J.P. & Brooks, B.W.
(2011). Probabilistic ecological assessment of microcystin-LR, a case study of allelopathy to Prymnesium parvum. J. Plank. Res., 33, 319–332.
Jo€hnk, K.D., Huisman, J., Sharples, J., Sommeijer, B., Visser, P.M. &
StrooM, J.M. (2008). Summer heatwaves promote blooms of harmful cyanobacteria. Global Change Biol., 14, 495–512.
Jonsson, P.R., Pavia, H. & Toth, G. (2009). Formation of harmful algal blooms cannot be explained by allelopathic interactions. Proc. Natl Acad. Sci., 106, 11177–11182.
Keating, K.I. (1978). Blue-green algal inhibition of diatom growth, transition from mesotrophic to eutrophic community structure. Science, 199, 971–973.
Keddy, P. (1989). Competition. Population and Community Biology Series, Chapman and Hall, New York.
Kubanek, J., Hicks, M.K. & Naar, J. (2005). Does the red tide dinoflagellate Karenia brevis use allelopathy to outcompete other phytoplankton? Limnol. Oceanogr., 50, 883–895.
Le~ao, P.N., Teresa, M., Vasconcelos, S.D. & Vasconcelos, V.M. (2009).
Allelopathy in freshwater cyanobacteria. Crit. Rev. Microbiol., 35, 271–282.
Legrand, C., Rengefors, K., Fistarol, G.O. & Gran'eli, E. (2003).
Allelopathy in phytoplankton – biochemical, ecological, & evolutionary aspects. Phycologia, 42, 406–419.
Leon, J.A. & Tumpson, D.B. (1975). Competition between two species for complementary or substitutable resources. J. Theo. Biol., 50, 185–201.