doi: 10.3389/fmicb.2018.01599
Edited by:
Raffaella Balestrini, Consiglio Nazionale Delle Ricerche (CNR), Italy
Reviewed by:
Francesco Vinale, Istituto per la Protezione Sostenibile delle Piante (CNR), Italy Roberto Silva, Universidade de São Paulo, Brazil
*Correspondence:
László Kredics kredics@bio.u-szeged.hu
Specialty section:
This article was submitted to Fungi and Their Interactions, a section of the journal Frontiers in Microbiology
Received:19 January 2018 Accepted:27 June 2018 Published:25 July 2018
Citation:
Kredics L, Chen L, Kedves O, Büchner R, Hatvani L, Allaga H, Nagy VD, Khaled JM, Alharbi NS and Vágvölgyi C (2018) Molecular Tools for Monitoring Trichoderma in Agricultural Environments.
Front. Microbiol. 9:1599.
doi: 10.3389/fmicb.2018.01599
Molecular Tools for Monitoring Trichoderma in Agricultural
Environments
László Kredics1*, Liqiong Chen1, Orsolya Kedves1, Rita Büchner1, Lóránt Hatvani1, Henrietta Allaga1, Viktor D. Nagy1, Jamal M. Khaled2, Naiyf S. Alharbi2and Csaba Vágvölgyi1,2
1Department of Microbiology, Faculty of Science and Informatics, University of Szeged, Szeged, Hungary,2Department of Botany and Microbiology, College of Science, King Saud University, Riyadh, Saudi Arabia
VariousTrichodermaspecies possess significance in agricultural systems as biofertilizers or biocontrol agents (BCAs). Besides these beneficial features, certain Trichoderma species can also act as agricultural pests, causing the green mold disease of cultivated mushrooms. This double-faced nature of the genus in agricultural environments points at the importance of proper monitoring tools, which can be used to follow the presence and performance of candidate as well as patented and/or registered biocontrol strains, to assess the possible risks arising from their application, but also to track harmful, unwantedTrichodermaspecies like the green molds in mushroom growing facilities. The objective of this review is to discuss the molecular tools available for the species- and strain-specific monitoring ofTrichoderma, ranging from immunological approaches and fingerprinting tools to exogenous markers, specific primers used in polymerase chain reaction (PCR) as well as “omics” approaches.
Keywords: biocontrol agent, fingerprinting, marker, monitoring, PCR, specific detection, transformation, Trichoderma
INTRODUCTION
Members of the filamentous fungal genus Trichoderma commonly occur in the soil and the rhizosphere of various plants. The genus has been a popular subject of basic and applied mycology research since the 1930s (Weindling, 1932), which is mainly due to the fact that Trichoderma species play important roles in various agricultural environments ranging from field and forest soil ecosystems to substrate materials used for mushroom production. Several members of the genus have the potential to control plant pathogenic fungi and nematodes by antagonistic action based on competition, antibiosis and/or parasitism, furthermore, the biostimulant ability of certainTrichodermaspecies enables to enhance the uptake of nutrients by plants, promote plant growth, increase crop productivity and induce systemic resistance in plants, which can also be exploited within the frames of environmentally friendly agricultural practices (Harman et al., 2004;
Nawrocka and Małolepsza, 2013; Gupta et al., 2014; López-Bucio et al., 2015; Contreras-Cornejo et al, 2016). The original view consideringTrichodermaspecies as biocontrol agents has recently evolved to the concept that they are avirulent, endophytic plant symbionts capable of long-lasting colonization and penetration of roots and providing the plants with various beneficial effects (Harman et al., 2004; Lorito et al., 2010). However, besides the positive implications of the genus, Trichodermaspecies may also be harmful for agriculture, like in the case of mushroom production,
where Trichoderma occurs as the causal agent of green mold disease severely affecting cultivated mushrooms (Hatvani et al., 2008, 2017; Kredics et al., 2010). Moreover, certain species of the genus are known as opportunistic human pathogens, and the causal agents of different diseases may also originate from agricultural environments (Druzhinina et al., 2008).
Ecological fitness is an important trait of any Trichoderma strain to establish in agricultural habitats like soil, plant rhizosphere or compost materials (Weaver et al., 2005; Cordier et al., 2007). The survival and spread of Trichoderma in an agricultural habitat depend on its interactions with the environmental parameters as well as the biotic and abiotic components of the local ecosystem (Kredics et al., 2003). An increased knowledge about the inoculum source, survival, spread and general population dynamics of harmfulTrichodermaspecies in the substrates of mushroom production may enable the development of more efficient control measures to avoid green mould outbreaks in mushroom farms. On the other hand, during the development of a beneficial Trichoderma strain to a BCA, a crucial step is the collection of basic information about its abilities to colonize, persist, and spread under the conditions characteristic to the environment where it will be applied (Longa et al., 2009). Monitoring the fate, behavior and population dynamics ofTrichoderma strains released as BCAs into the environment is therefore of special importance. In Europe, the registration of new,Trichoderma-based biocontrol products requires the use of specific monitoring tools capable of accurately identifying and quantifying the released strain and tracking its population dynamics over time (Savazzini et al., 2008). Therefore, it is a challenge of increasing importance to differentiate the newly introducedTrichodermastrains from the natural Trichoderma populations occurring in an agricultural habitat (Dodd et al., 2004b).
The traditional microbiological approach in Trichoderma population studies is the use of Trichoderma-selective or semi- selective agar media (Elad et al., 1981; Chung and Hoitink, 1990; Williams et al., 2003; Vargas Gil et al., 2009) for dilution plating of environmental samples, which is followed by the calculation of colony forming units (CFU). However, only the total amount of Trichoderma propagules can be assessed by this technique, it does not enable the distinction of an introduced strain from the Trichoderma populations resident in the investigated environment. Neither morphological, nor nutritional criteria are suitable markers to reliably verify the identity of the colonies (Hermosa et al., 2001), and for the large number of samples examined during population studies, a colony-by-colony barcoding based on the sequence analysis of the ITS (internal transcribed spacer) region (Druzhinina et al., 2005) or a part of the translation elongation factor 1α(tef1) gene (Kopchinskiy et al., 2005) would be extremely expensive and time-consuming. Furthermore, the quantification of more than one strain by dilution plating is limited if one of the strains grows faster and completely covers the agar plate before all colonies could be counted (Dodd et al., 2004b).
Biochemical characterization ofTrichodermastrains may be applicable for species identification or studying the diversity within and between certain species of the genus. Methods
of isoenzyme analysis have been succesfully applied, e.g., for the differentiation between morphologically undistinguishable strains belonging to the T. harzianum species complex (Grondona et al., 1997), or for the characterization of winter wheat rhizosphere-derived Trichoderma strains belonging to various species based on their well-defined, characteristic isoenzyme patterns (Kredics et al., 2012). Metabolic profiling by BIOLOG Phenotype MicroArray on 95 carbon sources has also been applied to differentiate among Trichoderma strains at the species level (Hoyos-Carvajal et al., 2009), furthermore, the diversity of certain taxa, in particular the T. harzianum species complex, including isolates with antagonistic potential against the plant pathogenic fungusSclerotinia sclerotiorum, was also found to be clearly reflected in their BIOLOG metabolic profiles (Lopes et al., 2012). However, although these approaches proved to be applicable to investigate the biochemical diversity between—and in some cases also within—distinct species of the genus Trichoderma, they are not suited well enough for monitoring purposes.
Although benomyl resistant mutants were succesfully used to examine the rhizosphere competence ofT. harzianum strains in an early study (Ahmad and Baker, 1987), mutants might behave differently from the wild type strain in agricultural habitats, therefore methods enabling the monitoring of the wild type strain’s population dynamics would be more preferable (Green and Jensen, 1995). The availability of the highly sensitive molecular biology tools summarized below, some of them being also highly specific, may fulfill the emerging need for high-throughput, rapid, and cheap monitoring techniques to detect beneficial or harmful strains and species from the genus Trichodermain various agricultural environments.
IMMUNOLOGICAL APPROACHES
Immunological assays provide a range of possibilities for studying the growth dynamics of Trichoderma species during their antagonistic interactions with their saprotrophic target fungi in complex natural environments. Immunoassays as fast and sensitive detection methods were used to precisely identify and quantify Trichoderma species in soil or other complex environments. The introduction of hybridoma technology resulted in the exploration and application of specific monoclonal antibodies (MAbs) from animals (e.g., mice) to quantify Trichoderma biomass in soil. Enzyme-linked immunosorbent assays (ELISA) or immunofluorescence was employed to detect fungi in soil. MAbs of the immunoglobulin sub-class IgG2a
produced by the cell line Th.HD33 from murine splenocytes could specifically recognize an antigen, a protein epitope which is part of a glycoprotein molecule from a number of Trichodermaspecies. This MAbs-based immunological assay has been used for the specific identification of livingT. harzianum mycelia colonizing peat-bran medium (Carter and Lynch, 1991;
Thornton et al., 1994).
More importantly, immunological assays can not only discriminate between mixed populations but also between different growth states ofTrichodermaspecies. In the study of
Thornton et al. (1994), a MAb-based ELISA was used to detect the active mycelium ofT. harzianum. In contrast, murine MAbs produced from a hybridoma cell line,GH5, can only recognize antigens from phialoconidia of T. harzianum and T. viride isolates but not from chlamydospores or mycelium (Thornton and Dewey, 1996). MAbs-based assays that quantify the biomass ofTrichodermastrains and detect their different components can be employed in the quantitative analysis of population dynamics of BCAs. MAbs can also be used to detect and quantify the growth of soil borne pathogens, such asRhizoctonia solaniand their growth dynamics under the influence of the hyperparasitic T. harzianum artificially introduced into composts (Thornton et al., 1999). The high level of specificity of the monoclonal antibody MF2 (raised against the constitutive glucoamylase enzyme) as a molecular marker for the recovery and detection of Trichodermaspecies has been demonstrated in the study of Thornton et al. (2002). MF2 specific for Trichoderma species and a group of their close relatives prepared from a commercial β-1,3-glucanase allowed the fast detection and visualization of Trichodermaspecies in soil or other complex matrices containing mixed fungal populations. The examined Trichodermaspecies have been shown to greatly inhibit the saprotrophic growth of R. solani in composts. By immunofluorescence micoscopy using MF2,Trichodermaisolate S-B2 was shown to grow toward and coil around the hyphae of the host in dual cultures of TrichodermaandRhizoctonia(Thornton et al., 2002).
Immunological methods are also able to distinguish between rapid mycelial growth of Trichoderma and other components such as conidia and spores. In the study of Thornton (2004), the Trichoderma-specific monoclonal antibody MF2 was used to quantitatively assess the population dynamics of BCAs from the species T. harzianum and T. asperellum in antagonistic interaction with the pathogen R. solani in microcosm studies.
A R. solani-specific monoclonal antibody (EH2) recognized an extracellular glycoprotein secreted from the growing tip of Rhizoctonia mycelia. Standard curves were constructed from extracts of lyophilized mycelium containing quantifiable and repeatable sources of the antigens. By using these curves, lyophilized mycelial biomass could be calculated, which allowed to comparatively estimate the mycelial growth ofTrichoderma species andR. solani.Trichodermaspecies were able to prevent R. solanigrowth by competing with the pathogen for nutrients (Thornton, 2004).
The above studies indicate that the development of immunological assays allows the species-level detection and identification ofTrichodermastrains, however, a shortage of these techniques is that serology is not specific at the isolate level.
INTRODUCTION OF EXOGENOUS MARKER GENES
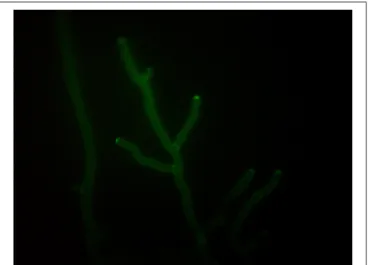
Genetic engineering of BCAs with exogenous markers, e.g., the green fluorescent protein (gfp) (Figure 1), hygromycin B phosphotransferase (hygB), and/or β-glucuronidase (GUS) encoding genes is a powerful strategy to detect and monitor
FIGURE 1 |Hyphae ofTrichoderma pleurotiexpressing the green fluorescent protein (photo: Lóránt Hatvani).
individual Trichoderma strains in agricultural habitats (Green and Jensen, 1995; Lo et al., 1998; Bae and Knudsen, 2000).
Trichoderma harzianumTF3, a propiconazole-resistant strain with the ability of survival at relatively high densities in the phylloplane of tomato and grapevine and high antagonistic potential againstBotrytis cinereaon these crops was transformed to hygromycin B resistance by high-voltage electric pulse with the vector pHATα (a derivative of pAN7-1) containing the hygromycin B phosphotransferase (hph) gene of E. coli, which confers hygromycin B resistance as a selectable marker (Migheli et al., 1994). All transformants showed higher survival rates on tomato phylloplane than the wild type strain, all of them being mitotically stable after several passages in the absence of selective pressure and on tomato plants during 2 weeks, without losing the ability to grow in the presence of both hygromycin B and propiconazole. Thrane et al.
(1995) used the polyethylen-glycol method to transform the same T. harzianum strain with both pNOM102 and pAN7- l carrying the Escherichia coli β-glucuronidase (GUS) and hygBresistance genes, respectively. The resulting transformants could be visualized under an epifluorescence microscope. Three methods were used to assay the GUS activity with 5-bromo-4- chloro-3-indolyl-β-D-glucuronide: the transformant strains were tested in a microtiter plate by incubating fresh mycelium, non- sporulating transformants were assayed for GUS activity on plates by wounding the mycelium, or the GUS activities of mycelial extracts were measured. Three of the transformants, T. harzianumT3a, T3b, and T3c proved to be mitotically stable for 8 months with respect to both genes. Green and Jensen (1995)studied the population activity and stability of the GUS- transformed T. harzianum strain T3a in the rhizosphere of sphagnum peat-grown cucumber plants. This was the first study using the GUS marker to monitor the presence, population dynamics and activities of aT. harzianumstrain introduced into the rhizosphere. The authors proved the genetic stability of the transformant during its growth in a natural potting mixture, and observed a high GUS-production in conidia preparing for
germination as well as during subsequent mycelial growth. The results demonstrate the applicability of a GUS-transformed strain to detect the presence and follow the population dynamics and activities of a specificT. harzianumstrain in the environment.
Bowen et al. (1996)transformed anotherT. harzianumstrain, M1057, shown to be effective againstSclerotium rolfsii, with the plasmids pAN7-l and pNOM102. Two transformants proved to be mitotically stable and their growth rates were not different from the wild type. In order to evaluate the effect of transformation on biocontrol ability, the parental strain and the selected transformants were compared for their abilities to protect lentil (Lens culinaris) from the parasitic attack ofS. rolfsii.
Both the wild type and the transformant T. harzianumstrains could rapidly colonize the soil with fast growth at the surface and inhibitS. rolfsiigrowth (Bowen et al., 1996).
To monitor the hyphal growth, activities and survival of a T. harzianum strain, Bae and Knudsen (2000) transformed strain ThzID1 with plasmids carrying thegfp(pTEFEGFP), GUS (pNOM102), andhygB(pAN7-2) genes. The mitotic stability of the cotransformants and their capacity to colonize the resting sclerotia of the plant pathogen Sclerotinia sclerotiorumin soil were investigated. The cotransformant ThzID1-M3 proved to be the only strain showing stable expression of all three introduced exogenous marker genes. In order to confirm the genomic integration of the introduced plasmid DNAs, the total genomic DNAs of ThzID1-M3 and the parental strain ThzID1 were tested by Southern hybridization with a pTEFEGFP fragment (HindIII- BamHI), a pNOM102 fragment (NcoI-NcoI), and a pAN7-2 fragment (HindIII-EcoRI) to confirm the genomic integration of the introduced marker genes. According to the results of this study, cotransformation with GUS and gfp may provide a useful tool to detect and monitor specific T. harzianum strains released into the soil. ThzID1-M3 was the most succesful, colonizing∼60% of the sclerotia. A subsequent study examined, whether Aphelenchoides sp. (a fungivorous nematode) affects the growth and proliferation of ThzID1-M3 in soil (Bae and Knudsen, 2001). Soil treatment with a ThzID1-M3 formulation was found to stimulate the growth of fungivorous and other nematode populations, and a fungivorous nematode population could significantly reduce the colonization of S. sclerotiorum sclerotia by ThzID1-M3 in soil. Fungivorous nematodes migrate to soil locations with large quantities of available nutrients. Based on the results of the study, theTrichodermastrain introduced into the soil as a pellet formulation formed a hyphal net of high-density, which may be able to attract nematodes by serving as an appropriate nutrition source. Orr and Knudsen (2004) used the GUS- and gfp-labeled T. harzianum strain ThzID1-M3 to quantitatively measure the biomass changes of a fungal BCA in nonsterile soil, where the populations of indigenous bacteria and fungi interfere with traditional biomass determination procedures. The marker genes GUS and gfp allowed differentiation between the introduced BCA and the indigenous Trichoderma populations, and demonstrated that the monitoring ofgfp-labeledT. harzianumby epifluorescence microscopy was a useful method for distinguishing active hyphal biomass functional for biological control from inactive chlamydospores and conidia enumerated by plate counts.Kim
and Knudsen (2008)developed a set of specific PCR primers for ThzID1-M3 with high reproducibility and precision. Methods applying real-time PCR and epifluorescence microscopy-based image analysis were subsequently refined and evaluated in order to quantify the colonization dynamics ofS. sclerotiorumsclerotia by ThzID1-M3 (Kim and Knudsen, 2011). In a recent study, Contina et al. (2017)hypothesized that the use ofT. harzianum ThzID1-M3 would allow direct observation of the biocontrol mechanisms employed by strain ThzID1-M3 to reduce infection and reproduction of the potato cyst nematodeGlobodera pallida.
Strain ThzID1-M3 proved to be useful to monitor the biocontrol interactions betweenT. harzianumand the nematode: the BCA significantly reduced G. pallidainfection and reproduction in potato roots.
Lu et al. (2004)introduced the gfp gene intoT. atroviride strain P1, which is able to suppress diseases caused byPythium ultimumandR. solani. The authors proved that transformation with thegfp gene had no affect on the biocontrol activity of the T. atroviride P1 strain. Kowsari et al. (2014)transformed the T. harzianum strain ABRIICC T8-7MK, resulting from protoplast fusion, with theamdSandgfpgenes, and selected a cotransformant which was subsequently tested againstR. solani.
The cotransformant was able to colonize potato tubers affected by black scurf and planted into agricultural soil treated with the Trichoderma strain. After 20 days of incubation, Trichoderma was found to completely colonizeR. solanisclerotia and produce conidia totally covering the black scurf.
Although green fluorescent protein, hygromycin B resistance or GUS activity enable the development of simple tools for the monitoring of biocontrol strains (Bowen et al., 1996), the application of organisms genetically modified with exogenous markers as BCAs is a very tedious alternative due to the public concern about the release of GMOs into natural environments, which also needs specific permission in several countries including the European Union (Dodd et al., 2004b).
Therefore, there is a constant need for the development of molecular tools based on endogenous DNA markers enabling the specific monitoring of distinct, genetically unmodified biocontrol Trichodermastrains in agricultural environments.
FINGERPRINTING TECHNIQUES
In general sense, fingerprinting techniques are DNA-based methods relying on PCR, digestion with restriction enzymes and/or Southern hybridization, generating banding patterns that can be compared with each other and allow the identification of characteristic, strain-specific DNA fragments.
The specific tool known as DNA fingerprinting was used bySchlick et al. (1994) to prove that different patented strains of T. harzianum and their gamma-ray induced mutants can be distinguished by using oligonucleotides (CAC)5, (GTG)5, GGCATCGGCC, and M13 sequence GAGGGTGGCGGTTCT as PCR primers and the wild-type M13 phage oligonucleotides (GTG)5 and (CT)8 as hybridization probes. The authors investigated T. reesei and strains of T. harzianum including LC-1 (a biocontrol strain), as well as LC-2 and LC-3 (its
two irradiation mutant derivatives). As a result, discriminative fingerprint patterns were obtained, and all examined strains could be succesfully distinguished from each other.
The first technique that proved to be capable of distinguishing a commercially used biocontrol strain,T. harzianumT-39 used as a BCA againstB. cinerea, from otherTrichodermastrains was designed by Zimand et al. (1994). All examined Trichoderma strains could be distinguished based on their unique banding profiles generated by a set of 10 mer primers used in a random amplified polymorphic DNA (RAPD) procedure. This technique has some advantages when compared to morphology-based methods: it is less time-consuming and can be conducted using small amounts of DNA.
Instead of random sequences,Arisan-Atac et al. (1995)used wild-type M13 phage DNA GAGGTGGNGGNTCT, (GACA)4
and (GTG)5–previously used for RFLP fingerprinting—for the PCR generation of banding patterns, which was named RAPD fingerprinting. The authors analyzed 11 strains of T. viride, 2 strains of its teleomorph Hypocrea rufa and 9 isolates representing further Trichoderma species (T. citrinoviride, T. parceramosum, T. harzianum, T. koningii, T. longibrachiatum, T. piluliferum, T. polysporum, T. reesei, T. saturnisporum) which were screened for their antagonistic activities against Cryphonectria parasitica. The results showed that all three primers amplified 12–15 fragments characteristic to each strain.
To successfully differentiate the commercially used T.
harzianum strain C65—a strain with biocontrol activity against B. cinerea causing kiwifruit stem-end rot—from other closely related Trichoderma species including isolates of T.
koningii, T. viride, T. reesei, T. atroviride, and T. aureoviride.
Bowen et al. (1996) designed a restriction fragment length polymorphism (RFLP) assay using theHindIII enzyme. Southern blot hybridisation probes for the RFLP analysis were generated by RAPD using the DNA ofT. harzianumC65 as template. The method was capable to detect the BCA in the commonly isolated mycota. To facilitate the screening of a large number of samples, Dodd et al. (2004a)combined this isolate-specific RFLP marker with a dot-blot assay, which was used to monitor the spread and survival ofT. atrovirideC65 on leaves of kiwifruit both in shadehouse and in the orchard over two subsequent seasons. By this procedure, the authors have successfully proved that strain C65 is an ideal BCA, as it did not only survive but also spread to uninoculated trees and fruits, protecting them from post-harvest fruit rot.
Bulat et al. (1998)evaluated the ability of universally primed (UP) PCR and ITS-ribotyping to discriminate closely related TrichodermaandGliocladiumstrains and to identify markers for fast and reliable detection assays. Several isolates ofT. harzianum, T. hamatum, T. koningii, T. polysporum, T. virens, T. viride, and G. roseum were tested in a cross dot-blot hybridisation carried out using UP-PCR amplification products, and similarity among the strains was determined. The results suggested that the combination of UP-PCR and ITS-ribotyping techniques may become a valuable tool for intra-species distinction.
Forty-two isolates of T. harzianum and T. viride from Phillippine rice fields were analyzed by Cumagun et al. (2000) and characterized using rDNA-ITS1 analysis and UP-PCR with
the 16–21 mer primers L45, 3-2, AA2M2, AS4, AS15, AS15inv, L21, Fok1, L15/AS19, and 0.3-1. Strains were characterized to the species level based on UP-PCR banding profiles and the length andSau3A restriction patterns of the ribosomal DNA. The authors have concluded that UP-PCR combined with the analysis of rDNA-ITS1 is a useful tool for the identification of isolates that are indistinguishable on the basis of their morphology. The combination of UP-primers L21 and Fok1 could distinguish the promising biocontrol strain T. harzianum 94-016 from other Trichodermaisolates, therefore having the potential to be used for monitoring purposes.
Lübeck and Jensen (2002) combined dilution plating and UP-PCR with the above listed set of primers for monitoring the commercial biocontrol Trichoderma strains T. harzianum KRL-AG2 (Bio-Trek 22G), Supresivit (Supresivit), T39 (TRICHODEX), ATCC20476 (Binab T, type 1) and Promot 1 (Promot),T. polysporumATCC20475 (Binab T, type 2), and T. koningii Promot 2 (Promot). Several primers generated characteristic banding patterns for each strain, allowing the commercially used strains to be differentiated from others. The results have shown that this method is suitable for monitoring the species composition in different glasshouses. The spread of the biocontrol strains could also be monitored, and the necessity of reintroduction could be easily detected.
Freeman et al. (2002) conducted arbitrarily primed PCR (ap-PCR) in an experiment to assess the use of the strains T.
harzianum T39 (TRICHODEX) as well as T161 and T166 for controllingB. cinereaandColletotrichum acutatumin strawberry, and to investigate the population survival of these 3T. harzianum strains as well asT. asperellumT-105 on strawberry leaves. The primers (GACAC)3, (GACA)4, (TGTC)4, and (CAG)5 used for ap-PCR were derived from microsatellite or repeat sequences.
The PCR banding patterns generated by ap-PCR proved to be suitable for grouping the isolates at the species level.
Fanti et al. (2003) evaluated fingerprinting with random, minisatellite and microsatellite primers for the environmental monitoring of two promising biocontrol Trichoderma strains effective againstCytosporacanker of peach and found that the M13 minisatellite revealed unique fingerprints for both strains.
Four months after the application to the soil under the canopy of peach trees, the antagonists could be recovered from above plant parts but not from soil, while after 1 year they were lost.
Naef et al. (2006) used a microsatellite-based method to determine the fungal biomass in decomposing plant material.
PCR was carried out with fluorescent primers, which co-amplify fragments of different length from the reference and target strains. The primer pair MS-Ta4 generated a 132 or 142 bp long fragment from the investigated Trichoderma strains. T.
atrovirideP1 and T. harzianumRAC616 possess the alleles of 132 bp (13 TG repeats) and 142 bp (18 TG repeats), respectively.
The fragments were separated by a capillary sequencer with fluorescent detection and the biomass of the fungi could be calculated by target/reference ratio of the fluorescent signal.
The RAPD-PCR method combined with benomyl resistance improved the identification of biocontrol strains from field samples.Tachapattaworakul et al. (2008)used this technique for monitoring ofT. atroviridestrains CBS 470.94, CBS 350.93, L2,
and OB. The RAPD procedure with primer OPC8 generated a fragment of 3,000 bp specific to the biocontrol strain L2.
This strain showed tenfold level of resistance to benomyl when compared to the other strains examined, which made its isolation from soil easier. The applied method allowed the recovery and identification of strain L2 from the soil 4 months after its inoculation.
Although the PCR-based fingerprinting tools represent simple and flexible methods, they are not always strain-specific and their reproducibility may be affected by the low annealing temperature and short primer size (Hermosa et al., 2001).
However, strain-specific fragments generated by such techniques have the potential to be converted into monitoring markers based on SCARs (sequence characterized amplified regions) (Paran and Michelmore, 1993).
SPECIES-SPECIFIC PCR
The use of specific primers is a powerful tool for distinguishing individual Trichoderma species in agricultural environments.
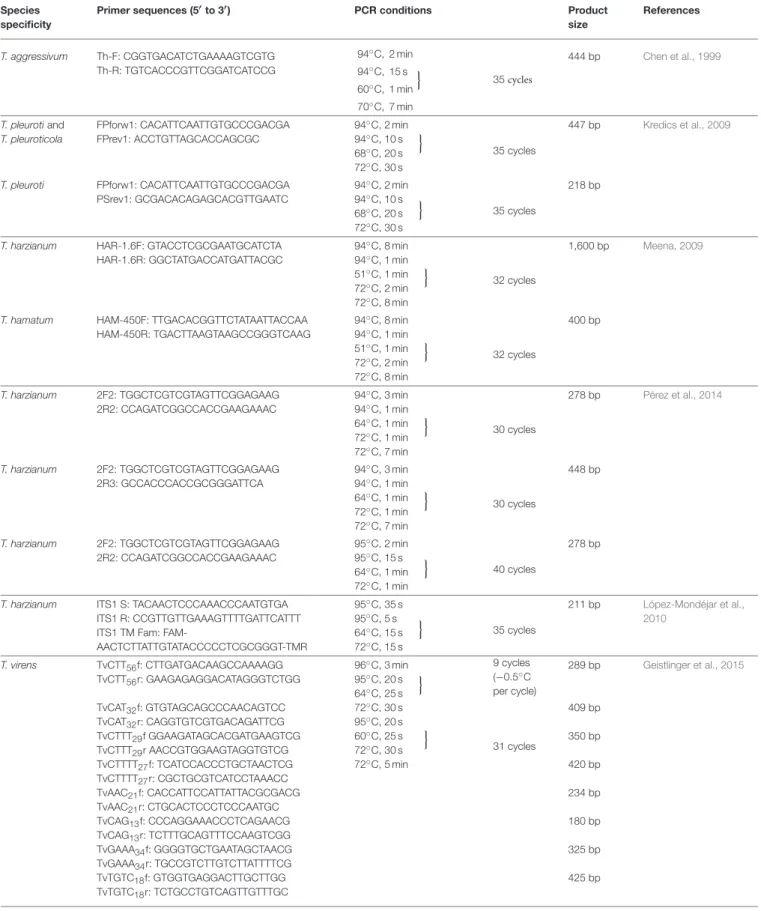
Chen et al. (1999)developed a species-specific primer-based test to identifyT. harzianumbiotypes Th2 and Th4 (redescribed later asT. aggressivumf.europaeumandT. aggressivumf.aggressivum, Samuels et al., 2002), causing green mold diseases onAgaricus bisporuscrops in Europe and North America, respectively. The specific primers were designed from the sequence of a 1,150 bp RAPD-PCR product generated by primer 232, which proved to be unique to T. aggressivum. The primer pair Th-F/Th- R (Table 1) gave no product from the DNA samples of T.
harzianum, several biocontrolTrichodermastrains, or from 31 other genera and species of fungi. The method can be used efficiently for the detection of T. aggressivum in green mold- affected mushroom compost.Kredics et al. (2009) described a multiplex PCR assay allowing the detection ofT. pleuroticolaand T. pleuroti(formerlyT. pleurotum) (Park et al., 2006), the green mold pathogens of oyster mushroom. Primers FPforw1, FPrev1, and PSrev1 (Table 1) were designed based on DNA sequences located within the 4th and 5th introns of the translation elongation factor 1α(tef1) gene. By the use of the three-primer set in a multiplex PCR, a 447 bp fragment is amplified from both T. pleurotiandT. pleuroticola, while in the case ofT. pleurotian additional, 218 bp specific product is also formed. The primers showed no cross reaction with other Trichoderma species or species from other fungal genera. The technique proved to be suitable for the detection ofT. pleurotiandT. pleuroticoladirectly from green mold-affectedPleurotussubstrate without the need of strain isolation, furthermore, it could also be used to demonstrate the presence ofT. pleuroticolain the growing substrates and on the surface of the fruiting bodies of wild oyster mushroom.
Meena (2009)described a technique for the detecion of the species T. harzianum and T. hamatum, known as potential biocontrol agents of different plant pathogenic fungi. The author designed SCAR primers (Table 1) based on the sequence of species-specific RAPD fragments. A similar method was developed by Pérez et al. (2014) (Table 1), which enables monitoring the growth and colonization ofT.cf.harzianumin
experimental communities, however, due to the cosmopolitan and diverse nature of the species the authors did not suggest the use of this tool for assessing the presence ofT.cf.harzianumin complex environmental samples such as soil.
In order to monitor and quantify T. harzianum, López- Mondéjar et al. (2010) designed a primer set and a TaqMan probe for the ITS region (Table 1). The quantity of ITS copies was calculated based on real-time PCR results and a correlation of 0.76 was obtained between ITS copy number and the fungal biomass determined by optical microscopy and image analysis.
The authors suggest that quantification of fungi in soil samples can be performed precisely using real-time PCR data. The primers and the probe were designed for pure cultures of T.
harzianum, however, they might be applied for the detection and quantification of the fungus in soils and other organic materials.
This method was successfully used by Beaulieu et al. (2011) to monitor the population ofT. harzianum in peat and green compost.
Geistlinger et al. (2015)introduced a tool based on the use of simple sequence repeats (SSRs) using Touchdown PCR to track and quantify the speciesT. virens. Primers were designed for 12 different loci. The results confirmed the root-endophytic lifestyle of this species in tomato plants: the fungal biomass in the plant tissues was quantified and co-colonization of the roots by different strains ofT. virenscould also be observed.
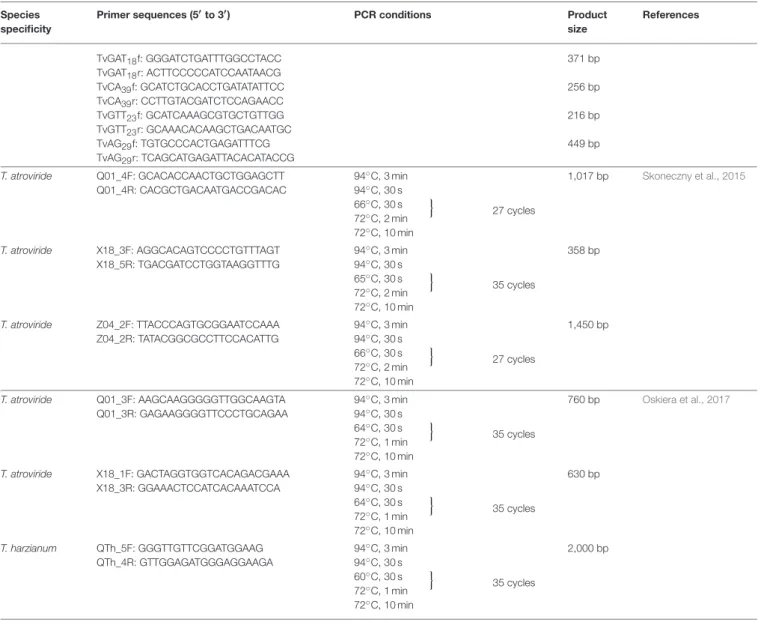
Skoneczny et al. (2015) examined the genetic diversity of environmental T. atroviride isolates using cleaved amplified polymorphic sequence (CAPS) markers. Following the amplification of RAPD regions by PCR primers (Table 1), the obtained amplicons were digested with defined restriction enzymes (BslI,DraI,TaqI). Three CAPS markers were found to distinguishT. atroviridefrom other species; therefore they have the potential to be used for the identification and monitoring of T. atroviride, particularly in environmental specimens.
Recently, Oskiera et al. (2017) described a multiplex PCR assay for monitoring the population levels ofT. atrovirideand T. harzianum applied as biopreparations in the field. For the detection in soil, a maximum of 3 primer pairs targeting markers TaQ (Q01_3F/Q01_3R) or TaX (X18_1F/X18_3R) (Table 1), the Trichoderma chitinase-specific chit42_1af/chit42_2ar (Kullnig- Gradinger et al., 2002) and ITS primers (5.8SR/LR6) specific to fungi were combined for the detection of T. atroviride, while two markers, TVD (TVD_If/TVD_Ir) (Bhat, 2007) and ThQ (QTh_5F/QTh_4R) (Table 1) were combined in multiplex-PCR forT. harzianumdetection. Primers targeting theβ-tubulin gene ofTrichodermaspp. (β-tub-F,β-tub-R) (Chen et al., 1999) served as a control. The results of the study confirmed the increased presence ofT. atrovirideandT. harzianumin the soil even 2 years after the application of biopreparations, while these species were not found in untreated soil samples (Oskiera et al., 2017).
DESIGN OF STRAIN-SPECIFIC PCR PRIMERS
Although the above mentioned species- and genus-specific detection tools are very valuable for studying the population
TABLE 1 |Examples of species-specific PCR protocols forTrichoderma.
Species specificity
Primer sequences (5′to 3′) PCR conditions Product
size
References
T. aggressivum Th-F: CGGTGACATCTGAAAAGTCGTG Th-R: TGTCACCCGTTCGGATCATCCG
94◦C, 2 min 94◦C, 15 s 60◦C, 1 min 70◦C, 7 min
o 35cycles
444 bp Chen et al., 1999
T. pleurotiand T. pleuroticola
FPforw1: CACATTCAATTGTGCCCGACGA FPrev1: ACCTGTTAGCACCAGCGC
94◦C, 2 min 94◦C, 10 s 68◦C, 20 s
o
72◦C, 30 s
35 cycles
447 bp Kredics et al., 2009
T. pleuroti FPforw1: CACATTCAATTGTGCCCGACGA PSrev1: GCGACACAGAGCACGTTGAATC
94◦C, 2 min 94◦C, 10 s 68◦C, 20 s 72◦C, 30 s
o
35 cycles
218 bp
T. harzianum HAR-1.6F: GTACCTCGCGAATGCATCTA HAR-1.6R: GGCTATGACCATGATTACGC
94◦C, 8 min 94◦C, 1 min 51◦C, 1 min 72◦C, 2 min 72◦C, 8 min
o
32 cycles
1,600 bp Meena, 2009
T. hamatum HAM-450F: TTGACACGGTTCTATAATTACCAA HAM-450R: TGACTTAAGTAAGCCGGGTCAAG
94◦C, 8 min 94◦C, 1 min 51◦C, 1 min 72◦C, 2 min 72◦C, 8 min
o
32 cycles
400 bp
T. harzianum 2F2: TGGCTCGTCGTAGTTCGGAGAAG 2R2: CCAGATCGGCCACCGAAGAAAC
94◦C, 3 min 94◦C, 1 min 64◦C, 1 min 72◦C, 1 min 72◦C, 7 min
o
30 cycles
278 bp Pérez et al., 2014
T. harzianum 2F2: TGGCTCGTCGTAGTTCGGAGAAG 2R3: GCCACCCACCGCGGGATTCA
94◦C, 3 min 94◦C, 1 min 64◦C, 1 min 72◦C, 1 min 72◦C, 7 min
o
30 cycles
448 bp
T. harzianum 2F2: TGGCTCGTCGTAGTTCGGAGAAG 2R2: CCAGATCGGCCACCGAAGAAAC
95◦C, 2 min 95◦C, 15 s 64◦C, 1 min 72◦C, 1 min
o
40 cycles
278 bp
T. harzianum ITS1 S: TACAACTCCCAAACCCAATGTGA ITS1 R: CCGTTGTTGAAAGTTTTGATTCATTT ITS1 TM Fam: FAM-
AACTCTTATTGTATACCCCCTCGCGGGT-TMR
95◦C, 35 s 95◦C, 5 s 64◦C, 15 s 72◦C, 15 s
o
35 cycles
211 bp López-Mondéjar et al., 2010
T. virens TvCTT56f: CTTGATGACAAGCCAAAAGG TvCTT56r: GAAGAGAGGACATAGGGTCTGG TvCAT32f: GTGTAGCAGCCCAACAGTCC TvCAT32r: CAGGTGTCGTGACAGATTCG TvCTTT29f GGAAGATAGCACGATGAAGTCG TvCTTT29r AACCGTGGAAGTAGGTGTCG TvCTTTT27f: TCATCCACCCTGCTAACTCG TvCTTTT27r: CGCTGCGTCATCCTAAACC TvAAC21f: CACCATTCCATTATTACGCGACG TvAAC21r: CTGCACTCCCTCCCAATGC TvCAG13f: CCCAGGAAACCCTCAGAACG TvCAG13r: TCTTTGCAGTTTCCAAGTCGG TvGAAA34f: GGGGTGCTGAATAGCTAACG TvGAAA34r: TGCCGTCTTGTCTTATTTTCG TvTGTC18f: GTGGTGAGGACTTGCTTGG TvTGTC18r: TCTGCCTGTCAGTTGTTTGC
96◦C, 3 min 95◦C, 20 s 64◦C, 25 s
o
72◦C, 30 s 95◦C, 20 s 60◦C, 25 s 72◦C, 30 s 72◦C, 5 min
o
9 cycles (−0.5◦C per cycle)
31 cycles
289 bp
409 bp 350 bp 420 bp 234 bp 180 bp 325 bp 425 bp
Geistlinger et al., 2015
(Continued)
TABLE 1 |Continued Species
specificity
Primer sequences (5′to 3′) PCR conditions Product
size
References
TvGAT18f: GGGATCTGATTTGGCCTACC TvGAT18r: ACTTCCCCCATCCAATAACG TvCA39f: GCATCTGCACCTGATATATTCC TvCA39r: CCTTGTACGATCTCCAGAACC TvGTT23f: GCATCAAAGCGTGCTGTTGG TvGTT23r: GCAAACACAAGCTGACAATGC TvAG29f: TGTGCCCACTGAGATTTCG TvAG29r: TCAGCATGAGATTACACATACCG
371 bp 256 bp 216 bp 449 bp T. atroviride Q01_4F: GCACACCAACTGCTGGAGCTT
Q01_4R: CACGCTGACAATGACCGACAC
94◦C, 3 min 94◦C, 30 s 66◦C, 30 s 72◦C, 2 min 72◦C, 10 min
o
27 cycles
1,017 bp Skoneczny et al., 2015
T. atroviride X18_3F: AGGCACAGTCCCCTGTTTAGT X18_5R: TGACGATCCTGGTAAGGTTTG
94◦C, 3 min 94◦C, 30 s 65◦C, 30 s 72◦C, 2 min 72◦C, 10 min
o
35 cycles
358 bp
T. atroviride Z04_2F: TTACCCAGTGCGGAATCCAAA Z04_2R: TATACGGCGCCTTCCACATTG
94◦C, 3 min 94◦C, 30 s 66◦C, 30 s 72◦C, 2 min 72◦C, 10 min
o
27 cycles
1,450 bp
T. atroviride Q01_3F: AAGCAAGGGGGTTGGCAAGTA Q01_3R: GAGAAGGGGTTCCCTGCAGAA
94◦C, 3 min 94◦C, 30 s 64◦C, 30 s 72◦C, 1 min 72◦C, 10 min
o
35 cycles
760 bp Oskiera et al., 2017
T. atroviride X18_1F: GACTAGGTGGTCACAGACGAAA X18_3R: GGAAACTCCATCACAAATCCA
94◦C, 3 min 94◦C, 30 s 64◦C, 30 s 72◦C, 1 min 72◦C, 10 min
o
35 cycles
630 bp
T. harzianum QTh_5F: GGGTTGTTCGGATGGAAG QTh_4R: GTTGGAGATGGGAGGAAGA
94◦C, 3 min 94◦C, 30 s 60◦C, 30 s 72◦C, 1 min 72◦C, 10 min
o
35 cycles
2,000 bp
dynamics or epidemiology of certainTrichodermaspecies, due to the lack of strain specificity they are not the most reliable options for the environmental monitoring of particular biocontrol strains.
Nucleic acid-based endogenous markers are unique DNA sequences distinguishing a particular strain from all others.
Such markers have the potential to be exploited in highly specific and sensitivite PCR-based assays. SCARs based on strain-specific fragments generated by fingerprinting methods allow the development of conventional and real-time PCR- based strategies for the differentiation of a particular biocontrol Trichodermastrain from other strains ofTrichodermapresent in the field environment, even from those belonging to the same species.
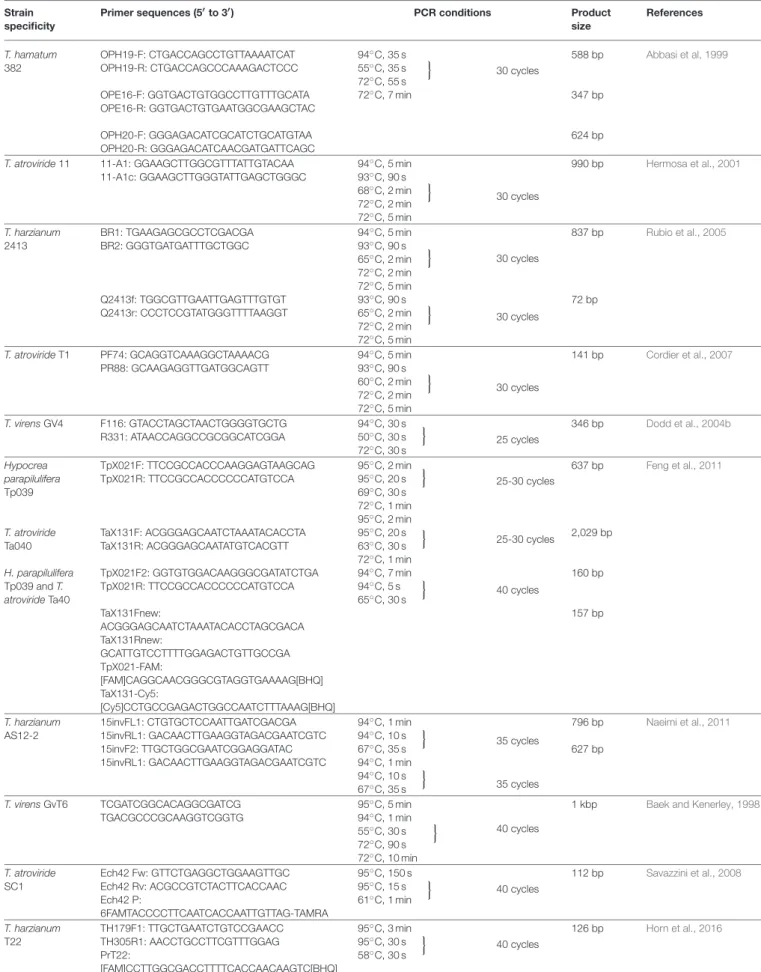
The first strain-specific SCAR marker-based tool of Trichoderma monitoring was developed by Abbasi et al (1999)for the precise detection and monitoring ofT. hamatum
strain 382, a BCA effective in compost-amended substrates. The authors performed RAPD analysis and identified 3 diagnostic fragments of 0.35, 0.6, and 0.65 kb in the patterns generated by primers OPE-16, OPH-19, and OPH20, respectively. The fragments were cloned into vector, sequenced, and primer pairs were designed for each of them (Table 2). The resulting 3 SCAR primer-pairs could be successfully used to indicate the presence ofT. hamatum 382 in 9 different compost, soil and potting mix samples fortified with the BCA, while 274 Trichoderma isolates deriving from 9 non-fortified samples gave negative results. The method proved to be applicable also for the detection of the SCAR fragments from crude DNA preparations extracted directly from compost-amended substrates.
The same strategy was applied by Hermosa et al. (2001), who aimed to develop a PCR technique for the monitoring of the patented T. atroviride 11 strain showing biocontrol
TABLE 2 |PCR-based tools developed for the strain-specific monitoring ofTrichodermastrains.
Strain specificity
Primer sequences (5′to 3′) PCR conditions Product
size
References
T. hamatum 382
OPH19-F: CTGACCAGCCTGTTAAAATCAT OPH19-R: CTGACCAGCCCAAAGACTCCC OPE16-F: GGTGACTGTGGCCTTGTTTGCATA OPE16-R: GGTGACTGTGAATGGCGAAGCTAC OPH20-F: GGGAGACATCGCATCTGCATGTAA OPH20-R: GGGAGACATCAACGATGATTCAGC
94◦C, 35 s 55◦C, 35 s 72◦C, 55 s 72◦C, 7 min
o
30 cycles
588 bp
347 bp
624 bp
Abbasi et al, 1999
T. atroviride11 11-A1: GGAAGCTTGGCGTTTATTGTACAA 11-A1c: GGAAGCTTGGGTATTGAGCTGGGC
94◦C, 5 min 93◦C, 90 s 68◦C, 2 min 72◦C, 2 min 72◦C, 5 min
o
30 cycles
990 bp Hermosa et al., 2001
T. harzianum 2413
BR1: TGAAGAGCGCCTCGACGA BR2: GGGTGATGATTTGCTGGC
Q2413f: TGGCGTTGAATTGAGTTTGTGT Q2413r: CCCTCCGTATGGGTTTTAAGGT
94◦C, 5 min 93◦C, 90 s 65◦C, 2 min 72◦C, 2 min 72◦C, 5 min
o
93◦C, 90 s 65◦C, 2 min 72◦C, 2 min 72◦C, 5 min
o
30 cycles
30 cycles
837 bp
72 bp
Rubio et al., 2005
T. atrovirideT1 PF74: GCAGGTCAAAGGCTAAAACG PR88: GCAAGAGGTTGATGGCAGTT
94◦C, 5 min 93◦C, 90 s 60◦C, 2 min 72◦C, 2 min 72◦C, 5 min
o
30 cycles
141 bp Cordier et al., 2007
T. virensGV4 F116: GTACCTAGCTAACTGGGGTGCTG R331: ATAACCAGGCCGCGGCATCGGA
94◦C, 30 s 50◦C, 30 s 72◦C, 30 s
o
25 cycles
346 bp Dodd et al., 2004b
Hypocrea parapilulifera Tp039
T. atroviride Ta040 H. parapilulifera Tp039 andT.
atrovirideTa40
TpX021F: TTCCGCCACCCAAGGAGTAAGCAG TpX021R: TTCCGCCACCCCCCATGTCCA
TaX131F: ACGGGAGCAATCTAAATACACCTA TaX131R: ACGGGAGCAATATGTCACGTT TpX021F2: GGTGTGGACAAGGGCGATATCTGA TpX021R: TTCCGCCACCCCCCATGTCCA TaX131Fnew:
ACGGGAGCAATCTAAATACACCTAGCGACA TaX131Rnew:
GCATTGTCCTTTTGGAGACTGTTGCCGA TpX021-FAM:
[FAM]CAGGCAACGGGCGTAGGTGAAAAG[BHQ]
TaX131-Cy5:
[Cy5]CCTGCCGAGACTGGCCAATCTTTAAAG[BHQ]
95◦C, 2 min 95◦C, 20 s o 69◦C, 30 s 72◦C, 1 min 95◦C, 2 min 95◦C, 20 s 63◦C, 30 s
o
72◦C, 1 min 94◦C, 7 min 94◦C, 5 s 65◦C, 30 s
o
25-30 cycles
25-30 cycles
40 cycles
637 bp
2,029 bp
160 bp
157 bp
Feng et al., 2011
T. harzianum AS12-2
15invFL1: CTGTGCTCCAATTGATCGACGA 15invRL1: GACAACTTGAAGGTAGACGAATCGTC 15invF2: TTGCTGGCGAATCGGAGGATAC 15invRL1: GACAACTTGAAGGTAGACGAATCGTC
94◦C, 1 min 94◦C, 10 s 67◦C, 35 s
o
94◦C, 1 min 94◦C, 10 s 67◦C, 35 s
o
35 cycles
35 cycles
796 bp 627 bp
Naeimi et al., 2011
T. virensGvT6 TCGATCGGCACAGGCGATCG TGACGCCCGCAAGGTCGGTG
95◦C, 5 min 94◦C, 1 min 55◦C, 30 s 72◦C, 90 s 72◦C, 10 min
o 40 cycles
1 kbp Baek and Kenerley, 1998
T. atroviride SC1
Ech42 Fw: GTTCTGAGGCTGGAAGTTGC Ech42 Rv: ACGCCGTCTACTTCACCAAC Ech42 P:
6FAMTACCCCTTCAATCACCAATTGTTAG-TAMRA
95◦C, 150 s 95◦C, 15 s 61◦C, 1 min
o 40 cycles
112 bp Savazzini et al., 2008
T. harzianum T22
TH179F1: TTGCTGAATCTGTCCGAACC TH305R1: AACCTGCCTTCGTTTGGAG PrT22:
[FAM]CCTTGGCGACCTTTTCACCAACAAGTC[BHQ]
95◦C, 3 min 95◦C, 30 s 58◦C, 30 s
o 40 cycles
126 bp Horn et al., 2016
activity against plant pathogenic fungi including Acremonium cucurbitacearum, Aphanomyces cochlioides, Phoma betae, and R. solani. RAPD analysis with primer OPF10 revealed two fragments (11-A1: 996 bp, 11-A2: 361 bp) from the DNA of T. atroviride 11, which were absent from the closely related T. atroviride260 strain. The fragments were cloned, sequenced and subjected to nucleotide and protein BLAST analysis, which revealed no significant homology. Although primers 11-A1 and 11-A1c (Table 2) designed based on the sequence of the SCAR 11-A1 fragment proved to distinguish strainT. atroviride11 from 26 other Trichodermastrains belonging to 7 species (Hermosa et al., 2001), later it turned out that they were not strain- specific as they also yielded the PCR product from 5 of the 9 T. atroviride strains examined by Cordier et al. (2007). In a subsequent study (Rubio et al., 2005), the same primer pair was tested against the DNA of further 27Trichodermastrains, and it was also found to amplify a larger, 1.5 kb fragment from T. harzianum strain 2413. This fragment was cloned, and the primers BR1 and BR2 (Table 2), amplifying a 837 bp fragment fromT. harzianum2413 were designed based on the sequence information of the SCAR-fragment. The primers were tested on the DNA from 27 Trichodermastrains and 22 untreated soils, and proved to be specific to T. harzianum 2413. In addition, primers Q2413f and Q2413r (Table 2) along with a TaqMan fluorogenic probe were also designed based on the sequence of the 837 bp SCAR marker, in order to improve the sensitivity of the monitoring tool by the application of real-time PCR.
The developed assay was able to quantify the DNA of the BCA from sterile soil fortified with 108 conidia/g of soil but failed to detect the strain from a Trichoderma mixture introduced into the soil (Rubio et al., 2005). In a similar study, Cordier et al.
(2007) developed a SCAR-based real-time PCR to specifically identify and study the population dynamics of T. atroviride strain T1. The authors of this study also applied the primers 11- A1 and 11-A1c to generate a fragment from strain T1, which was converted to a SCAR marker by sequence analysis. Among the 3-primer sets designed for the SCAR fragment, the primer pair PF74/PR88 (Table 2) generated the expected amplicon of 141 bp only from strains T1 and 1571. RAPD and AFLP (amplified fragment length polymorphism) fingerprints have shown that these two strains are identical for all the molecular characters tested and are therefore probably the parallel deposits of the same isolate. The same primer pair was used to develop a real-time PCR assay with SYBR Green detection, which proved to be applicable for monitoring the population dynamics of strain T1 in complex soil environments: detection of the BCA was possible at levels of 103 CFU/g of nonsterile soil containing autochthonous Trichoderma populations (Cordier et al., 2007).
Dodd et al. (2004b) also used RAPD, and with primer OPAW04 they could identify a fragment unique to T. virens GV4, a strain with biocontrol abilities against both the vegetable pathogen S. sclerotiorum and the onion white rot pathogen Sclerotium cepivorum. Among the primers designed based on the sequence of the fragment, the primer pair F116/R331 (Table 2) gave the most consistent results during tests with further 5 T. virens isolates. The test was developed further
to a duplex PCR system by including ITS4 and ITS5 (White et al., 1990), two universal primers targeting the ITS region as positive control to detect amplifiable fungal DNA, and was able to detect strain GV4 down to a concentration of 10 spores per gram nonsterile agricultural soil (Dodd et al., 2004b).
To quantify the presence of the biocontrol strainsHypocrea parapilulifera Tp039 and T. atroviride Ta040, Feng et al.
(2011) developed primer pairs for strain-specific SCAR markers identified by RAPD primers OPX02 for Tp039 and OPX13 for Ta040. The primer pairs TpX021F/TpX021R and TaX131R/TaX131R amplified a 637 and a 2,029 bp fragment from strains Tp039 and Ta040, respectively (Table 2). Additional primers replacing the original forward or reverse primer were also designed. The TpX021F2/TpX021R combination amplifying a 160 bp fragment and the TaX131F/TaX131R2 combination forming a 157 bp fragment, discriminated Ta040 and Tp09 from all other strains tested. Fluorophore-labeled probes distinguishing the two strains were also designed and succesfully used in combination with the SCAR primers in multiplex real-time PCR for the examination of artificially inoculated soils as well as samples derived from a golf green which has been treated with a product containing both strains.
The results revealed that the two biocontrol strains were not able to establish on the golf green and its surrounding area (Feng et al., 2011).
Instead of RAPD, Naeimi et al. (2011) performed UP- PCR with 5 universal primers both separately, and in pairwise combinations in order to search for endogenous markers specific toT. harzianum AS12-2, a strain with the potential to control the sheath blight disease of rice caused by R. solani.
UP primers are primarily targeting more variable intergenic regions of the genome, therefore, this technique is especially useful in detecting intraspecific variations (Bulat et al., 1998).
The application of UP primers AS15inv, AA2M2, as well as their pairwise combinations resulted in the amplification of unique fragments (905, 684, and 842 bp, respectively) from the genomic DNA of the T. harzianum AS12-2 strain. The sequences of the cloned fragments were used to design 14 oligonucleotide primers. Two primer pairs, 15invFL1/15invRL1 and 15invF2/15invRL1 (Table 2), designed from the sequence of the 905 bp SCAR marker, amplified fragments of the expected size (796 and 627 bp, respectively) from the DNA of T.harzianum AS12-2, but not from the DNA of further 111 T. harzianum isolates tested or of 84 further strains belonging to 5 other Trichoderma species occurring in rice fields (Naeimi et al., 2011).
Specific PCR markers for the monitoring of particular strains of a species can also be developed from sequences with known functions. In genetically modified strains, the sequences of the introduced genes may serve as targets of primer development.
Baek and Kenerley (1998)developed a quantitative PCR method for the detection and quantitation of the T. virens strain GvT6, which carries the bacterial organophosphate degrading (opd) gene, therefore being potentially applicable for the bioremediation of soils contaminated with organophosphate pesticides. The assay based on the amplification of an opd
fragment with opd-specific primers can be quantified by the application of a DNA standard containing the 1.5 kbgpd gene with 20 bp opd primer-binding sequences at both ends. The detection limit of the PCR assay from soil samples was 10–
1,000 times lower than that of traditional dilution plating (Baek and Kenerley, 1998). The same Q-PCR method was used by Weaver et al. (2005) for a genetically modified derivative of T. virens Gv29-8, constructed by transformation with plasmid pCL1 carrying the hygB and the opd genes. The authors evaluated the genetic stability and ecological persistence of the strain over 243 days in soil mesocosms and found that both the genetically modified and the wild type strain were able to rapidly and efficiently colonize freshly added substrates even after the long-term incubation, indicating a high level of responsiveness (Weaver et al., 2005). A similar monitoring tool has been developed for studying the environmental fate of T. reesei strain QM6A, an efficient cellulase producer of biotechnological significance (Providenti et al., 2004). The strain was transformed with the hygromycin B resistance gene and specifically monitored in intact soil-core microcosms with primers targeting the introduced marker. Results of this study indicated that T. reesei may persist for at least 2 seasons in soil followed by its release from fermentation plants as spent biomass.
The increasing availability of Trichoderma sequences with known functions allows the identification of single-nucleotide polymorphisms applicable for the design of strain-specific monitoring tools. Savazzini et al. (2008) used the ech42 endochitinase gene sequence to monitorT. atroviridestrain SC1, a BCA against root rot pathogens, primarilyArmillariaspecies in soils of orchards and vineyards, for which the development of RAPD-based SCAR markers was unsuccessful. The authors amplified the target gene from the BCA with primers Ech42 Fw and Ech42 Rv (Table 2), and compared its sequence with 34 other ech42 sequences, which was followed by the design of the TaqMan probe Ech42 P (Table 2) targeting 2 nucleotide mutations within the first intron of theech42gene of strain SC1.
A second primer set and TaqMan probe to a common sequence of tga3, a gene encoding the G proteinαsubunit, were also designed to verify the presence ofTrichodermaDNA in specificity tests and microcosm experiments. The detection and quantification limits of the resulting low throughput time, real-time PCR procedure were 6,000 and 20,000 haploid genome copies per gram of soil, suggesting that the method could be useful to monitor the fate of T. atrovirideSC1 applied as an open-field BCA (Savazzini et al., 2008). This monitoring tool was incorporated into an intact soil microcosm technique developed to evaluate both the survival and the vertical dispersal of the SC1 strain (Longa and Pertot, 2009).
Another study applying this monitoring tool revealed that strain SC1 tolerated both low temperature values during winter and fluctuations of humidity in soil after applications in a vineyard, could move beyond the treated soil area, migrated passively to the lower leaves of grapevine and became an integral part of the local microbiota (Longa et al., 2009).
Horn et al. (2016) performed genome mining to identify putative, new regions enabling the differentiation of various T. harzianumstrains, and subsequently developed a multiplex
Q-PCR assay for the monitoring of T. harzianum strain T22, an efficient BCA againstCalonectria pauciramosa. The region upstream the coding part of the L-amino acid oxidase gene aox1proved to have sufficient genetic variation to discriminate between different strains of T. harzianum including T22, therefore a primer pair was designed for this region along with TaqMan probes specific to particularT. harzianumstrains including T22 (Table 2). Strain T22 could be successfully monitored by the developed Q-PCR assay on the roots of greenhouse-cultivated tomato plants inoculated with the BCA (Horn et al., 2016).
The main problem during the use of DNA-based, strain- specific monitoring tools for the direct tracking ofTrichoderma strains in agricultural environments is the difficulty in reproducing the results, which may be due to the presence of PCR inhibitors, such as humic acids and tannins—co-extracted with nucleic acids in the case of soil environments—and the presence of large amounts of DNA from other microorganisms in the examined habitats (Dodd et al., 2004b; Cordier et al., 2007). The inhibition of PCR in combination with the varying efficiency of DNA extraction between conidia and mycelia (Fredricks et al., 2005) may lead to an underestimation (Cordier et al., 2007), while the lack of discrimination between DNA from living and dead cells may result in an overestimation of the populations present (Pujol et al., 2006). It cannot be excluded either that a SCAR marker may be lost during field trials, however, this problem can be circumvented by the development and application of several independent strain-specific markers for the monitoring of a single strain (Hermosa et al., 2001).
“OMICS” APPROACHES IN THE SERVICE OF TRICHODERMA MONITORING
Since the release of the first complete Trichoderma genome sequence in 2008 belonging to the industrially important cellulase producer T. reesei (Martinez et al., 2008) and its subsequent comparative analysis with the genomes of the biocontrol species T. virensand T. atroviride(Kubicek et al., 2011; Schmoll et al, 2016), the number of full genome sequences publicly available in databases forTrichodermastrains is growing rapidly (Baroncelli et al., 2015, 2016; Kuo et al., 2015; Shi-Kunne et al., 2015;
Compant et al., 2017), which opens the way for using comparative genome analysis to identify specific endogenous markers. An example is the study ofMahfooz et al. (2016), who performed a comparativein silicoanalysis of SSR sequences in the genomes of T. reeseiand three biocontrol species of the genus, and developed 6-6 primer pairs for the amplification of polymorphic markers fromT. atrovirideand T. harzianum. In another study, Lange et al. (2016)compared the genome sequence of the remarkably effective biocontrol agentT.cf. atroviridestrain LU132 with that of the less efficient strainT.cf.atrovirideLU140 and identified a single functional nucleotide polymorphism (SNP), which proved useful for the development of an RFLP technique applicable for the differentiation of the two strains from each other.
The approach of full metagenome sequencing in the case of samples from agricultural habitats has the potential to