biomolecules
Article
Changes in Peptaibol Production of Trichoderma Species during In Vitro Antagonistic Interactions with Fungal Plant Pathogens
Parisa Rahimi Tamandegani1, Tamás Marik2, Doustmorad Zafari1, Dóra Balázs2, Csaba Vágvölgyi2 , András Szekeres2 and LászlóKredics2,*
1 Department of Plant Protection, Bu Ali Sina University, Hamedan 6517833131, Iran;
parisa_rahimi2003@yahoo.com (P.R.T.); zafari_d@basu.ac.ir (D.Z.)
2 Department of Microbiology, Faculty of Science and Informatics, University of Szeged, H-6726 Szeged, Hungary; mariktamas88@gmail.com (T.M.); dora.balazs91@gmail.com (D.B.);
csaba@bio.u-szeged.hu (C.V.); andras.j.szekeres@gmail.com (A.S.)
* Correspondence: kredics@bio.u-szeged.hu
Received: 22 March 2020; Accepted: 5 May 2020; Published: 7 May 2020
Abstract: Trichoderma species are widely used as biofungicides for the control of fungal plant pathogens. Several studies have been performed to identify the main genes and compounds involved inTrichoderma–plant–microbial pathogen cross-talks. However, there is not much information about the exact mechanism of this profitable interaction. Peptaibols secreted mainly byTrichodermaspecies are linear, 5–20 amino acid residue long, non-ribosomally synthesized peptides rich inα-amino isobutyric acid, which seem to be effective in Trichoderma–plant pathogenic fungus interactions.
In the present study, reversed phase (RP) high-performance liquid chromatography (HPLC) coupled with electrospray ionization (ESI) mass spectrometry (MS) was used to detect peptaibol profiles of Trichodermastrains during interactions with fungal plant pathogens. MS investigations of the crude extracts deriving from in vitro confrontations ofTrichoderma asperellumandT. longibrachiatumwith different plant pathogenic fungi (Fusarium moniliforme,F. culmorum,F. graminearum,F. oxysporum species complex,Alternaria solaniandRhizoctonia solani) were performed to get a better insight into the role of these non-ribosomal antimicrobial peptides. The results revealed an increase in the total amount of peptaibols produced during the interactions, as well as some differences in the peptaibol profiles between the confrontational and control tests. Detection of the expression level of the peptaibol synthetasetex1by qRT-PCR showed a significant increase inT. asperellum/R. solani interaction in comparison to the control. In conclusion, the interaction with plant pathogens highly influenced the peptaibol production of the examinedTrichodermastrains.
Keywords: confrontation test;Trichoderma; phytopathogen; mycoparasitism; peptaibol
1. Introduction
Various approaches are used to reduce the economic and aesthetic damages caused by plant pathogens, but most of them are not efficient enough. Due to microbial resistance to traditional antibiotics and chemical compounds, as well as the environmental and health risks of chemicals, scientists’ attempts are focused on finding safe and eco-friendly alternatives. In recent years, biological-based methods have been noticed to deal with these challenges [1]. The application of biofertilizers and biopesticides is a promising alternative for plant protection against the attack of different pathogens [2].Trichodermaspp.
are popular due to their visible direct effects on fungal pathogens and their capability to induce resistance in plants [3]. The genusTrichodermawas identified by Christiaan Hendrik Persoon in 1794, but its
Biomolecules2020,10, 730; doi:10.3390/biom10050730 www.mdpi.com/journal/biomolecules
Biomolecules2020,10, 730 2 of 19
biocontrol ability as a mycoparasite onRhizoctoniaandSclerotiniawas described firstly by Weindling in 1934. Now, more than 300Trichodermaspecies have been identified morphologically and genetically [4,5].
Trichoderma species (Hypocreales, Ascomycota) are widespread in different ecosystems [2].
During the past years, several studies have identified the mycoparasitic responses ofTrichoderma species, including the direct attack and lysis of the plant pathogens [6].Trichodermaspecies are powerful tools for the purposes of biological control due to the production and secretion of lytic cell-wall-degrading enzymes (CWDEs) [7], root colonization, nutrient competition, the induction of systemic resistance in plants [8] and the production of a broad spectrum of secondary metabolites such as peptaibols [9].
Investigation of gene expressions during mycoparasitic interactions withRhizoctonia solaniproved the upregulation of genes related to metabolism, especially the production of antibiotic metabolites [10].
Peptaibols are linear peptides with 5 to 20 amino acid residues produced by peptaibol synthetases, which are non-ribosomal peptide synthetase (NRPS) enzymes [11,12]. The presence of the unusual amino acidsα-aminoisobutyric acid (Aib) and isovaline (Iva) means that the hydroxylated C-terminus and the N-terminal acetylated amino acids are unique characteristics of this group of antimicrobial peptides [11]. The structure of the NRPS enzymes is responsible for the amino acid order of the peptaibols [13]. The modules of the NRPSs are semiautonomous and capable of the activation, elongation and assembly of the amino acids. These modules contain adenylation (A), thiolation (T) and condensation (C) domains, which together represent one minimal repeating unit of the NRPSs [12,14].
The order of these units finally determines the primary structure of the peptaibols. The first reported TrichodermaNRPS wastex1described fromTrichoderma virens[15]. AlthoughTrichodermaspecies are known as the main peptaibol producers, peptaibols have also been reported fromAcremonium,Tylopilus, Boletus,Bionectria,Paecilomyces,Emericellopsis,Cephalosporium,Stilbella,GliocladiumandTolypocladium species [16].
Antimicrobial activities of peptaibols were reported against a number of fungi and Gram-positive bacteria, as well as viruses. Trichorzianines A and B [17], trichorzins HA and harzianines HC [18] from T. harzianum, trichokonins fromT. koningii[19], tricholongins BI, BII [20] and longibrachins [21] from T. longibrachiatum, or trichotoxins fromT. asperellum[22] are some examples showing the antimicrobial activity ofTrichodermapeptaibols.
Trichotoxins are 18-residue peptaibols with trichotoxin-A-40s being firstly identified fromT. viride NRRL5242 [23]. Later, trichotoxin-A-50s and other trichotoxin sequences were also described from T. viride[24] andT. harzianum[25], respectively. Brückner and Przybylski [23] classified the trichotoxins into the two subgroups of neutral (A-50) and acidic (A-40) trichotoxins separated based on their Gln17/Glu17 residue which defines the molecule to be neutral or acidic. Longibrachins are 20-residue peptaibols identified fromT. longibrachiatum[26] which are also classified based on the Gln18/Glu18 exchange into neutral (longibrachin-A) and acidic (longibrachin-B) subgroups.
The mode of action of peptaibols is based on their physical, chemical and biological properties [11].
They are capable of forming voltage-dependent ion channels in plasma membranes [27], increasing membrane permeability [28] and consequently inducing cell death by cytoplasmic leakage [29].
The exogenous application of peptaibols enhances plant resistance against pathogens via triggering plant defence responses [30], e.g., trichokonins induced resistance in tobacco against tobacco mosaic virus (TMV) [31]. Moreover, on cucumber seedlings, the application of two synthetic 18-residue peptaibol isoforms (TvBI and TvBII) fromT. virensGv29-8 triggered responses of induced systemic resistance against leaf pathogenic bacteria, suggesting that 18-mer peptaibols act as inducers of non-cultivar-specific defence responses [32].
The synergistic effect between peptaibols and cell wall hydrolytic enzymes ofTrichodermaduring the antagonistic reaction againstBotrytis cinereahas also been reported [33,34]. These data showed that peptaibols inhibitβ-glucan synthase activity in the host fungus and act synergistically with β–glucanases; therefore, the destruction of the pathogen cell walls byTrichodermaspecies can be explained. In addition, peptaibols were considered as plant defense elicitors [35].
Biomolecules2020,10, 730 3 of 19
In this study, peptaibol profiles were analyzed during Trichoderma–fungal plant pathogen interactions in order to investigate the role of peptaibols in the antagonistic effect ofTrichodermaspecies.
2. Materials and Methods
2.1. Fungal Strains and Culture Conditions
T. asperellumIRAN 3062C andT. longibrachiatum IRAN 3067C were derived from the Fungal Collection of Bu-Ali Sina University of Hamedan/Iran (BASUFC). To confirm the identity of the species, the translation elongation factor 1 alpha gene (tef1) was amplified and sequenced as described by Druzhinina et al. [36]. The amplified fragments contain partial sequence of the 4th large intron (first 207 nucleotides), the complete sequence of the 5th exon and partial sequence of the 5th short intron (last 71 nucleotides) oftef1. The 399 bp fragment ofT. asperellumIRAN 3062C showed 100%
sequence identity withT. asperellumstrains GJS 06-294 [37] and NAIMCC-F-1763 [38], and the fragment ofT. longibrachiatumIRAN 3067C withT. longibrachiatumstrain CNM-CM 1798 [36].
Fusarium moniliforme SZMC 11046, F. culmorum SZMC 6239J, F. graminearum SZMC 6236J, F. oxysporumspecies complex (FOSC) SZMC 6237J,Alternaria solaniSZMC 6241J andRhizoctonia solani SZMC 21048 strains were derived from the Szeged Microbiology Collection (SZMC,www.szmc.hu).
Different Trichoderma–plant pathogen combinations were used for direct dual interaction assays.
All isolates were maintained on yeast extract-glucose agar media (10 g L−1glucose, 10 g L−1KH2PO4, 5 g L−1yeast extract, 20 g L−1agar).
2.2. Direct Confrontation Assays
In vitro antagonistic properties of the twoTrichodermastrains were investigated based on the method described by Szekeres et al. [39]. Briefly, the experiments were performed in three parallel inoculations forTrichoderma–plant pathogenic fungus combinations. Plates containing plant pathogenic fungi or theTrichodermastrains (T. asperellumIRAN 3062C orT. longibrachiatumIRAN 3067C) alone were used as controls. Single agar plugs from the freshly growing mycelium of the particular plant pathogen were inoculated onto the surface of Petri plates (9 cm in diameter) containing malt extract agar medium (MEA) (5 g L−1malt extract, 2.5 g L−1yeast extract, 10 g L−1glucose and 20 g L−1agar) into a position 1.5 cm from the center of the plate. After 48 h in the case of the slower growing fungi likeR. solani,A. solani,F. moniliformeandF. graminearum, or 24 h for the isolates with fast growing ability, such asF. culmorumand FOSC, a plug containing freshly grown mycelia ofT. asperellumor T. longibrachiatumwas inoculated in the same way, 3 cm apart from the plant pathogen’s inoculation position (Figure1). The plates were kept at 25◦C for 16 h light and 8 h darkness per day. After 7 days the visible area of theTrichodermacolony and the total area occupied by both the colonies ofTrichoderma and the plant pathogenic fungus were measured. Colony areas were used as a measurement tool to evaluate the antagonistic capacity of each isolate against the different plant pathogenic fungi using the free hand selection tool in Image J (https://imagej.nih.gov/ij/). Biocontrol index (BCI) values (area of the Trichodermacolony divided by the total area occupied by bothTrichodemaand the plant pathogen×100) were used for calculating the antagonistic ability of each strain.
2.3. Peptaibol Extraction
Solvents used for extraction were methanol and chloroform (VWR International, Debrecen, Hungary). The surface of each plate (Trichodermacolony as control, plant pathogen colonies as controls, andTrichodermaplus plant pathogen in confrontational tests) was flooded twice with 5 mL chloroform, washed several times, collected in clean test tubes and shaken at room temperature for 2 h. After that, chloroform was evaporated to dryness by a rotary evaporator (IKA RV 10; IKA Works, Wilmington, NC, USA). The crude extracts were dissolved in methanol and collected in new tubes. Trichoderma spores and mycelia were pelleted by centrifuging at 10,000 rpm for 10 min (Biofuge Primo centrifuge, Heraeus, Hanau, Germany). The supernatant was transferred into new tubes and evaporated under
Biomolecules2020,10, 730 4 of 19
nitrogen. The remaining dry material was dissolved in 200µL methanol and kept at−20◦C for further analysis [40].
Biomolecules 2020, 10, x FOR PEER REVIEW 4 of 20
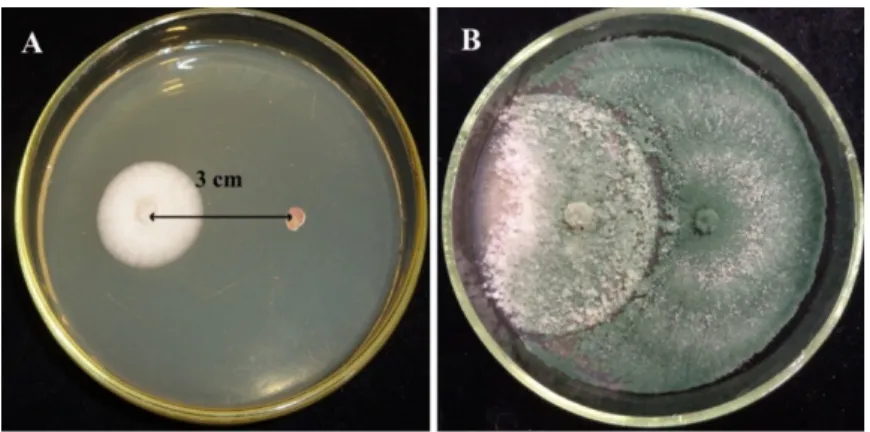
Figure 1. Direct confrontation test between Trichoderma asperellum IRAN 3062C and Alternaria solani SZMC 6241J after (A) 2 days and (B) 7 days on malt extract agar (MEA) medium.
2.3. Peptaibol Extraction
Solvents used for extraction were methanol and chloroform (VWR International, Debrecen, Hungary). The surface of each plate (Trichoderma colony as control, plant pathogen colonies as controls, and Trichoderma plus plant pathogen in confrontational tests) was flooded twice with 5 mL chloroform, washed several times, collected in clean test tubes and shaken at room temperature for 2 h. After that, chloroform was evaporated to dryness by a rotary evaporator (IKA RV 10; IKA Works, Wilmington, NC, USA). The crude extracts were dissolved in methanol and collected in new tubes.
Trichoderma spores and mycelia were pelleted by centrifuging at 10,000 rpm for 10 min (Biofuge Primo centrifuge, Heraeus, Hanau, Germany). The supernatant was transferred into new tubes and evaporated under nitrogen. The remaining dry material was dissolved in 200 µL methanol and kept at −20 °C for further analysis [40].
2.4. Biological Activity of the Crude Extracts
Approximate total amounts of peptaibols produced by each Trichoderma isolate were estimated by the rapid pre-screening method described by Marik et al. [41]. Antimicrobial activities of the crude extracts from strains T. asperellum IRAN 3062C and T. longibrachiatum IRAN 3067C were evaluated against Micrococcus luteus strain SZMC 0264. The inhibition zone was measured after 2 days and the total amount of peptaibols was estimated according to the calibration curve of alamethicin standard (Sigma-Aldrich, Budapest, Hungary) [41].
To evaluate antifungal activity of the crude extract, 1 mL of spore suspension (5 × 10⁵ spore per mL) of F. moniliforme, F. culmorum, F. graminearum, FOSC, A. solani and R. solani strains was spread on the surface of the plate containing MEA and 5 mm diameter wells were bored into the agar circularly. Twenty µL of the series dilution of the crude extract (200, 100, 50 and 10 µg mL−1 crude peptaibol extracts) was poured into the well and methanol was used as negative control. The plates were incubated at 25 °C for one week. Three parallel experiments were set up to measure the inhibition zones [33].
2.5. Identification and Semi-Quantitation of Peptaibols
The measurements were carried out with an Agilent 1100 modular reversed phase (RP) high- performance liquid chromatography (HPLC) system (Agilent, Palo Alto, CA, USA) coupled to a Varian 500 (Agilent, Palo Alto, CA, USA) ion trap mass spectrometer equipped with electrospray ion source (ESI-MS). Chemstation B.02.01 and MS Workstation 6.6 softwares controlled the HPLC and the MS, respectively. The extracts were separated and their full scan and MS2 spectra were acquired, and microheterogenous mixtures of peptaibols were sequenced using consecutive fragmentation in ESI-MSn according to the method described by Marik et al. [42]. The total peptaibol production of each measurement was calculated based on the summarized integrated area of the sodiated molecular ions [M + Na]+ proportionated with their respective BCI values. For the identified peptaibols, the previously defined nomenclature was applied, where the relative amount of each
Figure 1.Direct confrontation test betweenTrichoderma asperellumIRAN 3062C andAlternaria solani SZMC 6241J after (A) 2 days and (B) 7 days on malt extract agar (MEA) medium.
2.4. Biological Activity of the Crude Extracts
Approximate total amounts of peptaibols produced by eachTrichodermaisolate were estimated by the rapid pre-screening method described by Marik et al. [41]. Antimicrobial activities of the crude extracts from strainsT. asperellumIRAN 3062C andT. longibrachiatumIRAN 3067C were evaluated againstMicrococcus luteusstrain SZMC 0264. The inhibition zone was measured after 2 days and the total amount of peptaibols was estimated according to the calibration curve of alamethicin standard (Sigma-Aldrich, Budapest, Hungary) [41].
To evaluate antifungal activity of the crude extract, 1 mL of spore suspension (5×10⁵spore per mL) ofF. moniliforme,F. culmorum,F. graminearum, FOSC,A. solaniandR. solanistrains was spread on the surface of the plate containing MEA and 5 mm diameter wells were bored into the agar circularly.
TwentyµL of the series dilution of the crude extract (200, 100, 50 and 10µg mL−1crude peptaibol extracts) was poured into the well and methanol was used as negative control. The plates were incubated at 25◦C for one week. Three parallel experiments were set up to measure the inhibition zones [33].
2.5. Identification and Semi-Quantitation of Peptaibols
The measurements were carried out with an Agilent 1100 modular reversed phase (RP) high-performance liquid chromatography (HPLC) system (Agilent, Palo Alto, CA, USA) coupled to a Varian 500 (Agilent, Palo Alto, CA, USA) ion trap mass spectrometer equipped with electrospray ion source (ESI-MS). Chemstation B.02.01 and MS Workstation 6.6 softwares controlled the HPLC and the MS, respectively. The extracts were separated and their full scan and MS2spectra were acquired, and microheterogenous mixtures of peptaibols were sequenced using consecutive fragmentation in ESI-MSnaccording to the method described by Marik et al. [42]. The total peptaibol production of each measurement was calculated based on the summarized integrated area of the sodiated molecular ions [M+Na]+proportionated with their respective BCI values. For the identified peptaibols, the previously defined nomenclature was applied, where the relative amount of each peptaibol was expressed in percentages based on the peak area of the [M+Na]+appearing in the full scan measurements [42].
2.6. RNA Extraction and qRT-PCR for Detection of tex1 Gene Expression
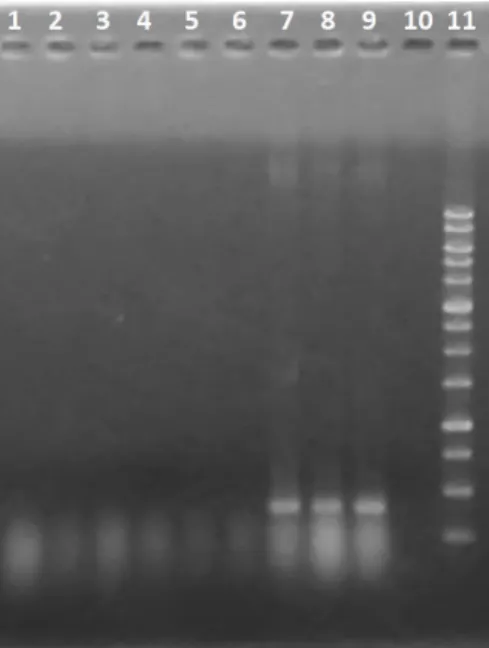
Total RNA was extracted by the method described by Orek [43] fromT. asperellum(both as control and in confrontation withR. solani) with some modifications. RNA quality and quantity were checked by Nano drop (NanoPhotometer®N120, IMPLEN, München, Germany), considering the ideal absorbance ratio (1.8≤ A260/280≤2.0). Total extracted RNA was also electrophoresed on 1% agarose gel to
Biomolecules2020,10, 730 5 of 19
visualize the RNA integrity. For cDNA synthesis, approximately 5 mg of RNA was treated with DNase I, RNase-free (Pub. No. MAN0012000, Thermo Fisher Scientific Inc., Waltham, MA, USA) according to the manufacturer’s instructions. cDNA was synthesized using High-Capacity cDNA Reverse Transcription kit and Oligo dT primers (Yekta Tajhiz Azma, Tehran, Iran, Cat No. YT4500) according to the manufacturer’s manual. Real-time quantitative PCR was performed with gene-specific primers for tex1: TEX1F 5’-TTTCAGCGACGTTTTGCCAG-3’ and TEX1R 5’-TGGTGCAAAAATCGCACAGG-3’
amplifying a 186 bp fragment of the tex1 NRPS gene were designed based on the sequence of T. virensGv29-8 non-ribosomal peptide synthetase (tex1) (NCBI Reference Sequence: XM_014097635.1).
qPCR reactions were carried out with 48 wells StepOne Real-Time PCR System (Applied Biosystems StepOne, Foster City, CA, USA), using SYBR®Green. Each reaction was performed in 20µL containing 1×Power SYBR Green PCR Master Mix (Yekta Tajhiz Azma, Tehran, Iran, Cat No. YT2552), 120 nM of primers (Pishgaman Co., Tehran, Iran) and 2µL diluted (1/20) cDNA sample. PCR was performed using the thermal cycling parameters as follows: 95◦C, 10 min; and 40 cycles of 95◦C, 15 s; 58◦C, 25 s and 72◦C, 35 s. The qPCR data were analyzed by the 2−∆∆CTmethod [44]. Theβ-tubulin gene was used to determine the relative expression level of thetex1gene analyzed in this work. For the determination of qPCR efficiency of each primer pair, a standard curve was performed using cDNA dilutions of 1:5, 1:25, 1:125 and 1:625. Each sample was examined in duplicate. The corresponding qPCR efficiencies (E) were calculated for each primer pair with the LinRegPCR software [45]. In this way, the Real-time PCR Data Markup Language (RDML) file of fluorescence change data by StepOne software was analyzed by LinRegPCR software and qPCR efficiencies (E) were calculated. The efficiency obtained in both methods was approximately similar.
2.7. Statistical Analysis
In order to determine the significant differences between the peptaibol production ofTrichoderma isolates in the confrontation assays with plant pathogens in comparison to the respective controls, peptaibol percentage level (the graph area of specific peptaibol compound divided by the area of the total peptaibol production) changes were calculated by each peptaibol peak area with the MS Data Review software. All data were analyzed for statistical significance by Graphpad Prism software version 6.01 (GraphPad Software, San Diego, CA, USA;www.graphpad.com). Comparative studies of different isolates were done by multiplettest analysis. The statistical significance was determined using the Holm–Šidak method with alpha=5.00%. The statistical analysis of qPCR results was performed in SAS 9.4 (www.sas.com) in a completely randomized design with one-way ANOVA and Duncan’s test (p<0.05).
3. Results
3.1. Inhibitory Activity of Peptaibol Extracts
The crude extracts ofTrichodermaisolates used in this study showed antibacterial activities towards M. luteus(Figure2A).T. asperellumIRAN 3062C had a larger inhibition zone (22 mm in diameter) than T. longibrachiatumIRAN 3067C. The alamethicin equivalent concentrations of the average amount of peptaibols in the crude extracts were 604.28 and 230.1µg mL−1forT. asperellumIRAN 3062C and T. longibrachiatumIRAN 3067C, respectively.
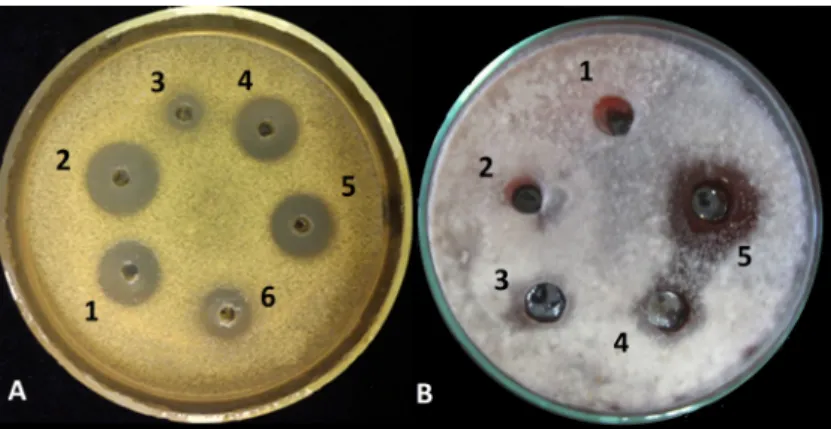
According to the results of the antifungal assay, the crude extract ofT. asperelluminhibited spore germination and its effect started from the concentration of 100µg mL−1for all plant pathogenic fungi.
The largest inhibition zones were seen in the case ofA. solani(Figure2B),R. solaniandF. moniliforme.
The results were in conformity with the findings of the BCI index assay described below.
Biomolecules2020,10, 730 6 of 19
Biomolecules 2020, 10, x FOR PEER REVIEW 6 of 20
According to the results of the antifungal assay, the crude extract of T. asperellum inhibited spore germination and its effect started from the concentration of 100 µg mL−1 for all plant pathogenic fungi.
The largest inhibition zones were seen in the case of A. solani (Figure 2B), R. solani and F. moniliforme.
The results were in conformity with the findings of the BCI index assay described below.
Figure 2. Biological activity assay of crude extracts from Trichoderma species against (A) Micrococcus luteus; 1, 2, 4 and 5: Trichoderma asperellum IRAN 3062C (604.28 µg mL−1), 3 and 6: Trichoderma longibrachiatum IRAN 3067C (230.1 µg mL−1) and (B) Alternaria solani; 1: methanol as control, 2: 10, 3:
50, 4: 100, 5: 200 µg mL−1 of peptaibol extract from T. asperellum IRAN 3062C.
3.2. Confrontation Experiments
The dual culture technique (Figure 1) revealed that the examined Trichoderma strains were capable of overgrowing the examined plant pathogenic fungi. The mycelial growth of the plant pathogens was mitigated and a reduction of the colony diameter extension appeared in the presence of Trichoderma isolates (Figure 3).
Figure 3. In vitro confrontation experiments between Trichoderma asperellum IRAN 3062C, Trichoderma longibrachiatum IRAN 3067C and plant pathogenic fungi on MEA after 7 days. * FOSC: Fusarium oxysporum species complex.
BCI values showed diversity for each Trichoderma–plant pathogen interaction according to the plant pathogenic fungus and could reach up to 100%. BCI values showed that T. asperellum IRAN 3062C has efficient antagonistic abilities against A. solani and R. solani with BCI values of 96.05% ± 3.8% and 92.16% ± 6.94%, respectively. The T. longibrachiatum strain IRAN 3067C used in this study showed lower antagonistic capacities than T. asperellum IRAN 3062C against the various plant pathogens. The interactions of T. asperellum and T. longibrachiatum producing trichotoxins and longibrachins, respectively, revealed BCI values in decreasing order against A. solani, R. solani, F.
graminearum, F. moniliforme, F. culmorum and FOSC (Figure 4).
Figure 2.Biological activity assay of crude extracts fromTrichodermaspecies against (A)Micrococcus luteus;
1, 2, 4 and 5:Trichoderma asperellumIRAN 3062C (604.28µg mL−1), 3 and 6:Trichoderma longibrachiatum IRAN 3067C (230.1µg mL−1) and (B)Alternaria solani; 1: methanol as control, 2: 10, 3: 50, 4: 100, 5: 200µg mL−1of peptaibol extract fromT. asperellumIRAN 3062C.
3.2. Confrontation Experiments
The dual culture technique (Figure1) revealed that the examinedTrichodermastrains were capable of overgrowing the examined plant pathogenic fungi. The mycelial growth of the plant pathogens was mitigated and a reduction of the colony diameter extension appeared in the presence ofTrichoderma isolates (Figure3).
Biomolecules 2020, 10, x FOR PEER REVIEW 6 of 20
According to the results of the antifungal assay, the crude extract of T. asperellum inhibited spore germination and its effect started from the concentration of 100 µg mL−1 for all plant pathogenic fungi.
The largest inhibition zones were seen in the case of A. solani (Figure 2B), R. solani and F. moniliforme.
The results were in conformity with the findings of the BCI index assay described below.
Figure 2. Biological activity assay of crude extracts from Trichoderma species against (A) Micrococcus luteus; 1, 2, 4 and 5: Trichoderma asperellum IRAN 3062C (604.28 µg mL−1), 3 and 6: Trichoderma longibrachiatum IRAN 3067C (230.1 µg mL−1) and (B) Alternaria solani; 1: methanol as control, 2: 10, 3:
50, 4: 100, 5: 200 µg mL−1 of peptaibol extract from T. asperellum IRAN 3062C.
3.2. Confrontation Experiments
The dual culture technique (Figure 1) revealed that the examined Trichoderma strains were capable of overgrowing the examined plant pathogenic fungi. The mycelial growth of the plant pathogens was mitigated and a reduction of the colony diameter extension appeared in the presence of Trichoderma isolates (Figure 3).
Figure 3. In vitro confrontation experiments between Trichoderma asperellum IRAN 3062C, Trichoderma longibrachiatum IRAN 3067C and plant pathogenic fungi on MEA after 7 days. * FOSC: Fusarium oxysporum species complex.
BCI values showed diversity for each Trichoderma–plant pathogen interaction according to the plant pathogenic fungus and could reach up to 100%. BCI values showed that T. asperellum IRAN 3062C has efficient antagonistic abilities against A. solani and R. solani with BCI values of 96.05% ± 3.8% and 92.16% ± 6.94%, respectively. The T. longibrachiatum strain IRAN 3067C used in this study showed lower antagonistic capacities than T. asperellum IRAN 3062C against the various plant pathogens. The interactions of T. asperellum and T. longibrachiatum producing trichotoxins and longibrachins, respectively, revealed BCI values in decreasing order against A. solani, R. solani, F.
graminearum, F. moniliforme, F. culmorum and FOSC (Figure 4).
Figure 3.In vitro confrontation experiments betweenTrichoderma asperellumIRAN 3062C,Trichoderma longibrachiatumIRAN 3067C and plant pathogenic fungi on MEA after 7 days. * FOSC:Fusarium oxysporum species complex.
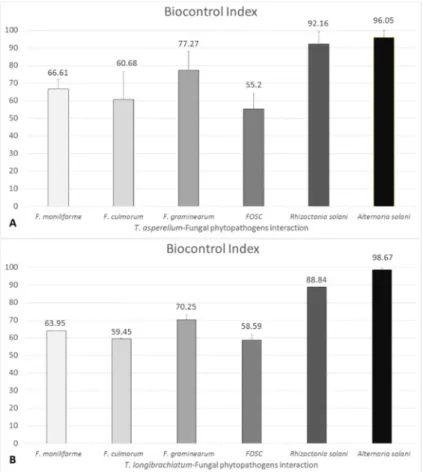
BCI values showed diversity for eachTrichoderma–plant pathogen interaction according to the plant pathogenic fungus and could reach up to 100%. BCI values showed thatT. asperellumIRAN 3062C has efficient antagonistic abilities againstA. solaniandR. solaniwith BCI values of 96.05%±3.8%
and 92.16%±6.94%, respectively. TheT. longibrachiatumstrain IRAN 3067C used in this study showed lower antagonistic capacities thanT. asperellumIRAN 3062C against the various plant pathogens.
The interactions of T. asperellumandT. longibrachiatumproducing trichotoxins and longibrachins, respectively, revealed BCI values in decreasing order againstA. solani, R. solani, F. graminearum, F. moniliforme,F. culmorumand FOSC (Figure4).
Biomolecules2020,10, 730 7 of 19
Biomolecules 2020, 10, x FOR PEER REVIEW 7 of 20
Figure 4. Biocontrol index (BCI) values of Trichoderma asperellum IRAN 3062C (A) and Trichoderma longibrachiatum IRAN 3067C (B) towards different plant pathogenic fungi. Bars represent standard deviation.
3.3. Changes in Peptaibol Production during Different In Vitro Trichoderma–Plant Pathogen Interactions The total amount of peptaibols proved to be elevated during the interaction of T. asperellum with the tested plant pathogens and the increase proved to be significant in the case of the interaction with FOSC (Figure 5). The peptaibol production of T. longibrachiatum–plant pathogen interactions was also increased, although significant differences could not be observed.
Figure 5. Total amounts of peptaibols produced by Trichoderma asperellum IRAN 3062C (A) and T.
longibrachiatum IRAN 3067C (B) in interaction with plant pathogenic fungi (Fusarium moniliforme, F.
Figure 4. Biocontrol index (BCI) values of Trichoderma asperellumIRAN 3062C (A) andTrichoderma longibrachiatumIRAN 3067C (B) towards different plant pathogenic fungi. Bars represent standard deviation.
3.3. Changes in Peptaibol Production during Different In Vitro Trichoderma–Plant Pathogen Interactions The total amount of peptaibols proved to be elevated during the interaction ofT. asperellumwith the tested plant pathogens and the increase proved to be significant in the case of the interaction with FOSC (Figure5). The peptaibol production ofT. longibrachiatum–plant pathogen interactions was also increased, although significant differences could not be observed.
Eight main peaks including the trichotoxin peptaibol group [22] as complex mixture of isoforms (Table1) were detected in the chromatograms ofT. asperellumIRAN 3062C (Figure6A).
Biomolecules2020,10, 730 8 of 19
Biomolecules 2020, 10, x FOR PEER REVIEW 7 of 20
Figure 4. Biocontrol index (BCI) values of Trichoderma asperellum IRAN 3062C (A) and Trichoderma longibrachiatum IRAN 3067C (B) towards different plant pathogenic fungi. Bars represent standard deviation.
3.3. Changes in Peptaibol Production during Different In Vitro Trichoderma–Plant Pathogen Interactions The total amount of peptaibols proved to be elevated during the interaction of T. asperellum with the tested plant pathogens and the increase proved to be significant in the case of the interaction with FOSC (Figure 5). The peptaibol production of T. longibrachiatum–plant pathogen interactions was also increased, although significant differences could not be observed.
Figure 5. Total amounts of peptaibols produced by Trichoderma asperellum IRAN 3062C (A) and T.
longibrachiatum IRAN 3067C (B) in interaction with plant pathogenic fungi (Fusarium moniliforme, F.
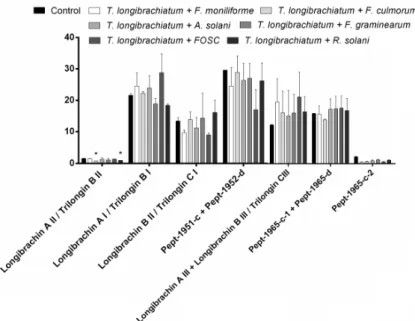
Figure 5. Total amounts of peptaibols produced byTrichoderma asperellum IRAN 3062C (A) and T. longibrachiatumIRAN 3067C (B) in interaction with plant pathogenic fungi (Fusarium moniliforme, F. culmorum,F. graminearum, FOSC,Alternaria solani,Rhizoctonia solani) compared with the control (Trichodermawithout plant pathogen) in confrontation tests. Asterisks indicate significant differences, as determined by Student’sttest (p<0.05) corrected with the Holm–Šidak method.
Biomolecules 2020, 10, x FOR PEER REVIEW 8 of 20
culmorum, F. graminearum, FOSC, Alternaria solani, Rhizoctonia solani) compared with the control (Trichoderma without plant pathogen) in confrontation tests. Asterisks indicate significant differences, as determined by Student’s t test (p < 0.05) corrected with the Holm–Šidak method.
Eight main peaks including the trichotoxin peptaibol group [22] as complex mixture of isoforms (Table 1) were detected in the chromatograms of T. asperellum IRAN 3062C (Figure 6A).
Figure 6. Total ion chromatogram of peptaibols extracted from (A) Trichoderma asperellum IRAN 3062C and (B) Trichoderma longibrachiatum IRAN 3067C. Kromasil C18; 5 µm, 1.6 × 250 mm; MeOH/H20 (86:14), flow rate 1 mL min−1.
Figure 6.Total ion chromatogram of peptaibols extracted from (A)Trichoderma asperellumIRAN 3062C and (B)Trichoderma longibrachiatumIRAN 3067C. Kromasil C18; 5µm, 1.6×250 mm; MeOH/H2O (86:14), flow rate 1 mL min−1. Numbers indicate peaks containing peptaibols (see Table1).

![Table 1. Peptaibol sequences produced by T. asperellum IRAN 3062C and T. longibrachiatum IRAN 3067C [46].](https://thumb-eu.123doks.com/thumbv2/9dokorg/971641.58096/9.1262.132.1127.161.753/table-peptaibol-sequences-produced-asperellum-iran-longibrachiatum-iran.webp)