23/06/2015.
CAN THE PAKS -2 NUCLEAR POWER PLANT OPERATE WITHOUT STATE AID?
A business economics analysis
Balázs Felsmann, Corvinus University Budapest
ENERGIAKLUB, June 2015 All rights reserved.
CAN THE PAKS-2 NUCLEAR POWER PLANT OPERATE WITHOUT STATE AID? - A BUSINESS ECONOMICS ANALYSIS
Author:
Balázs Felsmann
Corvinus University Budapest balazs.felsmann@uni-corvinus.hu
The study and its background calculations are also available on the websites of Energiaklub Climate Policy Institute and Applied Comunications:
www.energiaklub.hu
The study has been conducted within the framework of Energiaklub’s ’Pakskontroll’ programme:
www.pakskontroll.hu
TABLE OF CONTENTS
1. INTRODUCTION ... 2
2. EXECUTIVE SUMMARY ... 3
3. EARLIER HUNGARIAN STUDIES ON THE TOPIC OF RETURN OF THE PAKS-2 PROJECT ... 6
4. METHODOLOGY OF THE ANALYSIS ... 9
4.1. Determination of the net present value in the model ... 10
4.2. Real versus nominal model; the treatment of inflation and of the exchange rate ... 11
5. INTRODUCING THE KEY MODEL PARAMETERS...12
5.1. Assumptions concerning the investment and the facility to be brought into existence as a result of the project ... 12
5.1.1. Investment cost ... 12
5.1.2. Timeframe of the investment ... 13
5.1.3. Operational life and renewal needed during the operation time period ... 14
5.1.4. Accounted-for depreciation ... 14
5.2. Assumptions concerning the development of sales turnover ... 15
5.2.1. Expected development of power plant market prices ... 15
5.2.2. Capacity utilization during operation ... 18
5.3. Development of operating costs ... 19
5.3.1. Fact costs for Paksi Atomerőmű Zrt. ... 19
5.3.2. Modelling of fuels expenses ... 20
5.3.3. Other material cost and charges ... 20
5.3.4. Personnel costs ... 20
5.3.5. Other charges and taxes payable ... 21
5.4. Financing ... 21
5.4.1. Resources subject to interest ... 21
5.4.2. Working capital policy ... 22
6. SUMMARY OF RESULTS………….……….…………..….……22
6.1. ROI and supplementary financing needs in specific modelled scenarios ... 22
6.2. Detailed analysis of the Base Case scenario ... 24
7. SUMMARY ... 29
2
1. INTRODUCTION
Many studies have investigated the prospects for returns, the budgetary and financing background and energy management effects of the new nuclear power plant units to be built at Paks. This document seeks to complement previous economics-based studies by adding a new criterion. The key question in our analysis is whether the power plant company will be capable of independent operations in an economic sense - or will its survival depend on further additional aid by the owner, i.e. via the central budget, after its commissioning? We shall examine from a corporate perspective in what ways the already disclosed financing terms and conditions may affect the everyday operations of the power plant company. In other words, we are seeking an answer to the question of whether the owner‟s expected financial commitment (in our case, due to the fact of State ownership, of taxpayers) will end once the EUR 2.5 billion own contribution (approximately HUF 765 billion at today‟s rates) specified in an international contract is paid out to make real the amount of investment in the period 2015 to 2025.
This topic is made particularly timely by the recent decision of the European Commission to authorize State aid to the British Hinkley Point C nuclear power plant.1 The Hungarian government, however, still insists that no State aid will be needed for Paks-2. According to their position, “the analyses have shown that no State capital support is needed to ensure the conditions of its paying for itself.”2
In our view, if the company is to operate in a market company, it must be able to operate in a self-sustainable way, without being in need of continuous capital injection due to its losses. Of course, it is conceivable that, for short periods, the owner will provide bridging support to the power plant company, but such support should not become oft-occurring as this might then lead to permanent market distortion and may prohibit State aid. According to Article 288 of the Commission decision on the Hinkley Point C Nuclear Power Station, “State aid is any aid granted by a Member State or through State resources in any form whatsoever which distorts or threatens to distort competition by favouring certain undertakings or the production of certain goods in so far as it affects trade between Member States.” If Paks-2 NPP can remain operational in the long run only through the additional capital injections of the State as owner of the company, that would obviously grant the company a selective advantage relative to other power generators as fulfils the conditions applicable to State aid. Therefore, our investigation will focus primarily on specifying the market conditions under which government expectations of realizing the Paks-2 NPP project without State aid can be met.3
1The Commission decision concerning the Hinkley Point C Nuclear Power Station can also be seen in Hungarian in the Official Journal of the EU (28 April 2015: pp. 40-111).
2Written answer by János Lázár, the Minister heading the Prime Minister‟s Office, to the question of MP Bernadett Szél, 22 October 2014:
3As an addendum to whether the establishment of new nuclear power plant capacities without State aid is a realistic option, let us quote Point 273 from the Hinkley Point C decision: “The UK disagreed with comments suggesting that the market would come up with investment in new nuclear capacity in the absence of aid.”
3
2. EXECUTIVE SUMMARY
Our analysis will first review some earlier papers on the ROI issue and present their respective methodologies and main findings. Then, we will present our own methodology based on a shareholder value approach that is common in the field of corporate finance. To be able to calculate return on investment, we prepared the financial statement forecasts of the power plant company for the total investment period (2015-2025) and for the period of operations (2026-2085). To forecast the financial statements, we came up with several parameters that can be subjected to a sensitivity analysis. The paper presents scenarios primarily for the wholesale (sales) prices attainable by the power plant and the effects of the expected capacity utilization rates on return, yet the calculation model enables us to analyze the impact of many other factors as well. The model comprises a total of 20 parameters that can be altered to make simulations of expected returns and financial viability.
We have relied extensively on the most recent market forecasts and data to specify the expected market power price and capacity utilization scenarios. According to the forecast of the European Commission,4 the price level of European power generation will increase by 2.4% on average per year at constant prices until 2020, but by 2021-2030 and 2031-2040 prices will be going down by an annual 0.17% and 0-19%, respectively. This implies a price increase of 23% by 2026 at constant prices, which will go down to 21% by 2030. According to a fresh paper by the British system operator,5 the wholesale UK power price expected for 2026 will be 96.1, 76 and 54.2 £/MWh under the high, average and low market prices scenarios, respectively - that is, calculated in relation to the long-term inflation rate of the UK (2.38%) and at 2015 prices, prices will change by +13%, +3% and -16% in real value, respectively.
Our modelling results warrant the following main conclusions:
unless wholesale power prices show permanent real price growth, the project will not pay off; its net present value is expected to be EUR -5.0 to -6.3 billion depending on the utilization rate. At the same time, this will present the company with major, additional equity financing needs (additional capital injections exceeding the amount of the prospective Russian loan - of EUR 12.4-18.6 billion - will be needed to keep the company operational). Until the early 2050s, the power plant company will only be able to remain operational via repeated capital injections. In the first ten years of operations, the owner (the Hungarian taxpayers) will have to help out the nuclear power station by HUF 210-250 billion per annum on average, and in the subsequent decade by HUF 140-160 billion per annum on average; but even in the third decade of operations, the annual average capital injection amount will be HUF 41-75 billion;
to the extent that wholesale power prices develop by and large according to the forecast of the European Commission (in our model, they will increase in real value by 25% until 2026), the NPV will still be negative in relation to any of the capacity utilization rates (EUR -2.7 and -4.5 billion) and the owner will have to keep providing significant (EUR 6-10.5 billion) additional funding to keep the
4 EU (2014), p. 213.
5 National Grid (2014).
4
facility operational. Repeated proprietary capital injections will be needed year on year until the mid-2040s to keep the project going. In the first ten years of operation, the owner (the Hungarian taxpayers) will have to help out the nuclear power station by HUF 140-190 billion per annum on average, and in the following decade by HUF 50-117 billion per annum on average;
to the extent that market power prices will be consistently higher by 50% over current ones in real terms, the project costs may be recovered at high utilization rates (net present value of between EUR -2.6 and -0.1 billion); yet the project would nevertheless need additional proprietary capital injections (of EUR 2.2 to 5.6 billion) up until the mid-2030s. In the first ten years of operation, the owner will have to provide aid to the nuclear power station by HUF 68-133 billion per annum on average. In the second decade, the support will amount to HUF 0-43 billion on an annual average;
ROI will be ensured, in line with the declarations of the government, if wholesale power prices are higher by 75% in real terms over current ones throughout the lifetime of the power plant, which would be operating with a utilization rate of min. 85% during this time period.
The key findings of our analysis can be summarized as follows:
1) Considering international power price forecasts, it is highly likely that the Paks-2 New Power Plant would not be able to attain the sales prices required for independent market operations and would be permanently in need of State aid.
We do not consider long-term real price growth by 75% - the rate needed for the independent market operation of the facility - a realistic option in the electricity market. Price increases on such a scale would provide a major stimulus to technological innovations in the field of other energy generation technologies and to energy efficiency, making the preservation of such a permanently high price unlikely.
2) Market prices notwithstanding, the high-capacity operation of a nuclear power plant is becoming increasingly problematic due to the spread of renewable energies that limit the market options open to baseload operators due to the low variable costs of solar and wind energies. This problem will become particularly evident during the combined operations of the current and envisaged Paks units, when the share of nuclear energy may exceed 70% of domestic power generation.6 It would therefore be advisable to reduce the period of overlap to the minimum and to schedule the activation of any new power plant capacities for the mid-2030s.
3) According to the forecast of the International Energy Agency, new innovations cutting investment and operating costs significantly (by 24-30% by 2035) are imminent also as regards nuclear technology.7 This circumstance underlines the fact that premature investment implies a risk of foregoing new innovations
6 According to the ENTSO-E database, the utilization rate of the French nuclear power plants characterized by a similarly high nuclear production ratio was only 73-76% in recent years.
7 World Energy Investment Outlook, 2014
5
realized in other technologies, and also that countries taking a later decision on upgrading their nuclear capacities will be in a more favourable situation.
4) Under the realistic power market scenarios, the power plant is likely to be continually in need of additional capital injections by the owner, and this will make State aid a fact. To prevent such support from being prohibited State aid, it would be commendable for the Hungarian government to acknowledge that the project does contain a State subvention, thus to initiate an authorization procedure for the European authorities.8
5) The Hungarian government should alter its project communication strategy and present its calculations and arguments in favour of such an investment. Instead of stressing how cheap electricity generated by the nuclear power plant will be, it should tell the domestic and international public why, although power generated in the nuclear power plant will probably not be cheap, it still considers it important to carry out this project according to its current timetable.
8 Some government declarations note that the project does not comprise State aid if only because the Russian loan will be repaid by the central administration, and not the power plant; so the power plant will not be assuming any debt service obligations. In our opinion, this is obviously false. For if the state owner does not charge to the power plant its financing costs set out in the international contract, the market investor principle would clearly be impaired. Pursuant to Article 107 of the Treaty on the Functioning of the European Union, if a State agency provides investment, credit etc. to an undertaking, that amount will not be regarded as State aid if any private investor on the market would have acted similarly. It is hard to imagine a market investor that would not charge its own financing costs to the undertaking in which it has invested its money. Therefore, in our view, the project will contain no State aid only if the special project vehicle (SPV) is able to produce the costs of its own funding. This assumption is the starting point of our model.
6
3. EARLIER HUNGARIAN STUDIES ON THE TOPIC OF RETURN OF THE PAKS-2 PROJECT
Several studies have been devoted to an analysis of the economics background of the new power plant to be built at Paks. In what follows, we will present three of these, and compare their respective economics approaches with our own analytical framework.
Unfortunately, the papers available today include no official impact assessment by the Government that would explain what expectations make the pro-enlargement party say that
“Hungary will make the best deal of the past forty years: the Paks investment and hence cheap electricity can make it the most competitive economy in Central Europe”9. The calculation supporting the following declaration of the former Minister for National Development would certainly be a matter of common interest: “According to calculations, power energy prices can be reduced by 13 per cent after capacity expansion - that is, the construction of the envisaged two nuclear power plant units in Paks.”10The model calculations concerned are currently unavailable, despite the promise made by the government in June 2014 that the public at large will be given access to the scientific publications which demonstrate that enlargement of the Paks power plant is worthwhile for the country: “We‟ll present the figures that show the return on investment and guarantee cheap energy within Hungarian energy policy.”11
More detailed analyses were published on the topic of the expected payoff from the project by Attila Aszódi, Government Commissioner in charge of the Paks enlargement project and his staff (Aszódi et al. 2014), the researchers of the Regional Centre for Energy Policy Research (REKK, 2013) and Balázs Romhányi, analyst from the Fiscal Responsibility Institute, Budapest (Romhányi, 2014). The main characteristics of the studies, as compared to the investigation criteria of the present study, are summed up in Table1. The three papers studied the economic issues related to the power plant in different depths and with different methodologies. The analysis of Aszódi et al. focused on the cost prices of production – i.e.
determination of the minimum market price to be attained – while the REKK paper looked at determining the net present value of the project and Romhányi via an analysis of fiscal implications beyond those of direct benefit to investors. Despite their different opinions concerning the probability of the Paks project being financially viable, even the analysis drawn up by Government Commissioner Aszódi and his staff, clearly in favour of the project, highlight that the period of the repayment of the Russian loan will impose substantial burdens on the power plant company, which the SPV will be able to finance only at much higher market power prices than current ones. In the opinion of Attila Aszódi et al., power prices of HUF 28.74-35.56/kWh12, depending on the various scenarios, would have to be attained in the 21-year period of the repayment of the Russian loan taken out in relation to the investment, for the power plant to be able to cope without any further financial support.
The authors firmly believe, on the other hand, that the project might be a good investment despite the above as, after repayment of the loan, the power plant would generate power at a price of HUF 8.05-11.09/kWh, which will result in a good average price over its entire lifetime.
9 Press conference held by János Lázár, Head of the Prime Minister‟s Office, 16 January 2014. (Source:
kormany-hu)
10 Paks press conference held by Minister for National Development Lászlóné Németh, 24 February 2014.
(Source: fidesz.hu)
11 Statement of Minister Candidate János Lázár, Head of the Prime Minister‟s Office, 8 June 2014. (Source:
kormany.hu, MTI)
12 Paks NPP achieved 12,88 HUF/kwh selling price in 2013.
7
They support their arguments with LCOE (levelized cost of electricity) calculations, yet they present sensitivity analyses for relatively few of the related input parameters (exchange rate; interest rate of own contribution; utilization factor; downpayment loan term).
The methodology used by the authors concerned does not examine the project as such, i.e. it does not put it into the context of an active company, which makes it impossible to draw any conclusions from the study regarding the economic correlations underlying the averages calculated for its lifetime (such as the issue of funding, the central question of the present paper, for example).
The most detailed study supported by a calculation appendix was done by the staff of the Regional Centre for Energy Policy Research in Autumn 2013, and it analyzed via detailed sensitivity analyses the expected return of creating a new nuclear power plant facility. Their analysis drew up three scenarios based on extensive international benchmark data, and they examined how changes in input factors (fuel costs, power price, the discount rate, operation costs, utilization, investment costs, investment term) would affect developments in the expected net present value of the project. They attached an excel model to the paper, which provides for an analysis of further scenarios. The decisive majority of the model applications by REKK produced negative net present values; the NPV in the reference scenario was negative, at HUF -110 billion.
Romhányi examines primarily the fiscal impact of the power plant project. The author did not draw up any scenarios to study the direct, investor-level return as related to the project, and modelled the expected investment and operation expenditures and costs via an analysis of other papers and relevant data pertaining to the currently active Paks power plant. The paper drew up a detailed financial scenario for the prospective investment and analyzed the direct and indirect income flows relating to the investment and the operation time periods. It found that the power plant may produce a real return rate of 4% for investors at a power price of EUR 80-82 per MWh – that is, twice the currently-existing electricity prices.
8 Table 1 – Summary of the papers analyzing the economic effects of the Paks-2 NPP
REKK (2013) Aszódi et. al (2014) Romhányi (2014) Felsmann (2015)
Primary focus of the economic calculations
ROI analysis, scenario analysis Determination of the cost price of production
Complex examination of the fiscal implications of the project
Examination of the economic viability of the SPV
Primary analytical methodology
Project discounted cash flow (DCF- based NPV), internal rate of return (IRR), levelized cost of energy (LCOE)
Unit-cost-of-energy calculation (LCOE)
Balance of payments to the central budget, internal rate of return (IRR) analysis at investor and at macro-level, respectively
Net present value calculation based on indirect cash flow (FCFE) calculated from corporate level financial statements (DCF- based NPV)
Scenarios and a sensitivity analysis
Three scenarios specified in detail;
any number of versions can be tested in the attached excel model.
The authors present some calculated unit costs of electricity (HUF/kWh) in a table, but they do not have as appendices any models.
No project-level scenarios are analyzed. The primary objective of the paper is to reveal the fiscal effects.
Four detailed scenarios of capacity utilization and the development of prices.
Three scenarios specified in detail; any number of versions can be studied in the attached excel model.
Priority parameters for a sensitivity analysis
Fuels costs; Power price; Discount rate; Operation costs; Utilization;
Investment costs; Investment term.
Exchange rate; Interest rate with own contribution; Utilization factor;
Downpayment loan term.
There is no scenario analysis in the classical sense; the analysis comprises an assessment of the power price and the return rate.
Power price; Utilization factor;
Interest burden on additional financing; Mid- term maintenance rate; Working capital items; Depreciation rate
Treatment of exchange rate effects
Real price HUF model. A major part of input at the 2013 HUF rate. LCOE in EUR/MWh, converted at a fixed, parametrized rate.
Real price HUF model at the 2014 HUF rate. Sensitivity analysis calculated for three different exchange rates (300, 310, 320 HUF/EUR).
Current-price HUF model of the investment and cost items.
Current-price EUR model. Treats long-term EUR inflation as a starter parameter.
Referenced main external data sources, studies dealing with economic calculations
MIT (2009), DECC (2011, 2012), IEA- NEA (2010), ICEPT (2012), US EIA (2010), NEI (2013), Larsson (2012), VGB Powertech (2011), SKGS (2010), Elforsk (2011), NREL (2012), Fraunhofer (2012), JRC (2012).
IEA Key World Energy Statistics (2013), D‟haeseleer (2013)
EU (2014), IEA (2010)
IEA (2012), NEI (2013), University of Chicago (2004), International Atomic Energy Agency (2013, 2014)
EU (2014), IEA (2014), MIT(2015), US EIA (2015), National Grid (2014),
REKK (2013), Romhányi (2014), Aszódi et al.(2014)
Main conclusions regarding ROI
Under a realistic scenario, the “power plant faces a cumulative discounted cash- flow loss of around HUF 110 billion”. The unit cost of electricity being generated is LCOE=EUR 106 per MWh (IRR=8.7%), which may increase according to pessimistic assumptions up to EUR 176 per MWh, or decrease according to optimistic ones to EUR 66 per MWh.
“In the first 21 years of operations, the average unit cost of electricity will be around HUF 30/kWh [around EUR 97/MWh at current rates] whereas the parameters being studied show a HUF +5/kWh and HUF - 1/kWh difference relative to that value...
LCOE projected over the whole lifetime was HUF 16.01/kWh and HUF 16.38/kWh according to the two calculation methods.
“From an investor perspective, at current power prices, the project will not pay off.” [The power price calculated at an investor level, at a 4% real rate of return, is EUR 80-82 per MWh.]
“With measures affecting a broader number of citizens directly (consumption tax increase, cuts in social transfers in cash), the net growth sacrifice may be offset even at a price level of EUR 50-60/MWh, but the decline in government consumption would require power prices of almost EUR 80 and the exclusion of private investment of more than EUR 200/MWh.
Should the wholesale power prices develop by and large according to the forecast of the European Commission (increase in real value by 25% by 2026), the ROI value would be negative at any of the capacity utilization rates (EUR -2.7 and -4.4 billion) and the owner will have to keep providing significant (EUR 6-10.5 billion) additional funding to keep the facility going until the 2040s.
For the project to pay off, wholesale power prices should undergo a stable increase of 75% at constant prices.
9
4. METHODOLOGY OF THE ANALYSIS
The present paper adopts the shareholder value approach, which is common in the corporate finances field, and which determines the economic value of an investment by discounting the expected cash flows as related to the required capital expenditures.13 To calculate the present value, we prepared the financial statements forecast of the power plant company (profit and loss statement, and balance sheet) for the total investment period (2015-2025) and for the period of operations (2026-2085). The company‟s cash-flow statement was compiled indirectly, being on the basis of - and calculated from - data from the profit and loss statement and the balance sheet. To forecast the financial statements, we came up with several parameters that can be subjected to a sensitivity analysis. The paper presents scenarios primarily connected with the potential sales prices of the power plant and the ROI effect of expected capacity utilization rates, yet the calculation model in the paper‟s appendix makes it possible to analyze the effect of many other factors too (e.g. long-term inflation, interest rate, depreciation policy, working capital policy).
Given the pattern of the accounting statements, the assets and liabilities recorded in the balance sheet must show an equilibrium year upon year. Where the value of the equity and liabilities is too low to finance the assets of the company, the necessary extra funding can be ensured by repeated capital injections by the owner (capital increase, supplementary payments) or by additional borrowing (short- or long-term credit extension). Whereas additional funding provided by the owner raises the invested capital and hence the capital value representing the basis of the expected return to owners, borrowing will have an immediate cost-raising effect on the company‟s business management as the interest costs will appear among financial expenditures, thereby reducing any pre-tax profit. Accordingly, there is a mutual connection between the balance sheet and the profit and loss statement of the company: the two statements will serve to influence each other. In a financial modelling, this problem can be treated by the gradual approach, by iteration. Such an iterative approach is used in the Excel model prepared as an appendix to the present paper; it calculates with the help of a built-in macro the rate of additional financing needed in any given year, while satisfying also the principle that the two sides of the balance sheet must attain equilibrium.
The relevant legislation not only demands a balancing out of the assets and liabilities totals, but also that the equity of the company must not drop permanently below its subscribed capital.14 This law is dealt with in the financial model so that it automatically envisages an additional proprietary capital increase obligation should the value of the equity in the previous year be negative.
13 Rappaport (2002), p. 47.
14 Under the Civil Code (Act V of 2013): “3:189 (1) The managing director shall without delay convene a members‟ meeting or initiate its decision-making process without having to hold a meeting in order to provide for the necessary measures whenever it comes to his attention that: a) the company‟s equity has dropped to half of the initial capital due to losses; b) the company‟s equity has dropped below the amount defined by law;... (2) In cases covered in Subsection (1), members are required to adopt decisions, in particular concerning subscription of supplementary capital contributions or on securing initial capital in other ways, should there be any reduction of the initial capital.”
10
4.1. Determination of the net present value in the model
In line with the above, the proprietary cash flows of an active company are basically defined by three factors:
1) The rate of the initial investment: in the calculation model this value is EUR 2.5 billion in all, which is the amount of own contribution to the investment project announced to have a total value of EUR 12.5 billion. Its schedule corresponds to that for the project‟s implementation.
2) The necessary supplementary capital contributions of owners or supplementary capital allocations. Its rate is defined by whether the development of the equity of the company makes it necessary for the owner to provide supplementary capital to ensure operability in the accounting.
3) Dividend paid out in the period of operation.
The net present value of corporate cash flows can be defined in two ways by using data from the cash-flow statement. By discounting the value of the net cash-flow available to shareholders - i.e. the FCFE: the balance of cash flows from operations - the cash flows from investments and the cash flows from external financing. In this case, i.e. looking into shareholder cash flows, the discount factor will be based on the , that is, the expected return on equity.
The core equation for calculating the net present value this way is the following:
∑
where FCFE is the free cash flow to equity; is the return expected by the shareholders in the tth year.
The present value can also be calculated on the basis of the free cash flow for the firm (FCFF), i.e. the balance on cash flows before external financing (borrowing); but then the weighted average cost of capital (WACC) needs to be applied, which is to be calculated by the following formula:
where E is equity, D is the stock of liabilities subject to interest (loans), V is the aggregate value of equity and loans, and is the corporate tax rate.
The calculation model in the paper‟s appendix determines the net present value by the first method, on the basis of free cash flow to equity. The discount factor is, accordingly, the expected return on equity. In the model, the value of may be changed in the same way as that of any parameter. The summaries prepared for the model present outcomes at expected 5%, 8% and 10% real rates of return, respectively. International papers commonly use 5%
and 10% real rates of return on present value calculations when comparing returns on power plant technologies.
11
4.2. Real versus nominal model; the treatment of inflation and of the exchange rate
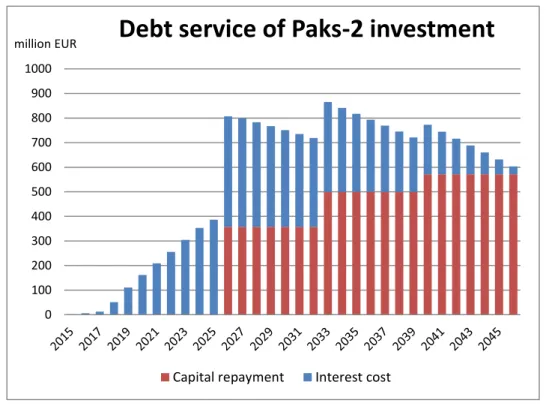
There is a series of arguments in favour of both the real and the nominal value approach but, technically, the two methods give equivalent results provided that the model treats inflation appropriately. The use of nominal values is supported by the fact that interests on liabilities subject to interest payment and their repayment instalments are typically specified at current prices, as is the case also with the Russian financing of the present project.15 The annual debt service of the Russian loan to be drawn for the investment based on intergovernmental agreement is shown in Figure 1.
Figure 1 - Annual debt service on the EUR 10 billion Russian loan to be drawn for the Paks-2 NPP investment
Since Russian financing is recorded in EUR and the long-term energy price prognoses are typically also available on a euro basis, it seemed sensible to use a current-price, EUR-based financial model. As for long-term inflation, a rate of 1.5% per annum was envisaged in line with the inflation projections of the European Central Bank, but this may be modified in the same way as with a model parameter.
15 The intergovernmental financing agreement (Act XXIV of 2014) gives a detailed specification of the repayment and interest conditions of the loan drawn in EUR, at nominal values. According to the agreement, the Russian party is to give a loan of max. EUR 10 billion for implementation of the investment, which may be used in 2014-2025; and this will serve to finance a maximum 80% of the total investment. Loan repayments will start following completion of the power plant, but no later than 15 March 2026; and will last for 21 years, coming via two instalments a year. In the first seven years, 25%, in the second seven years 35% and in the third seven years 40% of the loan amount will be due. The interest rate is 3.95% for the investment period, 4.5%
in the first seven years of repayment, 4.8% in the second seven years and 4.95% in the third seven years.
0 100 200 300 400 500 600 700 800 900 1000
million EUR
Debt service of Paks-2 investment
Capital repayment Interest cost
12
5. INTRODUCING THE KEY MODEL PARAMETERS
A key objective of the model is to provide for an analysis of financial risks that may adhere to the project - and their impact on shareholder value - by conducting sensitivity analyses. This objective, in turn, demands that key factors influencing value development be defined as parameters enabling the performance of extensive partial impact analyses. The model thus comprises a total of 20 parameters that can be altered to make simulations of expected returns and financial viability.
5.1. Assumptions concerning the investment and the facility to be brought into existence as a result of the project
5.1.1. Investment cost
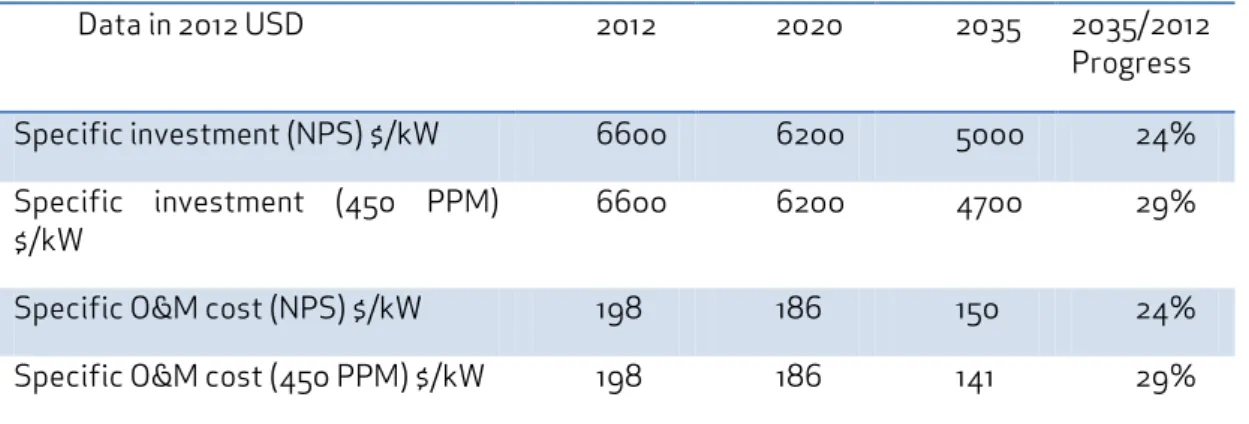
The present paper does not examine risks due to potential overruns of investment costs or to delays, yet it is nevertheless clear that any delay or cost overrun as related to the investment may have a most negative effect on the project‟s being worthwhile. According to our optimistic initial hypothesis concerning investment, the SPV will be able to complete the envisaged project at the planned EUR 12.5 billion cost, that is, at a specific investment cost of EUR 5200 per kW. This value can be seen as realistic based on international comparisons, and it corresponds by and large to the European data in the calculation appendix prepared for the 2014 World Energy Investment Outlook publication of the International Energy Agency (Table2)16.
Table 2 – Nuclear technology forecasts used in World Energy Outlook, 2014 for the New Policy (NPS) and the 450 PPM scenarios
Data in 2012 USD 2012 2020 2035 2035/2012
Progress
Specific investment (NPS) $/kW 6600 6200 5000 24%
Specific investment (450 PPM)
$/kW
6600 6200 4700 29%
Specific O&M cost (NPS) $/kW 198 186 150 24%
Specific O&M cost (450 PPM) $/kW 198 186 141 29%
Although at first sight data from the International Energy Agency apparently confirms that Paks-2 NPP cannot be regarded as expensive compared to other similar facilities when knowing the relevant international data, the table actually highlights a new dimension for a serious – and as yet unanswered – problem regarding the Paks project. For Agency experts forecast a 24%-29% investment and operation cost reduction in relation to nuclear technology in the coming one-and-a-half decades, which means that Paks-2 NPP will probably be an expensive power plant and one that is more expensive to operate than nuclear power plants entering the market at that time. Many have criticized the 2014 decision on many
16 WEO publishes its data in US dollars (USD). The Energy Agency applies the EUR 0.78= USD 1 conversion rate for the 2012 USD.
13
occasions for imposing an unreasonable burden on the domestic energy system in the envisaged period of “overlap” when, until the mid-2030s, the current and the new Paks power plants will be operating simultaneously, according to plans. Parallel operation will require temporary investments (expansion of the powerline network, additional cooling) that will make the project more expensive and also complicate the market options as regards selling the surplus electricity. If, moreover, a nuclear power plant entering the market in the mid- 2030s is cheaper by one quarter and will be cheaper to operate by the same order of magnitude due to innovations taking place in applied nuclear technology meanwhile, this circumstance is yet another „input‟ into why Hungary should not commence any investments early to replace its existing nuclear power plant capacities. For early investment is likely to result in a relatively expensive and expensive-to-operate power plant that might exert a negative effect for more than half a century on Hungarian power generation costs - and, hence, on power prices payable by consumers.
5.1.2. Timeframe of the investment
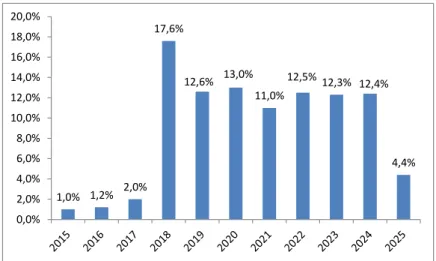
In modelling the expected timeframe for the investment, we relied to a significant extent on the paper by Romhányi, who provided a detailed assessment of the expected timetable for work to be carried out via an analysis of international examples. The present study has as its base the timeframe specified by him, with two minor modifications. The modifications concern the data between 2015 and 2017 and in the period 2025-2026; while between 2018 and 2024, we have made use of reference paper data. The two modifications are the following:
1) Romhanyi indicates 2024 and 2026 as the date of completion for investment in the two units, which is in line with the expected technical roadmap. The present paper simplifies this, seeing 2025 as the completion date for both units. Consequently, no new investment value may be expected for 2026. (The reference paper puts 4.4% of the total investment into 2026.)
2) The reference paper starts the investment in 2018, whereas investment expenditure will actually start earlier, according to the Budget Acts for 2015 and 2016. We thus posted 4.2% of the total investment to the period between 2015 and 2017.
Figure 2 - Roadmap for envisaged investment
In our calculation model, we have capitalized the investments in one sum, in 2026. On the balance sheet, within the tangible assets, 30% of investments is capitalized in relation to land and buildings, while 70% takes on board technical equipment, machinery and vehicles.
1,0% 1,2% 2,0%
17,6%
12,6% 13,0%
11,0%12,5% 12,3% 12,4%
4,4%
0,0%
2,0%
4,0%
6,0%
8,0%
10,0%
12,0%
14,0%
16,0%
18,0%
20,0%
14
5.1.3. Operational life and renewal needed during the operation time period With regard to the planned operational life of the power plant, we have accepted the assumption of Aszódi et al. (2014), calculating with an operational life of sixty years.
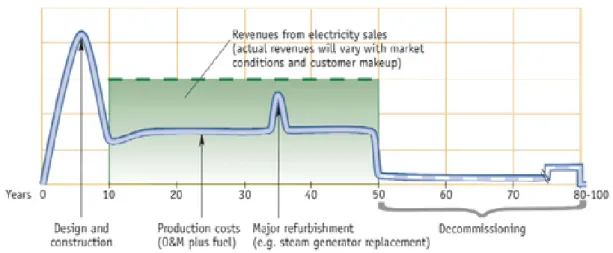
Accordingly, we modelled the operation of the power plant up until 2085. However, we dispute their assumption that no supplementary investments will be needed during the period of operations. In line with data from the international technical literature (Rogner, 2012), we assumed a major mid-term overhaul during the period of operations, making its extent parameterizable. We set as the initial value of the parameter a supplementary, renovation-type investment affecting 30% of the value of machinery and equipment within the context of a mid-term overhaul. The fact that new investments are needed also in the last third of the lifetime of an active power plant is well-illustrated by the time series occurring for the past five years of Paksi Atomerőmű Zrt. The power plant has made new investments of HUF 86 billion overall starting from 2010.
Table 3 - New investment in the reference year at Paksi Atomerőmű Zrt., 2010-2015 (million HUF)
2010 2011 2012 2013 2014
New investment in the reference year 17,892 21,559 16,420 17,260 13,226
Figure 3 – Illustrative cash flow for the total lifecycle of a nuclear power station (source:
International Nuclear Energy Agency, Rogner, 2012)
5.1.4. Accounted-for depreciation
The straight-line method was used for depreciation accounting. The depreciation base is the total investment amount, which is to be capitalized in 2026. Two depreciation rates were defined: an annual 2% for land, buildings, and an annual 4% for technical equipment and machinery. The depreciations rates can be modified within the model‟s parameters.
Depreciation for new investments occurring as part of the mid-term overhaul was defined by using a depreciation rate of 4%.
15
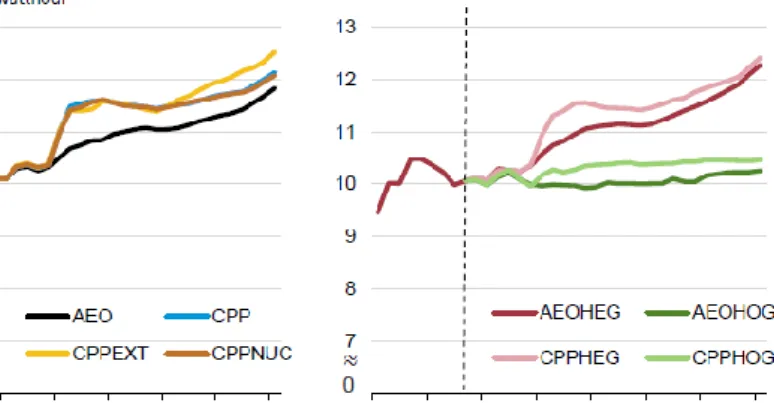
5.2. Assumptions concerning the development of sales turnover
The sales turnover of the power plant is influenced by two factors: the market price of electricity, and the capacity utilization rate of the power plant. We have defined parameters for both factors, and conducted sensitivity analyses relating to their different values.
5.2.1. Expected development of power plant market prices
Power generation is liberalized within the European Union: power plants develop their sales prices in competition with each other. Power generators are typically price-takers rather than price-setters; they have limited options to influence market prices. The present paper models this circumstance by defining two parameters: the market price rate and the capacity utilization rate of the power plant, both values being freely alterable in function of the expectations for the future.
It is difficult to make a pre-estimation of the expected development of market prices over the planned sixty-year lifetime of the Paks power plant, but several forecasts have been released for the coming two decades.
The European Commission study published in March 2014 calculates with a power market producer price increase of 2.4% p.a. between 2011 and 2020, and there will be a slight decrease for the time periods 2021-2030 and 2031-2050 (at -0.17% and -0.19%, respectively).17 This expected growth will lead to a 23% increase in the wholesale price of electricity for the period of the planned commissioning of the power plant, by 2026, which will moderate to less than 21% by the beginning of the 2030s at 2011 prices.
According to the May 2015 analysis of the US government - which examines the scenarios for change-overs to the production of green energies - the real power price growth rates for households will be 5.7%-10.6% by 2020 and 11.4-16.3% by 2030, according to the scenarios modelling various production structures. The same figures for industrial consumers are 5.8-11.6% until 2020 and 11.5-17.3% overall until 2030.18
Figure 4 – Average consumer power prices under the various Clean Power Plan scenarios, from 2005 to 2040. (Source: US Energy Information Administration, 2015)
17 EU(2014), p. 213.
18 US. EIA (2015). The percentage rates referred to above are percentage values calculated from the table on p.23. of the paper.
16
According to the June 2014 forecast of the British system operator National Grid, baseload power wholesale prices are expected to increase in the UK market by -16% to +13%
in real terms by 2026, whereas by 2035, a real price decline relative to 2015 will be from 4%
to 38%. Table 4 shows the market price forecasts of the paper for 2026 and 2035, respectively.19
Table 4 - Expected baseload wholesale prices in the UK market, 2015-2035. (Based on National Grid data, calculated with a 2.38% long-term UK inflation rate.)
£/MWh
Current prices
Real prices (P2015=100%) , 2.38%
inflation rate
2015 2026 2035 2026 Δ2026/2015 2035 Δ2035/2015
High price 66.0 96.1 101.6 74.2 13% 63.5 -4%
Base case 54.5 76.0 77.1 56.1 3% 44.4 -19%
Low price 46.9 54.2 52.1 39.5 -16% 29.3 -38%
In summary here, the values indicated in the three papers show that forecasts for the wholesale power prices expected in the mid-2020s are spread over a wide range, from -16%
to +26%. To define the initial value of the price growth parameter (real price growth of 25%
to 2026, a price change corresponding to the generate inflation rate afterwards), the present paper started out from the EU 2014 forecast, but did utilize a somewhat more favourable premise for the power plant than the three aforementioned papers based on the assumption that power prices will not go down in real value from 2026 onwards.
19 The data series of the National Grid (2014) paper is downloadable also in excel format from the http://www2.nationalgrid.com/UK/Industry-information/Future-of-Energy/Future-Energy-Scenarios/ website. The data series comprises current price values that we have adjusted to relate to constant prices by using the http://www.tradingeconomics.com/united-kingdom/forecast long-term inflation forecasts for the 2020s.
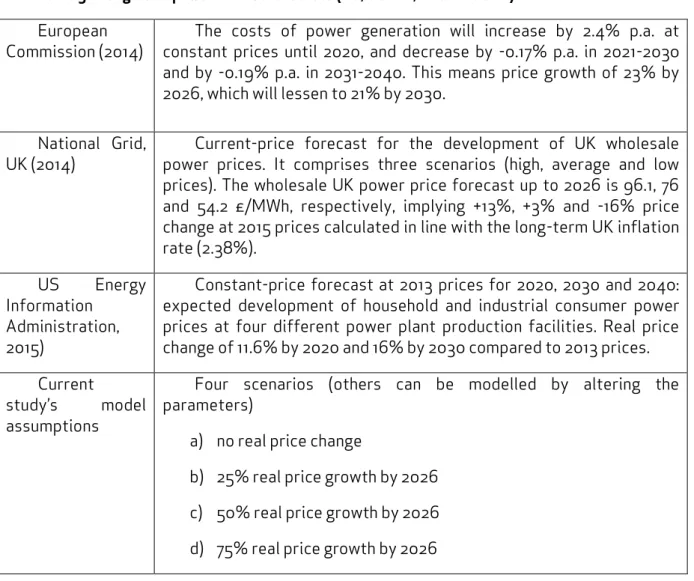
17
Table 5 - Long-term power market forecasts (EU; US EIA, National Grid) European
Commission (2014)
The costs of power generation will increase by 2.4% p.a. at constant prices until 2020, and decrease by -0.17% p.a. in 2021-2030 and by -0.19% p.a. in 2031-2040. This means price growth of 23% by 2026, which will lessen to 21% by 2030.
National Grid, UK (2014)
Current-price forecast for the development of UK wholesale power prices. It comprises three scenarios (high, average and low prices). The wholesale UK power price forecast up to 2026 is 96.1, 76 and 54.2 £/MWh, respectively, implying +13%, +3% and -16% price change at 2015 prices calculated in line with the long-term UK inflation rate (2.38%).
US Energy Information
Administration, 2015)
Constant-price forecast at 2013 prices for 2020, 2030 and 2040:
expected development of household and industrial consumer power prices at four different power plant production facilities. Real price change of 11.6% by 2020 and 16% by 2030 compared to 2013 prices.
Current
study‟s model assumptions
Four scenarios (others can be modelled by altering the parameters)
a) no real price change
b) 25% real price growth by 2026 c) 50% real price growth by 2026 d) 75% real price growth by 2026
Since the development of wholesale prices is considered a key parameter, the relevant model calculations were made in relation to four different scenarios. The four scenarios:
a) The wholesale (market) prices realized by the power plant 20 do not increase in real terms (the Paks nuclear power plant can bring about wholesale power prices of EUR 51 per MWh in 2026 and EUR 58 per MWh in 2035 at current prices).
b) The wholesale (market) prices realized by the power plant increase in real terms by 25% (the Paks nuclear power plant can bring about wholesale power prices of EUR 64 per MWh in 2026 and EUR 73 per MWh in 2035 at current prices).
c) The wholesale (market) prices realized by the power plant increase in real terms by 50% (the Paks nuclear power plant can bring about wholesale power prices of EUR 77 per MWh in 2026 and EUR 88 per MWh in 2035 at current prices).
20 The 2013 net output of the Paks Nuclear Power Plant was 14.4 TWh according to the MAVIR statistical yearbook. This means a specific power price of HUF 12.88 per kWh, i.e. a sales price of EUR 43.39 per MWh at the exchange rate of 2013.
18
d) The wholesale (market) prices realized by the power plant increase in real terms by 75% (the Paks nuclear power plant can bring about wholesale power prices of EUR 89 per MWh in 2026 and EUR 102 per MWh in 2035 at current prices).
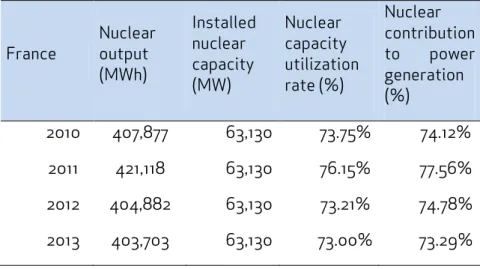
5.2.2. Capacity utilization during operation
Capacity utilization is defined essentially by a combination of technical characteristics and market opportunities. The objective for baseload generating facilities is to achieve the highest possible utilization rate, in excess of 90% on an annual average if possible. The model defines the expected capacity utilization rates by separate parameters for the time period 2026 to 2034, when the new units will be operating together with the existing ones,21 and for the time period after 2034. Using two different time periods is justified by the fact that, in the period of the combined operations of the existing and the new Paks units, the contribution of domestic nuclear generation to the energy balance will probably be the highest globally. The utilization rate of the French nuclear power plants characterized by a similarly high nuclear output ratio (70%+) was 73-76% in recent years, suggesting that it is advisable to calculate also with more pessimistic utilization rates for high nuclear contributions as the sales possibilities for an excessive amount of baseload energy may be temporarily limited.
Table 6 - Output and capacity utilization rates for French nuclear power plants, 2010-2013 (Calculation based on the ENTSO-E database)
France
Nuclear output (MWh)
Installed nuclear capacity (MW)
Nuclear capacity utilization rate (%)
Nuclear contribution to power generation (%)
2010 407,877 63,130 73.75% 74.12%
2011 421,118 63,130 76.15% 77.56%
2012 404,882 63,130 73.21% 74.78%
2013 403,703 63,130 73.00% 73.29%
We defined four scenarios also for capacity utilization:
a) permanently low utilization (75% for the entire operating period);
b) average utilization (85% for the entire operating period);
c) average utilization (85%) in the years of the parallel operation of the old and new units, then high (92%) utilization (base case scenario set out in the model);
d) permanently high utilization (92% for the entire operating period).
21 As a matter of fact, the existing power plant units will be decommissioned gradually from 2032 to 2037 according to the lifetime extension plans. The 2034 threshold value of the model simplifies somewhat this decommissioning process.
19
In our opinion, there are professional arguments in favour of each and every scenario.
Permanently low utilization is conceivable if stable demand for baseload energy keeps decreasing due to the further spread of renewable energies. There has already been a period, in 2014, when 74% of the demand of the total German energy system was satisfied by renewable resources. The 2014 forecast of the German Öko-Institut puts the number of hours within a year when power prices will drop practically to zero due to the satisfaction of the total demand by producers using renewable bases at as many as 2700 hours in 2035 and 3700 in 2045.22
The argument in favour of high utilization is that baseload generators will have their place to some extent in the long term, too, within an integrated European market. Thus, an investment already undertaken may produce permanently high utilization rates due to its relatively low variable costs (while the market price associated with high utilization is a different issue).
5.3. Development of operating costs
We relied partly on technical literature data and partly on fact data relating to the current Paks power plant to make a plan of likely operating costs for the power plant company. Special attention is given among costs to fuel costs, personnel expenses and costs associated with the future decommissioning of the power plant, and also to waste storage costs.
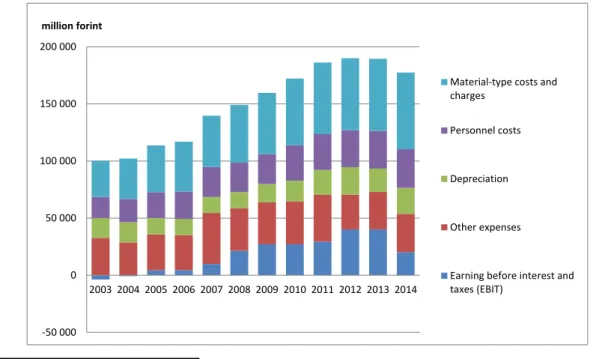
5.3.1. Fact costs for Paksi Atomerőmű Zrt.
In Appendix 1, we give a detailed overview of the development of the expenses and turnover of Paks Nuclear Power Plant from 2003 to 2014 based on the annual reports of the company. Figure 5 shows the development of principal expense items and trade results for the past decade.
Figure 5 – Trade results (EBIT) and main expenses by cost type for Paksi Atomerűmű Zrt., 2003- 2014
22Based on the presentation held by Felix Matthes on 17 April 2014 in Budapest.
-50 000 0 50 000 100 000 150 000 200 000
2003 2004 2005 2006 2007 2008 2009 2010 2011 2012 2013 2014 million forint
Material-type costs and charges
Personnel costs
Depreciation
Other expenses
Earning before interest and taxes (EBIT)
20
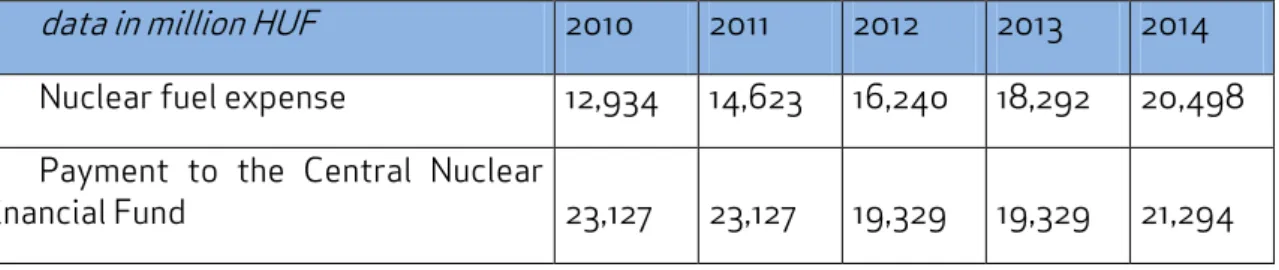
As is obvious from the data series that the power plant‟s operations are affected by four main expense factors. In the category of material-type charges, the costs of nuclear fuel excel. Other expenses include payments by the power plant to the Central Nuclear Financial Fund (CNFF) to finance its waste management and also prospective dismantling operations.
Table 7 – Paksi Atomerőmű Zrt. fuel expenses and payments to CNFF, 2010-2014
data in million HUF 2010 2011 2012 2013 2014
Nuclear fuel expense 12,934 14,623 16,240 18,292 20,498 Payment to the Central Nuclear
Financial Fund 23,127 23,127 19,329 19,329 21,294
5.3.2. Modelling of fuels expenses
To determine fuel costs, we started out from the fact costs pertaining to nuclear fuel used by the current power plant, noting actual capacity values as defined by the utilization rate and by the plant size of the new power plant.
5.3.3. Other material cost and charges
Other raw materials and consumables and material charges were defined on the basis of values laid out in the 2013 report of Paksi Atomerőmű Zrt. External charges incurred by Paksi Atomerőmű Zrt. regularly amounted to HUF 32 to 35 billion in the past five years. We used the lowest fact values - data for 2013 - as starting values for the model calculations. The value of external charges was also determined on the basis of 2013 data (HUF 3 billion). The starting data was converted to EUR at the 2013 exchange rate and increased according to the long-term inflation rate. This methodology assumes that the expense items concerned can be regarded as fixed ones and will not increase because of the larger plant size of the new power plant, i.e. they would result in cost levels that are 20% lower than the current one‟s given an identical utilization rate.
5.3.4. Personnel costs
Personnel costs were defined via the same method as above in relation to material charges. To determine the base value, we took into account 2013 fact wage costs and payments to personnel, converted those into EUR and then raised them in line with the inflation rate. We assumed that the final headcount would be attained gradually over the investment period, in the years preceding commissioning. Higher values indicated for 2024- 2025 are explained by the fact that a significant part of the necessary staff will probably have to be available already for the period of training and for the test run.
Table 8 – Envisaged personnel costs in the investment period 2021-2026
(million euros) 2021 2022 2023 2024 2025 2026
Personnel costs 3 3 15 38 77 130
21 5.3.5. Other charges and taxes payable
In the other charges line, we took into account domestic business tax and payments to the Central Nuclear Financial Fund. The local business tax was calculated in relation to the sales revenue adjusted for material costs, at a 2% rate.
As for CNFF payments, the starting parameter value of the model is EUR 6 per MWh.
Calculated on the basis of sales data, in 2013 the power plant paid a unit EUR 4.5/MWh. The increase here is warranted by the fact that at current payment levels, Nuclear Fund resources would probably not provide full-scale cover for the costs related to waste management and decommissioning.23
In terms of taxation, the model exclusively takes into account a corporate tax rate fixed at 16%. The value being set is freely modifiable as a parameter. Although, to date, the power plant pays other industry-specific special taxes comparable in order of magnitude to the corporate tax - or exceeding it - we did begin with the assumption that it is not advisable to include such special tax items in any ROI calculation in a modelling period of 70 years.
5.4. Financing
The model was drawn up based on the initial assumption that, normally, the owner would only provide a EUR 2.5 billion equity financing, corresponding to 20% of the planned investment. We considered this equity financing – as in the case of the Russian loan – fixed, and treated it separately from the other financing considerations affecting the firm. In the model, equity financing increases the subscribed capital of the company, and the owner will transfer this resource to the company according to the investment schedule. The financing costs for the Russian loan were laid out in the model in line with the fact values from accessible official documents.
If, during operations, the company lands in a situation where it loses its total equity, then, in line with civil law rules, the company owner will be obliged to restore the equity situation, as we have indicated in the balance sheet related to the restricted reserves.
The company will pay a dividend to shareholders if its profit after taxes is positive and the equity exceeds the subscribed capital. The dividend rate can be parameterized: a dividend rate corresponding to 80% of the profit for any given year was defined.
5.4.1. Resources subject to interest
Where the equity situation of the company makes it possible, any supplementary financing needs incurred during the given year will be covered via the drawing of short-term (bridging) loans. The rate of interest on such loans will be parameterizable. The base value is set at 8%.
Any accumulation of financial instruments at the company is treated by the model on the assets side of the balance sheet, in the “Securities” column. The company will have interest income on the securities, the rate of which can also be set as a parameter (starting value:
4%).
23Aszódi et al. (2014) envisage HUF 2/kWh in their paper, which is more or less identical with our modelled value at the current exchange rate.
22 5.4.2. Working capital policy
The working capital policy of the company was determined by defining certain premises in relation to accounts receivable, the investment and other accounts payable. Any working- capital-related assumption can be modified freely in line with the parameters of the model.
The rotation time for accounts receivable was defined at 30 days, similarly to that for the accounts payable. For the latter item, material and other charges were taken into account as a projection base. For the investment accounts payable, a rotation time of 90 days - which is more favourable for the power plant company - was taken into account. For a determining of other accounts payable, the projection base came from personnel expenses and the general turnover tax position of the company.
6. SUMMARY OF RESULTS
As emphasized already in the introductory section of this paper, the primary objective of drawing up a financial model was to examine how realistic the government declarations are when expecting that the Paks-2 NPP project will be financially viable on its own, i.e. without needing any additional capital support. This is why, in addition to determining the net present value, we examined whether realization of any given scenario implied a periodic or final supplementary financing on behalf of the owner.
6.1. ROI and supplementary financing needs in specific modelled scenarios
Table 8 gives a summary of the model results for the scenarios presented earlier. The table shows the net present value for a given scenario at a real rate of discount of 5%. Where the 5% discount rate led to a positive NPV, return on investment calculated with a discount factor of 10% is also shown. In the table, the Tmax value of the given scenario indicates the supplementary equity financing that will need to be satisfied by the owner of the company in addition to the originally envisaged EUR 2.5 billion for the power plant company to keep it operational. The Hmax value is the maximum supplementary borrowing amount - that is, the value of what is to be borrowed by the company in addition to the Russian loan from external creditors (or from the owner) under a given scenario. In the table, the background of the cells for scenarios implying negative NPV and a significant supplementary financing requirement for shareholders is coloured red, whereas a green background refers to the scenarios under which their terms of implementation for the project may be reasonable.