1
Behavior of two-chamber microbial electrochemical systems started-up with different ion-exchange membrane separators
László Koók1, Elie Desmond-Le Quéméner2, Péter Bakonyi1, Jan Zitka3, Eric Trably2, Gábor Tóth1, Lukas Pavlovec3, Zbynek Pientka3, Nicolas Bernet2, Katalin Bélafi-
Bakó1,*, Nándor Nemestóthy1
1Research Institute on Bioengineering, Membrane Technology and Energetics, University of Pannonia, Egyetem ut 10, 8200 Veszprém, Hungary
2LBE, Univ Montpellier, INRA, Narbonne, France
3Institute of Macromolecular Chemistry, AS CR, Heyrovsky Sq. 2, 162 06 Prague 6, Czech Republic
*Corresponding Author: Prof. Katalin Bélafi-Bakó Tel: +36 88 624726
E-mail: bako@almos.uni-pannon.hu
2
Abstract
In this study, microbial fuel cells (MFCs) – operated with novel cation- and anion-exchange membranes, in particular AN-VPA 60 (CEM) and PSEBS DABCO (AEM) – were assessed comparatively with Nafion proton exchange membrane (PEM). The process characterization involved versatile electrochemical (polarization, electrochemical impedance spectroscopy – EIS, cyclic voltammetry – CV) and biological (microbial structure analysis) methods in order to reveal the influence of membrane-type during start-up. In fact, the use of AEM led to 2-5 times higher energy yields than CEM and PEM and the lowest MFC internal resistance (148 ± 17 Ω) by the end of start-up. Regardless of the membrane-type, Geobacter was dominantly enriched on all anodes.
Besides, CV and EIS measurements implied higher anode surface coverage of redox compounds for MFCs and lower membrane resistance with AEM, respectively. As a result, AEM based on PSEBS DABCO could be found as a promising material to substitute Nafion.
Keywords: bioelectrochemical system; microbial fuel cell; membrane;
separator; microbial community structure; principal component analysis
3
1. Introduction
Bioelectrochemical systems (BES) represent a versatile platform where depending on the actual needs, (i) electrical energy can be harvested by microbial fuel cells (MFCs) (Logan et al., 2006) or (ii) a wider range of value- added substances e.g. H2, alcohols, acids, etc. can be produced in microbial electrolysis cells (MECs) (Zhen et al., 2017) and via microbial electrosynthesis (MES) (Bajracharya et al., 2017; Srikanth et al., 2018). Besides, there are possibilities to integrate classical membrane processes with BES and this way, design coupled systems for water desalination in microbial desalination cells (MDC), to gain enhanced electric power in microbial reverse-electrodialysis cells (MRC) and to assist clean water recovery in osmotic microbial fuel cells (OsMFC) (Yang et al., 2019).
Although these set-ups serve different purposes, they do keep features in common, particularly in terms of certain biotic and abiotic characteristics.
For instance, all of them are assisted by electrode-surface living, electrochemically-active bacteria (EAB) (Carmona-Martínez et al., 2018;
Heidrich et al., 2016; Kouzuma et al., 2018). Additionally, the essential transfer of ions between the (anode and cathode) electrodes in order to complete the cell reaction is mediated by physical separator(s), typically a membrane(s) (Bajracharya et al., 2017; Bakonyi et al., 2018a; Daud et al., 2015; Leong et al., 2013). Hence, because of the interrelated nature of these complex factors related with electro-microbiology and material science, a multidisciplinary approach is required to improve the performance of BES (Patil et al., 2015), where the properties of the constructional elements, especially those of membrane separators play notable role (Koók et al., 2017, 2019; Oliot et al., 2016).
For a long-sustaining BES operation with adequate steady-state performance, the start-up period has crucial importance (Boghani et al., 2013;
Liu et al., 2011; Sato et al., 2009; Wang et al., 2009). As it has been found, among many factors, the start-up is inherently affected by the composition and
4
history of the inoculum (Bakonyi et al., 2018b) as well as the actual membrane type, as shown in papers such as Gildemyn et al. (2017). Further studies i.e.
Sotres et al. (2015) and Suzuki et al. (2016) investigating the effect of membrane separators in various BES experienced the significant impact of the material on the microbial communities, their dynamics and enrichment.
Therefore, as seen from the above examples, membrane materials should be carefully tested in BES to reveal their influence on the development of the whole microbial ecosystem.
In this work, novel membrane materials not yet tested in BES, in particular (i) AN-VPA 60 (poly - (vinylphosphonic acid - co - acrylonitrile) (Zitka et al., 2015) and (ii) PSEBS (polystyrene - block - poly (ethylene - ran - butylene) - block - polystyrene) functionalized by DABCO (1,4 - diazabicyclo - [2.2.2] - octane) (Hnát et al., 2017) as cation- and anion-exchange membranes (CEM and AEM), respectively, were applied as separators in MFC to assess their effect on the start-up phase. The start-up (adaptation) period of bioelectrochemical systems aims to facilitate the primary biofilm formation on the electrode surface(s) and achieve thereafter stabilized system performance (Carmona-Martinez et al., 2015). To make a comprehensive process evaluation, the MFC employing different membranes were monitored via complex electrochemical techniques such as whole cell polarization, cyclic voltammetry (CV), electrochemical impedance spectroscopy (EIS).
Furthermore, to complement the results, the analysis of microbial community structures (considering the population in the original inoculum, the anode and bulk) was carried out by metagenomics. The CEM and AEM were compared to Nafion proton exchange membrane (PEM) – a subtype of CEM – which is by far the most often used standard/reference for BES investigations. In the authors’ opinion, the outcomes of this research could be useful to better explain the behavior of bioelectrochemical systems in response to the changes in cell architecture.
5
2. Materials and Methods
2.1. MFC setups
In this study, two-chamber MFC constructions – introduced in details by previous article of Koók et al. (2019) – were adopted. In essence, carbon felt (Zoltek PX35, Zoltek Corp., USA) was used as anode with 30 cm2 apparent surface area, meanwhile the 8 cm2 cathode electrode was made of Pt/carbon paper (0.3 mg Pt cm-2, FuelCellsEtc, USA). Titanium wiring (Sigma-Aldrich, USA) was employed to complete the external circuit with varied resistors (Re) according to Section 3.1. The cathode compartment contained 160 mL of 50 mM, pH = 7.2 phosphate buffer. The anode side was inoculated with 80 mL activated sludge (pH set to 7 ± 0.2) with microbial community characteristics shown and discussed in Section 3.4. The other 80 mL of the anolyte was 50 mM, pH = 7.2 phosphate buffer supplemented with acetate to ensure 5 mM carbon source concentrations in the beginning of each MFC operating cycle (Fig. 1). Once the recorded cell potential approached the initial, a subsequent test cycle commenced with repetitive feeding of acetate. The MFCs were running at 35 °C. All the MFC were assembled identically except in terms of the membrane separator (with 5 cm diameter) between the anode and cathode chambers. The list of membranes used in this investigation is as follows: (i) Nafion 115 (Sigma-Aldrich, USA) as PEM, (ii) AN-VPA 60 (Zitka et al., 2015) as CEM and (iii) DABCO functionalized PSEBS as AEM (Hnát et al., 2017).
2.2. Membrane materials
AN-VPA (poly(vinylphosphonic acid-co-acrylonitrile) CEM membrane was synthetized via the procedure described by Zitka et al. (2015). This copolymer of VPA with acrylonitrile (AN) was suggested as an alternative solid electrolyte material to be used in H2/O2 fuel cells. DABCO (1,4- diazabicyclo[2.2.2]octane) functionalized PSEBS (polystyrene-block-
6
poly(ethylene-ran-butylene)-block-polystyrene) was prepared according to Hnát et al. (2017) and presented originally as an innovative anion-selective polymer for alkaline water electrolysis to separate electrode compartments.
Nafion 115 PEM, for benchmarking purposes, was purchased from commercial supplier (Sigma-Aldrich, USA) and used in MFC after pretreatment in accordance with Koók et al. (2019). Before use in MFCs, all membranes were immersed for 24 hours in deionized water to be properly swollen.
2.3. Cyclic Voltammetry
The CV analysis was carried out with Ag/AgCl (3 M KCl solution) reference electrodes inserted to each anode chamber. The measurements were performed under non-turnover conditions (when acetate substrate was depleted) with a potentiostat device (PalmSens 3, PalmSens, Netherlands with PSTrace 5.0 software) connected in a 3-electrode configuration: anode – working electrode; cathode – counter electrode; Ag/AgCl (3 M KCl) – reference electrode. The CV scan rate and the anode potential window was set to 1 mV s-1 and (+)0.25 V – (-)0.65 V, respectively.
2.4. Electrochemical Impedance Spectroscopy
EIS was recorded with the same potentiostat as mentioned in Section 2.3. applying two-electrode arrangement: anode – working electrode; cathode:
counter as well as reference electrode. 10 mV and 50 kHz – 1 mHz was employed as AC amplitude and frequency range, respectively. The EIS spectra were obtained with acetate substrate at the peak electricity generation period using open circuit MFC operation (started 2 h in advance). Equivalent circuit model was fitted with EIS Spectrum Analyser program (ABC Chemistry).
7
2.5. Assessment of MFC electrical efficiency
Similar to our earlier paper (Koók et al., 2019), electric current (i, mA) and power (P, mW) produced by the MFCs were delivered taking into consideration the registered cell voltages (U, mV) as well as the external resistor. Thereafter YS, reflecting the energy recovery (kJ) from a certain mass of COD (m(CODin) in grams) (contained in the substrate added to the MFCs) was calculated, as stated in Eq. 1:
𝑌𝑆 = ∫ 𝑃(𝑡)𝑑𝑡
𝜏 0
𝑚(𝐶𝑂𝐷𝑖𝑛) 𝐴 (1)
where A is the apparent anode area (m2).
2.6. MFC polarization
The MFC polarization curves – in order to estimate the total internal resistance of each reactor (Ri) – were obtained by the “varied external resistor”
technique, where Re ranged between 7.5 kΩ and 15 Ω. For every resistor value, the potential difference was monitored between the anode and cathode and stabilized values (taking approx. 20 min) were registered. From these data, the (U vs. i) plots were created and Ri was derived from the slope of the actual fitted straight lines.
2.7. Microbial community analysis and bioinformatics tools
In this work, processing of samples (taken from MFC anode, bulk (anolyte), inoculum) in terms of (i) DNA extraction, (ii) PCR amplification and (iii) sequencing was conducted in accordance with our recent paper (Bakonyi et al., 2018b). The raw sequencing reads were demultiplexed and adapter- trimmed by using MiSeq Control Software (Illumina). Data were then analyzed
8
using the FROGS pipeline (Escudié et al., 2018) as follows: Sequences were dereplicated and amplicons with less than 450 nucleotides or more than 650 nucleotides were discarded. Sequences were clustered using SWARM (Mahé et al., 2014) with an aggregation distance of 3. Chimeras were removed with VSEARCH (Rognes et al., 2016). Singletons were removed using the abundance filter. Taxonomic affiliations were performed with RDP classifier (Wang et al., 2007) using Silva 132 16S reference database (Quast et al., 2013). Finally, data was imported in R and bacterial diversity was analyzed using Phyloseq package (McMurdie and Holmes, 2013). Principal Component Analyses (PCA) were performed using FactoMineR package (Lê et al., 2008).
3. Results and Discussion
3.1. Performance analysis of MFCs during acetate-promoted start-up period
Start-up of a microbial electrochemical system e.g. MFC can be in general considered accomplished once the monitored output parameters, for instance current generation profiles (from feeding to feeding cycles, under similar environmental settings) are stabilized, comparable, reproducible (Carmona-Martínez et al., 2015). This was achieved by the end of approx. 30 days of operation in all cases (comprising of 7 feedings with acetate), regardless of the membrane used (Fig. 1).
Once the assembly of the reactors was done, the continuous monitoring of voltage between the anode and cathode through an external resistor (1 kΩ) was initiated. In this early stage of operation – since the supplemented anaerobic sludge itself could have contained biologically consumable organic compounds – the MFCs were operated without the addition of acetate substrate, to accomplish a pre-starvation step. This may be supportive in order to eliminate (utilize) the bio-degradable material present in the inocula, as well as to provide time for the species to initially adapt to the special environment in
9
the microbial electrochemical system. In our measurements, this period was carried out within the first 6 days, resulting in current density (i) increase for all MFCs as it can be seen in Fig. 1A. The maximal current density peak values were noted at the 4th day with 90 – 100 mA m-2 for PEM-MFC and AEM-MFC, while CEM-MFC showed values only below 30 mA m-2.
The first addition of acetate was done on the 6th day. As it is observable in Fig. 1A, electrochemical activity of the microbes was positively affected by the substrate feeding based on the significant current generation. AEM-MFC produced slightly higher maximal current density (imax) than PEM-MFC and CEM-MFC (176 mA m-2, 170 mA m-2 and 156 mA m-2, respectively) (Fig. 1A).
Nearly the same could be observed in the second acetate feeding cycle on the 8th day and in addition, it is noteworthy that imax of CEM-MFC increased compared to the first feeding.
In parallel with the third substrate addition, the external resistance was switched from 1 kΩ to 270 Ω (indicated by arrow on Fig. 1A) with the purpose of keeping the external load and the internal resistance of the MFCs in the same order of magnitude (the details on the internal resistance are discussed in Section 3.3), as it is advantageous to run the MFC close to its so-called cell design point (Raghavulu et al., 2009).
In the followings, there was a general trend during acetate feeding cycles, reflecting that the AEM-MFC – showing current density signals between 370 – 495 mA m-2 – significantly outperformed both the PEM-MFC and CEM-MFC for which the imax appeared between 220 – 300 mA m-2 and 235 – 350 mA m-2, respectively. It is worth mentioning that in the 3rd and 4th cycle, the MFC equipped with Nafion membrane generated the lowest current density. At the next feeding, imax of PEM-MFC increased and remained more or less stable in the subsequent stages. Meanwhile, a slight decrease in imax
could be observed in case of CEM-MFC at the 7th batch acetate supplementing cycle compared to its values in the previous steps.
The interpretation of energy recovery efficiencies for MFCs operated with various membrane separators can be viewed in Fig. 1B. As it is shown,
10
the energy yields (Ys) were not considerably different for AEM-MFC and PEM- MFC in the first batch, while relatively to these, CEM-MFC underperformed.
From the second cycle and onwards, the AEM-MFC demonstrated the highest YS, followed by PEM-MFC and lastly, the CEM-MFC. Interestingly, while YS of PEM-MFC and CEM-MFC remained more or less steady over time from the 4th acetate addition, the AEM-MFC provided salient values in the 5th and 6th cycles (YS = 343 ± 29 and 400 ± 64 kJ g-1 m-2 in average, respectively), leading to 2.1 – 3 and 3.8 – 5.1 times higher YS compared to PEM-MFC and CEM-MFC, respectively.
At the final (7th) step of the start-up process, the Ys were shown as 238
± 25 kJ g-1 m-2, 132 ± 7.4 kJ g-1 m-2 and 78 ± 9.4 kJ g-1 m-2 for AEM-MFC, PEM-MFC and CEM-MFC, respectively. Thus, it can be concluded that the MFC equipped with AEM could exceed YS of those installed with Nafion and CEM by 1.8 and 3.1 times, respectively (Fig. 1B).
Besides, considering the cumulative energy values of the whole start-up period (Fig. 1C), the AEM-MFC performed significantly better than PEM-MFC and CEM-MFC, by approximately 1.3- and 2.8-fold, respectively. The founding that AEM-MFC was able to work more efficiently in the start-up phase than PEM- and CEM-equipped MFCs may be associated with membrane-related aspects. In particular, (i) differences of transport processes taking place across the different membranes, (ii) the effect of the membrane on the development of the biological apparatus and its electrochemical activity over time, (iii) the membrane (bio)fouling properties and their sensitivity towards (bio)fouling, (iv) the membrane mechanical and chemical properties, etc. could be important factors and play roles (Bakonyi et al., 2018a; Koók et al., 2019, 2017). In the following sections, it was aimed to further elaborate on MFC behaviors from electrochemical and biological aspects.
11
3.2. Evolution of electrode potentials during start-up in MFCs equipped with different membrane separators
The time course of open circuit voltages (OCV) and the anode/cathode potentials (versus Ag/AgCl, 3 M KCl) reference electrode system unless otherwise stated) can be seen in Figs. 2A and B, respectively. As for OCV, an increasing tendency could be noted in the first two weeks for all reactors reaching similar values around 0.75 V (Fig. 2A). On the 18th day, the OCV of PEM-MFC decreased (compared to further stages) while AEM-MFC and CEM- MFC kept on showing the increase of OCV. At the 5th acetate feeding cycle (21th day), OCV of CEM-MFC began to decline and at the 6th cycle, it approached as low value (0.74 ± 0.12 V) as in case of PEM-MFC (0.73 ± 0.15 V). Meanwhile, OCV in AEM-MFC was still getting enhanced, resulting in 0.79
± 0.15 V (Fig. 2A). The differences were more pronounced at the last acetate supplementation cycle of the start-up, where AEM-MFC produced about 10 % and 20 % higher OCVs in comparison with CEM-MFC and PEM-MFC, respectively.
Fig. 2B indicates that anode potentials (EA) changed as expected towards more negative values. At the 3rd acetate addition (14th day), both PEM-MFC and CEM-MFC demonstrated EA as low as -0.35 ± 0.07 V and -0.36
± 0.03 V, respectively, while it was slightly higher in AEM-MFC (EA = -0.27 ± 0.02 V). In the consecutive acetate feedings, EA got more negative and comparable for each MFCs (-0.4 ± 0.03 V). This may imply the successful acclimation of exoelectrogenic microbes to the anodic environment and substrate, or in other words, the appropriate start-up process (to be further evaluated in Section 3.4 from a biological viewpoint) (Koók et al., 2019).
However, unlike in case of EA, remarkable alterations could be observed in the cathode potentials (EC) (Fig. 2B). In the first week of operation, EC of each MFC reached an average value of +0.45 ± 0.09 V whilst thereafter, a decreasing tendency was noticed, pointing to the emerging issue of different cathodic potential losses (the theoretical value of EC at pH = 7.0 and pO2 = 0.2
12
bar can be as high as +0.595 V (vs Ag/AgCl, 3 M KCl) (Logan et al., 2006)). It can be inferred that EC for AEM-MFC was stabilized at +0.40 ± 0.04 V after the 18th day (4th acetate dosage). In contrast, EC in case of CEM-MFC and PEM- MFC reached a final potential of +0.33 ± 0.04 V and +0.27 ± 0.02 V, respectively.
In summary, alterations of EC (meaning the potential occurrence of cathodic losses) contributed significantly to the depression of measured cell voltage. Considering that the catholyte as well as the cathode material were the same in the experiments regardless of the membrane used, the changes and main differences in MFC performance were assumed to be related with mass transport processes through the various membranes. As a matter of fact, as Sleutels et al. (2017) presented, the differences of ion transports via AEM and CEM/PEM are quite meaningful. Using CEM/PEM in a BES, an extra energy (potential) loss could appear linked to transport across the membrane (on the top of the energy losses of the electrode reactions due to pH imbalance). This extra (potential) loss is originated from the membrane potential, which is negative and hence, energy is dissipated once positively- charged species i.e. protons have to pass through (Sleutels et al., 2017).
Nevertheless, in case of AEM, the negative membrane potential is much more beneficial while transporting negatively charged ions. Thus, the observations made here might reflect to the theoretical benefits of using an AEM as a membrane in BES.
3.3. Polarization behavior and the separation of internal resistance components
By carrying out polarization measurements, useful information can be extracted about the MFCs’ behaviors i.e. in terms of the total internal resistance (Ri). Ri is a useful (explicit) indicator of extracellular losses present in MFCs (Logan et al., 2006) and often essential for deeper analysis of their origins.
13
In this work, cell polarization was carried out at various states of MFC start-up period (on 10th, 14th, 24th and 28th days at maximal acetate utilizing cycle) to provide information about the cells’ internal resistance and changes in the course of system start-up. Actually, significant decreases could be observed in term of Ri throughout the operation as the MFCs developed till the 24th day, as it can be seen in Table 1. At the end of start-up period, the final Ri
of AEM-MFC was more than 50 % and 60 % lower than that of the MFCs employing PEM and CEM, respectively. As for reference, the main characteristics of MFCs – among which Ri plays an important role – can be compared with the literature. As it can be inferred – by considering numerous research studies such as Koók et al. (2019), Mathuriya and Pant (2018), Pasupuleti et al. (2016), Rossi et al. (2018), Sotres et al. (2015), Suzuki et al.
(2016) and Wei et al. (2013) – Ri varies usually in the order of few hundreds to thousands of Ω and it is not only the function of the actual MFC type, but also the separator material.
The Ri, in accordance with Eq. 2, can be assumed as the product of charge transfer resistance at the electrodes (RCT), the diffusion resistance (RD) and the electrolyte (solution + solid) resistances, which incorporates the resistance of the membrane as solid electrolyte component (RM+S).
𝑅𝑖 = 𝑅𝑀+𝑆+ 𝑅𝐶𝑇 + 𝑅𝐷 (2)
Applying EIS, estimates of the terms on the right hand side of Eq. 2 (RCT,
RD, RM+S) can be delivered (Nam et al., 2010). Therefore, EIS analysis was carried out at the final stage of the start-up. Following the method of Wei et al.
(2013), equivalent circuit model (ECM) was applied for data analysis, which contained the following elements: charge transfer resistances (RCT) for both electrode, double layer capacitances (CDL), the sum of membrane and solution resistances (RM+S), as well as a so-called Warburg element (W). By data fitting to the whole-cell ECM, RCT and RM+S components of Ri could be simply
14
obtained. Afterwards, by knowing Ri, RCT and RM+S, the diffusion resistance (RD) can be obtained from Eq. 2.
The outcomes of EIS measurements are listed and can be seen in Table 2. As a main observation, it can be said that obviously the diffusion resistance played the major part in Ri, in a good agreement with some other reports in literature (Hutchinson et al., 2011; Zhang et al., 2011). This means that diffusion process of various chemical species had significant – by chance, rate-limiting – contribution to the overall cell reaction. However, the fact that RD
was ~ 50 % and 66 % lower in case of AEM-MFC than for PEM-MFC and CEM-MFC, respectively, leads to the assumption that differences in (membrane-related) mass transport through AEM compared to PEM/CEM were quite important. Thus, AEM and related transfer of various species might contribute to the reduction of mass transfer limitations in MFCs (to a given extent). Taking into account Fig. 2B about the steady-state EC and the actual EIS analysis, the advantage of the AEM seems to be justified i.e. because of limiting the cathode-side performance-limiting aspects.
3.4. Microbial community analysis
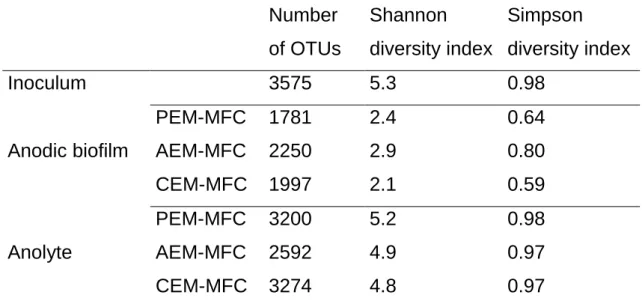
To make the evaluation of membrane effects on MFC behaviors more complete, the assessment of the anode compartment where biological phenomena take place is required. Hence, samples (besides the inoculum) from the anodic biofilms and anolytes at the end of the experiments were taken for DNA extraction and sequencing of variable region V3-V4 of 16S bacterial rDNA (Bakonyi et al., 2018b). 373901 sequences with a mean length of 510 nucleotides were thus obtained after quality filtering. These sequences were clustered into 7087 operational taxonomic units (OTUs) with numbers of OTUs ranging from 3575 in inoculum to 1781 in PEM-MFC anodic biofilm.
Diversity indexes computed from OTUs counts are shown in Table 3.
Bacterial diversity appears to be lower in all biofilms and all anolytes than in the initial inoculum which exhibits the higher diversity indexes (number
15
of OTUs, Shannon index and Simpson index). This indicates a bacterial selection in anodic biofilms and anolytes of the MFCs. This selection was particularly strong in the biofilms as shown by the very low diversity indexes, with Shannon indexes ranging from 2.1 to 2.9 while Shannon indexes in anolytes range from to 4.8 to 5.2. This low diversity in biofilms is associated with both low richness (low numbers of OTUs) and low evenness (low Simpson indexes) indicating that a relatively low number of bacterial phyla were able to settle on the anodes and that the final biofilms were dominated by few phyla.
Taxonomic assignation of OTUs was then performed to analyze and compare bacterial community structures of the various samples. Relative abundances of major bacterial orders were used to perform PCA (Fig. 3). This analysis allows differentiating microbial communities from anodic biofilms, anolytes and inoculum on both dim 1-axis and dim 2-axis of the PCA. Bacterial communities associated to biofilms all have low components on dim 2-axis but appear to have very negative components on dim 1-axis (Fig. 3A) associated with high relative abundances of Desulfuromonadales (Fig. 3B). On the contrary, bacterial communities from the anolyte have low components on dim 1-axis but very positive components on dim 2-axis (Fig. 3A) associated with high relative abundances of Spirochaetales, Bacteroidales and Betaproteobacteriales among others (Fig. 3B). Finally, the bacterial community of the inoculum has both a very positive component on dim 1-axis (Fig. 3A) associated with high relative abundances of Caldisericales, Planctomycetales and Xanthomonadales among others (Fig. 3B) and a very negative component on dim 2-axis (Fig. 3A). These results indicate that some bacterial orders were similarly selected in the various anodic biofilms or in the various anolytes, independently of the reactor setup. Thus, the main selection pressures in the MFCs were probably linked with the development of the electroactive biofilm and of the associated bacterial community in the anolyte, independently of the different types of membranes used in the different reactors.
16
To better understand the reasons for the selection of the major bacterial orders identified from the PCA, the bacterial communities’ structures were then analyzed at genus level. Distributions of major genera with relative abundances above 5% in at least one sample are shown in Fig. 4.
These major genera account for 86.4±3.4% of the sequences obtained from biofilms, 49.0±6.7% of sequences obtained from anolytes and only 24.0%
of sequences obtained from the inoculum. This is congruent with low to high bacterial diversities measured for anodic biofilms, anolytes and inoculum respectively (Table 3). The anodic biofilms appear dominated by bacteria from the Geobacter genus (Desulfuromonadales) with high relative abundances ranging from 46.5% to 69.4%. The relative abundances of this genus were, on the contrary, very low in the inoculum (<0.1%) and in the anolytes (0.5%-1.1%) which indicates that it probably has a very strong competitive advantage for the development of electroactive biofilms. This was confirmed by a more precise identification of the representative sequence of the main OTU affiliated to Geobacter. It is indeed 99 % identical to Geobacter anodireducens (NCBI Reference Sequence NR_126282) which is well-known for its ability to form electroactive biofilms and to oxidize acetate with an anode as sole electron acceptor (Sun et al., 2014). This dominance of Geobacter in the biofilms explains the relatively low Simpson indexes associated with their bacterial communities (Table 3) and their clustering driven by order Desulfuromonadales observed in Fig. 3. Other major Genera selected in biofilms (relative abundance >5%) are Pseudomonas and Hydrogenophaga which are known to encompass electroactive species (Kimura and Okabe, 2013; Koch and Harnisch 2016;) and Blvii28 wastewater-sludge group which comprises anaerobic fermenters already found associated with electroactive biofilms oxidizing acetate (see for example Flayac et al. (2018)). Interestingly all of them had low or very low abundances in the inoculum, indicating again a strong competitive advantage associated with electroactivity. This advantage probably also explains the emergence of Proteiniphilum, Brachymonas and Thauera which were rare in the inoculum but constitute major genera in
17
anolytes. Contrary to other genera, Pseudomonas, Brachymonas and Thauera appear to be specifically selected in biofilms and anolytes of the AEM-MFC, CEM-MFC and PEM-MFC respectively. However, a lack of biological replicates here prevents drawing any conclusion on a possible influence of the membrane on the bacterial selection. The analysis of these major genera found at the anode of the various MFCs thus confirms that the main selection pressures driving the structuration of the bacterial community were linked with the development of its electroactivity with systematic emergence of Geobacter, Blvii28 wastewater-sludge group, Hydrogenophaga and Proteiniphilum independently of the membranes used in the reactors.
3.5 Cyclic voltammetry profiles of the MFCs equipped with various membranes
As it could be seen in Section 3.4, the microbial community analysis showed a more or less parallel evolution of species distribution on MFC anodes, leading to the dominance of Geobacter in each MFC. However, it is to underline that abundance of microbes on the electrode surface and the microbial composition of the biofilm could indicate mainly the qualitative similarities in the MFCs, but do not provide additional quantitative information that may contribute to the explanation of differences observed in the performances. Therefore, the microbial community analysis was complemented by cyclic voltammetry measurements to give an implicit estimation about quantitative aspect of the electrochemically-active biofilms.
In Fig. 5 the CV curves taken in abiotic systems (inset) and after the acclimation period (day 30) under non-turnover conditions are shown, meaning that acetate is assumed to be depleted in the anode chamber. Under these conditions, the presence and area of redox peaks on the voltammograms is representative to redox systems (mediator molecules, redox enzyme complexes in the electrode-attached biofilm) present in the anode surrounding (LaBelle and Bond, 2009).
18
As it can be drawn from Fig. 5, oxidation peak appeared for each MFC in the anode potential range of (-)0.38 and (-)0.28 V as well as between (-)0.11 and 0.0 V (vs. Ag/AgCl, 3 M KCl). In case of the former oxidation peaks, corresponding reduction peaks were also detected, resulting in midpoint potentials of the redox systems at (-)0.44 V, (-)0.43 V and (-)0.39 V for AEM- MFC, CEM-MFC and PEM-MFC, respectively. These observations are in sufficient correlation with literature data published related to the redox systems present in Geobacter biofilms with oxidation peak and midpoint potentials of multiheme cythochromes OmcZ, OmcB and periplasmic cythochrome C PpcA between (-)0.43 – (-)0.37 V, and (-)0.42 – (-)0.37 V (vs. Ag/AgCl) (Marsili et al., 2008; Zhu et al., 2012). Furthermore, Zhu et al. (2012) reported the appearance of oxidation peaks in the potential window of (-)0.15 and (+)0.02 V (vs. Ag/AgCl) at given anodic incubation potentials, however, nor corresponding reduction peak, neither the related extracellular electron transport component could be assigned with firm conviction, similarly to our present case. Thus, to roughly characterize the electrochemical activity of the anodic biofilm layers in our MFCs, the peaks in the more negative anode potential range ((-)0.44 – (-)0.39 V) were taken into account below.
In general, for each peak, the surface coverage () of the given redox components on the electrode (in mol cm-2) can be calculated according to Eq.
4 (LaBelle and Bond, 2009):
𝛤 = 𝑄
𝑛∙𝐹∙𝐴 (4)
where Q is the charge (Coulombs) derived from the integration of peak area, n is the amount of electrons per redox molecule (assumed to be 10 e- per redox protein according to Schrott et al., (2011)), F is the Faraday constant and A is the surface of the anode (in cm2).
By integrating the area of oxidation peaks noticed in the more negative anode potential region and deriving the , it appeared that the surface redox protein coverage was the highest for the AEM-MFC anode with value of 1.12 x
19
10-9 mol cm-2, followed by the PEM-MFC and CEM-MFC anodes (8.19 x 10⁻¹⁰ mol cm-2 and 3.52 x 10⁻¹⁰ mol cm-2), respectively, which are far beyond the theoretical value (~ 10-2 mol cm-2) of an electrode covered by a redox protein monolayer (Schrott et al., 2011). This may imply the presence of different non- surface-associated redox systems and their rapid electron acceptance as suggested by LaBelle and Bond (2009). In our case, however, the estimation of surface coverage and thus, quantitative characterization of anodic biofilms’
of electro-activity may provide the further explanation for the performance differences among the MFCs.
It could be observed that the AEM was able to facilitate the enhanced electrochemical activity in the MFC, which might be ascribed to the different ion transfer processes and the related overcoming of pH splitting (H+ accumulation and parallel pH decrease in the anode chamber that may inhibit the bacteria). In summary, it seems that the membrane’s role on the MFC efficiency was not only significant in cathodic aspects (as discussed in Section 3.2) but also, the use of different types of membranes might have an effect on the surface coverage of redox proteins in the anode-surface biofilm, supporting the reliable operation.
20
4. Conclusions
This study compared the performance of MFCs constructed with various membrane separators. It has turned out from the comprehensive electrochemical and biological evaluation that among 3 proton-, cation- and anion-exchange membranes tested, the deployment of AEM resulted in the highest energy yield, lowest MFC internal resistance and in essence, the most reliable operation during the start-up process. It is to deduce that the AEM made of PSEBS DABCO could have the potential to govern the MFC towards adequate stabilization in a more efficient way than Nafion PEM.
Acknowledgement
László Koók was supported by the ÚNKP-18-3 ‘‘New National Excellence Program of the Ministry of Human Capacities”. The János Bolyai Research Scholarship of the Hungarian Academy of Sciences is duly acknowledged for the support. The co-authors teams were supported by the PHC Balaton program n°40219WG funded by the French Embassy in Hungary/French Ministry of Europe and Foreign Affairs and the National Research, Development and Innovation Office in Hungary. From the Hungarian side, Project no. 2017-00015 has been implemented with the support provided from the National Research, Development and Innovation Fund of Hungary, financed under the 2017-2.2.5-TÉT-FR funding scheme.
21
References
1. Bajracharya, S., Srikanth, S., Mohanakrishna, G., Zacharia, R., Strik, D.P., Pant, D., 2017. Biotransformation of carbon dioxide in bioelectrochemical systems: State of the art and future prospects. J.
Power. Sources 356, 256-273.
2. Bakonyi, P., Koók, L., Kumar, G., Tóth, G., Rózsenberszki, T., Nguyen, D.D., et al., 2018a. Architectural engineering of bioelectrochemical systems from the perspective of polymeric membrane separators: A comprehensive update on recent progress and future prospects. J.
Membr. Sci. 564, 508-522.
3. Bakonyi, P., Koók, L., Keller, E., Bélafi-Bakó, K., Rózsenberszki, T., Saratale, G.D., et al., 2018b. Development of bioelectrochemical systems using various biogas fermenter effluents as inocula and municipal waste liquor as adapting substrate. Bioresour. Technol. 259, 75-82.
4. Boghani, H.C., Kim, J.R., Dinsdale, R.M., Guwy, A.J., Premier, G.C., 2013. Control of power sourced from a microbial fuel cell reduces its start-up time and increases bioelectrochemical activity. Bioresour.
Technol. 140, 277-285.
5. Carmona-Martínez, A.A., Lacroix, R., Trably, E., Da Silva, S., Bernet, N., 2018. On the actual anode area that contributes to the current density produced by electroactive biofilms. Electrochim. Acta 259, 395-401.
6. Carmona-Martínez, A.A., Trably, E., Milferstedt, K., Lacroix, R., Etcheverry, L., Bernet, N., 2015. Long-term continuous operation of H2
in microbial electrolysis cell (MEC) treating saline wastewater. Water Res. 81, 149-156.
7. Daud, S.M., Kim, B.H., Ghasemi, M., Daud, W.R.W., 2015. Separators used in microbial electrochemical technologies: Current status and future prospects. Bioresour. Technol. 195, 170-179.
22
8. Escudié, F., Auer, L., Bernard, M., Mariadassou, M., Cauquil, L., Vidal, K., et al., 2018. FROGS: Find, Rapidly, OTUs with Galaxy Solution.
Bioinformatics 34, 1287-1294.
9. Flayac, C., Trably, E., Bernet, N., 2018. Microbial anodic consortia fed with fermentable substrates in microbial electrolysis cells: Significance of microbial structures. Bioelectrochemistry 123, 219-226.
10. Gildemyn, S., Verbeeck, K., Jansen, R., Rabaey, K., 2017. The type of ion selective membrane determines stability and production levels of microbial electrosynthesis. Bioresour. Technol. 224, 358-364.
11. Heidrich, E.S., Curtis, T.P., Woodcock, S., Dolfing, J., 2016.
Quantification of effective exoelectrogens by most probable number (MPN) in a microbial fuel cell. Bioresour. Technol. 218, 27-30.
12. Hnát, J., Plevová, M., Zitka, J., Paidar, M., Bouzek, K., 2017.
Anion-selective materials with 1,4-diazabicyclo[2.2.2]octane functional groups for advanced alkaline water electrolysis. Electrochim. Acta 248, 547-555.
13. Hutchinson, A.J., Tokash, J.C., Logan, B.E., 2011. Analysis of carbon fiber brush loading in anodes on startup and performance of microbial fuel cells. J. Power Sources 196, 9213-9219.
14. Kimura, Z. Okabe, S., 2013. Hydrogenophaga electricum sp. nov., isolated from anodic biofilms of an acetate-fed microbial fuel cell. J.
Gen. Appl. Microbiol. 59, 261-266.
15. Koch, C., Harnisch, F., 2016. Is there a specific ecological niche for electroactive microorganisms?. ChemElectroChem 3, 1282-1295.
https://doi.org/10.1002/celc.201600079
16. Koók, L., Nemestóthy, N., Bakonyi, P., Göllei, A., Rózsenberszki, T., Takács, P., et al., 2017. On the efficiency of dual-chamber biocatalytic electrochemical cells applying membrane separators prepared with imidazolium-type ionic liquids containing [NTf2]− and [PF6]− anions. Chem. Eng. J. 324, 296-302.
23
17. Koók, L., Kaufer, B., Bakonyi, P., Rózsenberszki, T., Rivera, I., Buitrón, G., et al., 2019. Supported ionic liquid membrane based on [bmim][PF6] can be a promising separator to replace Nafion in microbial fuel cells and improve energy recovery: A comparative process evaluation. J. Membr. Sci. 570-571, 215-225.
18. Kouzuma, A., Ishii, S., Watanabe, K., 2018. Metagenomic insights into the ecology and physiology of microbes in bioelectrochemical systems. Bioresour. Technol. 255, 302-307.
19. LaBelle, E., Bond, D.R., 2009. Cyclic voltammetry for the study of microbial electron transfer at electrodes. In Bioelectrochemical Systems:
From Extracellular Electron Transfer to Biotechnological Application. In:
Rabaey, K., Angenent, L., Schroder, U., Keller, J. (eds). London: IWA Publishing, pp. 137–152.
20. Lê, S., Josse, J., Husson, F., 2008. FactoMineR: An R Package for Multivariate Analysis. J. Stat. Softw. 25.
https://doi.org/10.18637/jss.v025.i01
21. Leong, J.X., Daud, W.R.W., Ghasemi, M., Liew, K.B., Ismail, M., 2013. Ion exchange membranes as separators in microbial fuel cells for bioenergy conversion: A comprehensive review. Renew. Sustain.
Energy Rev. 28, 575-587.
22. Liu, G., Yates, M.D., Cheng, S., Call, D.F., Sun, D., Logan, B. E., 2011. Examination of microbial fuel cell start-up times with domestic wastewater and additional amendments. Bioresour. Technol. 102, 7301- 7306.
23. Logan, B.E., Hamelers, B., Rozendal, R., Schröder, U., Keller, J., Freguia, S., et al., 2006. Microbial fuel cells: methodology and technology. Environ. Sci. Technol. 40, 5181-5192.
24. Mahé, F., Rognes, T., Quince, C., de Vargas, C., Dunthorn, M., 2014. Swarm: robust and fast clustering method for amplicon-based studies. PeerJ 2, e593. https://doi.org/10.7717/peerj.593
24
25. Marsili, E., Rollefson, J.B., Baron, D.B., Hozalski, R.M., Bond, D.R., 2008. Microbial biofilm voltammetry: direct electrochemical characterization of catalytic electrode-attached biofilms. Appl. Environ.
Microbiol. 74, 7329-7337.
26. Mathuriya, A.S., Pant, D., 2018. Assessment of expanded polystyrene as a separator in microbial fuel cell. Environmental Technol.
https://doi.org/10.1080/09593330.2018.1435740
27. McCurdie, P.J., Holmes, S., 2013. phyloseq: An R Package for Reproducible Interactive Analysis and Graphics of Microbiome Census
Data. Plos ONE 8, e61217.
https://doi.org/10.1371/journal.pone.0061217
28. Nam, J.Y., Kim, H.W., Lim, K.H., Shin, H.S., Logan, B.E., 2010.
Variation of power generation at different buffer types and conductivities in single chamber microbial fuel cells. Biosens. Bioelectron. 25, 1155- 1159.
29. Oliot, M., Galier, S., Roux de Balmann, H., Bergel, A., 2016. Ion transport in microbial fuel cells: Key roles, theory and critical review.
Appl. Energy 183, 1682-1704.
30. Pasupuleti, S.B., Srikanth, S., Dominguez‐Benetton, X., Mohan, S.V., Pant, D., 2016. Dual gas diffusion cathode design for microbial fuel cell (MFC): optimizing the suitable mode of operation in terms of bioelectrochemical and bioelectro‐kinetic evaluation. J. Chem. Technol.
Biotechnol. 91, 624-639.
31. Patil, S.A., Gildemyn, S., Pant, D., Zengler, K., Logan, B.E., Rabaey, K., 2015. A logical data representation framework for electricity-driven bioproduction processes. Biotechnol. Adv. 33, 736-744.
32. Quast, C., Pruesse, E., Yilmaz, P., Gerken, J., Schweer, T., Yarza, P., et al., 2013. The SILVA ribosomal RNA gene database project: improved data processing and web-based tools. Nucleic Acids Res. 41, D590-D596.https://doi.org/10.1093/nar/gks1219
25
33. Raghavulu, S.V., Mohan, S.V., Goud, R.K., Sarma, P.N., 2009.
Effect of anodic pH microenvironment on microbial fuel cell (MFC) performance in concurrence with aerated and ferricyanide catholytes. Electrochem. Commun. 11, 371-375.
34. Rognes, T., Flouri, T., Nichols, B., Quince, C., Mahé, F., 2016.
VSEARCH: a versatile open source tool for metagenomics. PeerJ 4, e2584. https://doi.org/10.7717/peerj.2584
35. Rossi, R., Yang, W., Zikmund, E., Pant, D., Logan, B.E., 2018. In- situ biofilm removal from air cathodes in microbial fuel cells treating domestic wastewater. Bioresour. Technol. 265, 200-206.
36. Sato, C., Martinez, R.G., Shields, M.S., Perez-Gracia, A., Schoen, M.P., 2009. Behaviour of microbial fuel cell in a start-up phase. Int. J.
Environ. Eng. 1, 36-51.
37. Schrott, G.D., Bonanni, P.S., Robuschi, L., Esteve-Nuñez, A., Busalmen, J.P., 2011. Electrochemical insight into the mechanism of electron transport in biofilms of Geobacter sulfurreducens. Electrochim.
Acta 56, 10791-10795.
38. Sleutels, T.H., ter Heijne, A., Kuntke, P., Buisman, C.J., Hamelers, H.V., 2017. Membrane selectivity determines energetic losses for ion transport in bioelectrochemical systems. ChemistrySelect 2, 3462-3470.
39. Sotres, A., Díaz-Marcos, J., Guivernau, M., Illa, J., Magrí, A., Prenafeta-Boldú, F.X., et al., 2015. Microbial community dynamics in two-chambered microbial fuel cells: effect of different ion exchange membranes. J. Chem. Technol. Biotechnol. 90, 1497-1506.
40. Srikanth, S., Singh, D., Vanbroekhoven, K., Pant, D., Kumar, M., Puri, S.K., et al., 2018. Electro-biocatalytic conversion of carbon dioxide to alcohols using gas diffusion electrode. Bioresour. Technol. 265, 45- 51.
41. Sun, D., Wang, A., Cheng, S., Yates, M., Logan, B.E., 2014.
Geobacter anodireducens sp. nov., an exoelectrogenic microbe in
26
bioelectrochemical systems. Int. J. Syst. Evol. Microbiol. 64, 3485-3491.
https://doi.org/10.1099/ijs.0.061598-0
42. Suzuki, K., Owen, R., Mok, J., Mochihara, H., Hosokawa, T., Kubota, H., et al., 2016. Comparison of electrochemical and microbiological characterization of microbial fuel cells equipped with SPEEK and Nafion membrane electrode assemblies. J. Biosci. Bioeng.
122, 322-328.
43. Wang, Q., Garrity, G.M., Tiedje, J.M., Cole, J.R., 2007. Naive Bayesian classifier for rapid assignment of rRNA sequences into the new bacterial taxonomy. Appl. Environ. Microbiol. 73, 5261-5267.
44. Wang, X., Feng, Y., Ren, N., Wang, H., Lee, H., Li, N., et al., 2009. Accelerated start-up of two-chambered microbial fuel cells: Effect of anodic positive poised potential. Electrochim. Acta 54, 1109-1114.
45. Wei, B., Tokash, J.C., Zhang, F., Kim, Y., Logan, B.E., 2013.
Electrochemical analysis of separators used in single-chamber, air- cathode microbial fuel cells. Electrochim. Acta 89, 45-51.
46. Yang, E., Chae, K.J., Cho, M.J., He, Z., Kim, I.S., 2019. Critical review of bioelectrochemical systems integrated with membrane based technologies for desalination, energy self-sufficiency, and high efficiency water and wastewater treatment. Desalination 452, 40-67.
47. Zhang, F., Pant, D., Logan, B.E., 2011. Long-term performance of activated carbon air cathodes with different diffusion layer porosities in microbial fuel cells. Biosens Bioelectron. 30, 49-55.
48. Zhen, G., Lu, X., Kumar, G., Bakonyi, P., Kaiqin, X., Youcai, Z., 2017. Microbial electrolysis cell platform for simultaneous waste biorefinery and clean electrofuels generation: Current situation, challenges and future perspectives. Prog. Energy Combust. Sci. 63, 119-145.
49. Zhu, X., Yates, M.D., Logan, B.E. 2012. Set potential regulation reveals additional oxidation peaks of Geobacter sulfurreducens anodic biofilms. Electrochem. Commun. 22, 116-119.
27
50. Zitka, J., Bleha, M., Schauer, J., Galajdová, B., Paidar, M., Hnát, J., et al., 2015. Ion exchange membranes based on vinylphosphonic acid-co-acrylonitrile copolymers for fuel cells. Desalin. Water Treat. 56, 3167-3173.
28
Table 1 – Internal resistance values of MFCs equipped with various membranes within start-up period
Internal resistance (Ri, Ω)
Time (d) PEM-MFC AEM-MFC CEM-MFC
10 384 ± 19 224 ± 10 512 ± 34
14 364 ± 23 178 ± 18 403 ± 22
24 345 ± 19 152 ± 24 390 ± 30
28 340 ± 11 148 ± 17 386 ± 19
29
Table 2 – Estimated component values of MFCs’ overall internal resistance via whole-cell EIS measurements
MFC ID RM+S (Ω) RCT (Ω) RD (Ω) Ri (Ω)
PEM-MFC 57 ± 5 39 ± 2 244 ± 6 340 ± 13
AEM-MFC 18 ± 2 10 ± 2 120 ± 7 148 ± 11
CEM-MFC 21 ± 1 7 ± 1 358 ± 5 386 ± 7
30
Table 3 – Diversity indexes computed from OTUs counts obtained from the inoculum, anodic biofilms and anolytes of the MFCs.
Number of OTUs
Shannon diversity index
Simpson diversity index
Inoculum 3575 5.3 0.98
Anodic biofilm
PEM-MFC 1781 2.4 0.64
AEM-MFC 2250 2.9 0.80
CEM-MFC 1997 2.1 0.59
Anolyte
PEM-MFC 3200 5.2 0.98
AEM-MFC 2592 4.9 0.97
CEM-MFC 3274 4.8 0.97
31
Figure Legends
Fig. 1 – A: Current density profiles of different MFCs at 5 mM acetate additions during the start-up period; B: Energy yield values for the discrete acetate addition steps during the start-up period; C: Time course of cumulative energy production
Fig. 2 – A: time course of open circuit voltage of MFCs at maximal acetate utilization state; B: discrete anode and cathode potentials over time
Fig. 3 – Result of the principal component analysis (PCA) performed on relative abundances of major bacterial orders identified in the inoculum (in black), in anolytes (in blue) or in anodic biofilms (in red) of the MFCs. The individual factor map (A) shows positions of the various bacterial communities on the first two axes (dim 1 and dim 2), while the variable factor map (B) shows the contributions of bacterial orders to dim 1 and dim 2 of the analysis.
Only orders with a relative abundance >1% in at least two samples were used for the analysis
Fig. 4 – Bacterial community composition of inoculum (in black), anolytes (in blue) and anodic biofilms (in red) of the MFCs. Relative abundances are shown for bacterial genera with a relative abundance >5% in at least one sample. The bacterial orders are indicated at the bottom of the figure.
Fig. 5 – Cyclic voltammetry curves of MFC with various membranes; Inset: CV profiles of abiotic measurements
32
Fig. 1
33
Fig. 2
34
Fig. 3
35
Fig. 4
36
Fig. 5