1
Supported ionic liquid membrane based on [bmim][PF6] can be a
1
promising separator to replace Nafion in microbial fuel cells and improve
2
energy recovery: A comparative process evaluation
3
4
László Koók1, Barbara Kaufer1, Péter Bakonyi1,*, Tamás Rózsenberszki1, Isaac
5
Rivera2, Germán Buitrón3, Katalin Bélafi-Bakó1, Nándor Nemestóthy1
6
7
1Research Institute on Bioengineering, Membrane Technology and Energetics,
8
University of Pannonia, Egyetem ut 10, 8200 Veszprém, Hungary
9
10
2Institute of Environmental and Sustainable Chemistry, TU-Braunschweig,
11
Hagenring 30, 38106 Braunschweig, Germany
12
13
3Laboratory for Research on Advanced Processes for Water Treatment,
14
Instituto de Ingeniería, Unidad Académica Juriquilla, Universidad Nacional
15
Autónoma de México, Blvd. Juriquilla 3001, Querétaro 76230, Mexico
16 17 18 19 20
*Corresponding Author: Péter Bakonyi
21
Tel: +36 88 624385
22
E-mail: bakonyip@almos.uni-pannon.hu
23 24
2
Abstract
25 26
In this study, mixed culture bioelectrochemical systems were operated
27
with various membrane separators: one prepared with 1-Butyl-3-
28
methylimidazolium hexafluorophosphate ([bmim][PF6]) ionic liquid and another
29
one called Nafion, used as reference for comparative evaluation. In the course
30
of experiments, the primary objective was to reveal the influence of
31
membranes-type on microbial fuel cell (MFC) behavior by applying a range of
32
characterization methods. These included cell polarization measurements,
33
monitoring of dehydrogenase enzyme activity and cyclic voltammetry for the
34
analysis of anode biofilm properties and related electron transfer mechanism.
35
Additionally, MFC performances for both membranes were assessed based on
36
Coulombic efficiency as well as substrate (acetate) concentration dependency
37
of energy yields. As a result, it was demonstrated that the ionic liquid-
38
containing membrane could be suitable to compete with Nafion and appears
39
as a candidate to be further investigated for microbial electrochemical
40
applications.
41 42
Keywords: microbial fuel cell; membrane; separator; ionic liquid; cyclic
43
voltammetry; dehydrogenase enzyme activity
44 45
3
Notation list
46 47
MFC: microbial fuel cell
48
PEM: proton selective/exchange membrane
49
SILM: supported ionic liquid membrane
50
PEM-MFC: MFC equipped with Nafion 115 PEM
51
[bmim][PF6]: 1-butyl-3-methylimidazoluim hexafluorophosphate ionic liquid
52
ILM-MFC: MFC equipped with SILM (containing [bmim][PF6])
53
IL: ionic liquid
54
PVDF: polyvinylidene difluoride
55
DA: dehydrogenase enzyme activity [g mL-1 toluene]
56
CV: cyclic voltammetry
57
Re: external resistor in the MFC electric circuit [Ω]
58
Ri: total internal resistance of MFC [Ω]
59
V: electric voltage [mV]
60
I: electric current [mA]
61
P: electric power [mW]
62
Id: current density normalized to apparent anode surface area [mA m-2]
63
Pd: power density normalized to apparent anode surface area [mW m-2]
64
YS: specific energy yield (the electric energy recovered based on the COD
65
added and apparent anode surface area [kJ gCOD,in m-2]
66
CE: Coulombic efficiency [%]
67
TTC: 2,3,5-triphenyltetrazolium chloride
68
TF: triphenyl formazan
69
CDP: cell design point of MFC
70
OCV: open circuit voltage [mV]
71
Ea: anode electrode potential [mV]
72
Ec: cathode electrode potential [mV]
73
4
1. Introduction
74 75
Among microbial electrochemical systems, MFC technology is currently
76
one of the most rapidly developing one, having the ability to transform the
77
chemical energy (stored in various substrates) into the form of electricity by
78
exploiting the metabolism of so-called exoelectrogenic microorganisms [1]. As
79
it turned out from the research progress of the past years, not only simple
80
compounds (including sugars, alcohols, volatile fatty acids, etc., used mostly in
81
fundamental studies [2]), but also different complex, environmentally-
82
threatening waste streams can be seen as suitable as feedstocks to operate
83
the bioelectrochemical systems [3-8]. thus, MFCs show a good opportunity for
84
the simultaneous management of pollutants and production of electrical
85
energy [9].
86
So far, the widespread application of these biologically-assisted setups
87
has not been typically realized at an industrial level, however, some successful
88
implementations were communicated at real, scaled-up wastewater treatment
89
plants [10, 11]. The reason behind this, as a matter of fact, can be associated
90
with the notable number of existing challenges to be resolved so as to achieve
91
cost-effective operation and decent performance [9, 12]. Some of the hurdles
92
to overcome, besides microbiological aspects, are related to the MFC
93
architecture [13]. Basically, from this point of view, MFCs are classified as
94
single- and two-compartment devices, depending on the actual cell
95
configuration and in particular how the electrodes (anode and cathode, serving
96
as terminal electron acceptors and donors, respectively) are separated from
97
each other [14].
98
In case of dual-chambered constructions, the physical separators,
99
commonly membranes play a remarkable role (i.e. to maintain proton transfer
100
from anode to cathode) and should therefore reflect traits such as (i) chemical
101
stability, (ii) high ionic conductivity (or in other words, low membrane
102
resistance) [15], (iii) appropriate selectivity for protons [16] and low
103
permeability for oxygen (to defend the anaerobic conditions in the anode side)
104
5
[17]. In addition, the occurrence of pH splitting (the acidification of the anolyte
105
and alkalination of catholyte due to the transport of cations other than protons)
106
[18, 19], substrate cross-over and biofouling can also have significantly
107
negative effect on the current generation capability and overall energy
108
efficiency of MFCs. Hence, the development of membranes that fulfill these
109
requirements and manage to counteract such technological issues are of
110
interest.
111
As of now, PEMs are applied in most laboratory-scale MFC systems,
112
first and foremost made of Nafion [20]. However, in this case, insufficient
113
resistance to oxygen mass transfer and susceptibility of its sulfonate functional
114
groups to be occupied by cations (e.g. Na+ and K+ instead of protons) can lead
115
to remarkable decrease in MFC performance [21-23]. Recently, promising
116
advancements have been observed in the literature studies employing
117
alternative materials [24-31]. Among them, lately, membrane separators
118
prepared with ILs have gained attention [32-34]. Previously, the potential of
119
using certain SILM instead of Nafion was presented [33]. In a follow-up work
120
[34], the comparative evaluation of such IL-based membrane separators was
121
carried out, yielding useful feedback related to their oxygen and substrate
122
(acetate) mass transfer properties. As a continuation of this research line (to
123
deepen and further improve the knowledge), MFCs assembled with
124
membranes containing [bmim][PF6] ionic liquid were tested in the present
125
work. The bioprocess was assessed via:
126 127
- monitoring biological adaptation by dehydrogenase enzyme activity
128
- running cyclic voltammetry (CV) to characterize the mechanism electron
129
transfer
130
- conducting cell polarization to determine total internal resistances,
131
- performing electrochemical impedance spectroscopy (EIS) to evaluate the
132
contribution of (i) charge transfer, (ii) electrolyte (membrane+solution) and
133
implicitly the (iii) diffusion resistances.
134 135
6
It is believed that the outcomes delivered by this comprehensive
136
(microbiological + electrochemical) approach can assist the better
137
understanding of MFC behaviors (as a function of actual membrane type and
138
characteristics) and in such a way, enrich the relevant literature with
139
important/novel data.
140 141
2. Materials and Methods
142 143
2.1. Supported ionic liquid membrane (SILM) preparation
144 145
The SILMs were fabricated by immobilizing [bmim][PF6] ionic liquid
146
(IoLiTec, Germany) in the pores of hydrophobic Durapore PVDF microfiltration
147
supporting membrane (Sigma-Aldrich, USA). The diameters of the PVDF
148
membrane (116 m mean thickness) and its micropores were 8 cm and 0.22
149
m, respectively. 3 mL of [bmim][PF6] was used for membrane preparation
150
and before use, the membrane surface was gently cleaned to remove the
151
excess ionic liquid as much as possible. Until use, the SILM was stored in
152
sealed Petri-dish at room temperature (Some more information about the
153
procedure can be found elsewhere in our previous papers i.e. [33]). As a
154
result, the SILMs contained in average 20.5 mg cm-2 ionic liquid on basis of
155
(support) membrane surface area. This value is in the same order of
156
magnitude reported in our previous work [33] and also comparable to the
157
those documented by Hernández-Fernández et al. [32] using various IL-based
158
membrane separators in microbial fuel cells. The thickness of the prepared
159
SILMs in contact with electrolytes (swollen-state) was 125 m in average.
160
161
2.2. MFC setup
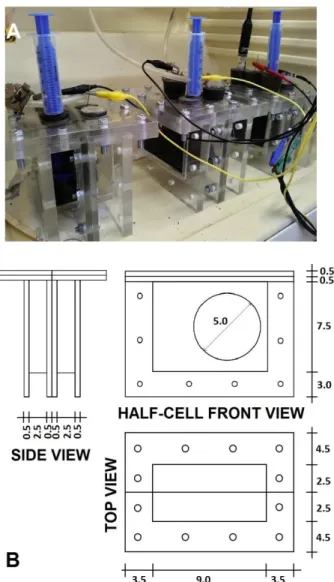
162 163
The two-chamber, batch MFCs used in this study were made of
164
plexiglass and operated with a working volumes of 160 mL (both anode and
165
cathode sides) (Fig. 1). The anode electrode with 26 cm2 of apparent surface
166
7
area was carbon felt (Zoltek PX35, Zoltek Corp., USA), while in the aerated
167
cathode chamber, carbon cloth (0.3 mg Pt cm-2, FuelCellsEtc, USA) as
168
cathode was used with apparent surface area of 8 cm2. Both electrodes were
169
connected to an external circuit through titanium wiring (Sigma-Aldrich, USA).
170
To monitor the potential difference between the anode and cathode
171
electrodes, the circuit comprised of 1 kΩ Re (Fig. 2A), which was changed
172
after two weeks of operation to 100 Ω (Fig. 2B) on the basis of polarization
173
measurements (revealing the significant reduction of internal resistance to this
174
order of magnitude). Phosphate buffer (50 mM, pH = 7) was used as catholyte
175
solution in this study. At the beginning, (80 mL) activated sludge collected from
176
the anaerobic pool of wastewater treatment plant (with pH adjusted to 7) was
177
filled to the anode chamber for inoculation. Information about the microbial
178
composition of the sludge can be found in our previous paper [35]. The rest of
179
the anolyte was phosphate buffer with Na-acetate as carbon source [22].
180
Acetate was dosed repeatedly in different amounts to ensure the actually
181
desired concentration (5 – 10 mM, Fig. 2). In each feeding cycles where the
182
acetate solution was loaded, the equivalent volume of spent media was drawn
183
before. Once the recorded voltage (closed-circuit potential difference between
184
the electrodes) dropped close to the initial, consecutive feeding was applied to
185
start the new experimental cycle.
186
The anode compartment was purged initially with nitrogen gas to
187
remove dissolved oxygen content. The anode and cathode chambers were
188
separated either by Nafion 115 PEM (Sigma-Aldrich, USA) or the SILM
189
membrane, both cut to circle shape with 8 cm diameter. The Nafion membrane
190
was pretreated before use as described by Ghasemi et al. [36]. The reactors
191
were placed in an incubator and operated under constant mesophilic
192
temperature of 35 °C. During CV measurements, an Ag/AgCl reference
193
electrode (filled with 3 M KCl solution) was inserted to the anode chamber of
194
the cells (more details on CV can be found in Section 2.3.4.).
195
8 196
Fig. 1 – Image (A) and scheme (B) of the MFCs used in this study.
197
Dimensioning is in cm.
198 199
2.3 Analysis and calculation
200 201
2.3.1. Calculations to report MFC efficiency
202 203
The cell voltage was continuously registered by using a data acquisition
204
device (National Instruments, USA). I and P were calculated based on Ohm’s
205
law (considering the actual value of external resistor applied in the circuit,
206
Section 2.2.). From these data, Id and Pd could be derived. YS, describing the
207
MFCs from the point of view of energy recovery, was computed by Eq. 1 [34]).
208
9 209
𝑌𝑆 = ∫ 𝑃(𝑡)𝑑𝑡
𝜏 0
𝑚(𝐶𝑂𝐷𝑖𝑛) 𝐴 (1)
210
211
To evaluate charge utilization (reflected by the ratio of (i) the charge
212
successfully recovered in form of electricity and (ii) the charge contained in the
213
organic matter consumed), Coulombic efficiency was calculated according to
214
Eq. 2 [1].
215 216
𝐶𝐸 = 𝑀 ∫ 𝐼 𝑑𝑡
∆𝐶𝑂𝐷 𝐹 𝑉 𝑏 (2)
217
218
where M is the molar mass of oxygen (g mol-1), COD is the change in
219
chemical oxygen demand (g L-1) during the process (COD was measured
220
according to standard methods), F is the Faraday’s constant (96485 C mol-1
221
electron), V is the total volume of the anolyte (L) and b is the number of
222
electrons exchanged per 1 mol of O2.
223 224
2.3.2. Statistical analysis
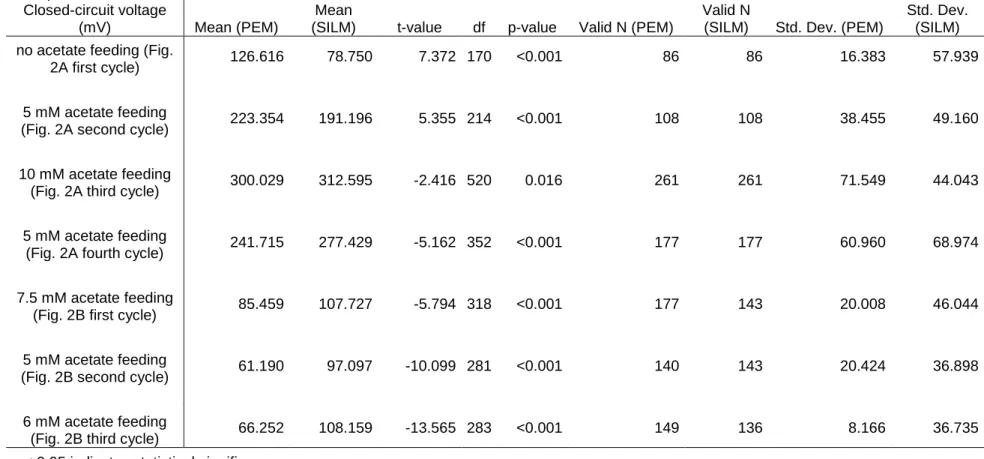
225 226
The statistical evaluation was carried out in Statistica 8 software to
227
compare MFCs operated with Nafion and SILM based on t-test (Table 1),
228
using the closed-circuit cell voltage data (as dependent variable), collected
229
over time for each stages indicated in Fig. 2.
230 231
2.3.3. Dehydrogenase enzyme activity measurements
232 233
Dehydrogenase enzyme activity was estimated based on the reduction
234
of TTC to TF [37]. In case of bulk samples, 1350 l of Luria-Bertani medium
235
was mixed with 300 l sample taken from the anolyte. Then, 150 l TTC
236
reagent (5 g L-1) was added to this mixture. In case of anodic samples, 2.2 x
237
10
0.5 x 0.2 cm pieces were cut off from the anode and put into the reaction
238
mixture. After 20 min of stirring at 200 rpm, 12 hours long incubation period at
239
37 °C was ensured [38]. Prior to extraction of formed TF by stirring the mixture
240
with 0.5 mL toluene at 200 rpm for 30 min, the reduction reaction was stopped
241
by injecting 100 l of cc. sulfuric acid. Thereafter, the mixture in the Eppendorf
242
was centrifuged (4000 rpm, 5 min) and the toluene phase (supernatant) was
243
subjected to absorbance measurement at 492 nm using UV-VIS
244
spectrophotometer.
245 246
2.3.4. Electrochemical techniques
247 248
To derive fuel cell polarization curves, the external resistor was
249
sequentially changed from 47 kΩ down to 10 Ω and the potential difference
250
between anode and cathode electrodes was monitored after 20 min (provided
251
to reach the stabilization of potential signal under each condition). From the
252
linear range of the polarization curves (V vs. I) the value of Ri was determined
253
based on the slope of the fitted trendline. In addition, the maximal Pd values
254
were estimated considering the peak of the Pd vs. Id plots.
255
CV was carried out by using a potentiostat (type: PalmSens 3,
256
PalmSens, Netherlands) in a three-electrode arrangement, where the anode
257
and cathode played the role of working and counter electrode, respectively,
258
meanwhile an Ag/AgCl electrode (placed in the anode chamber and filled with
259
3 M KCl solution) was used as reference electrode. It is noteworthy that all
260
electrode potential values reported in this paper are given with respect to
261
Ag/AgCl (3 M KCl) reference electrode. CV measurements were conducted
262
under non-turnover conditions at different stages of MFC operation (three
263
times in each condition, accepting the third scan to be representative). The
264
voltammograms were recorded by using 1 mV s-1 scan rate between +0.25 V
265
and -0.65 V anode potentials (vs. Ag/AgCl, 3 M KCl), unless otherwise stated.
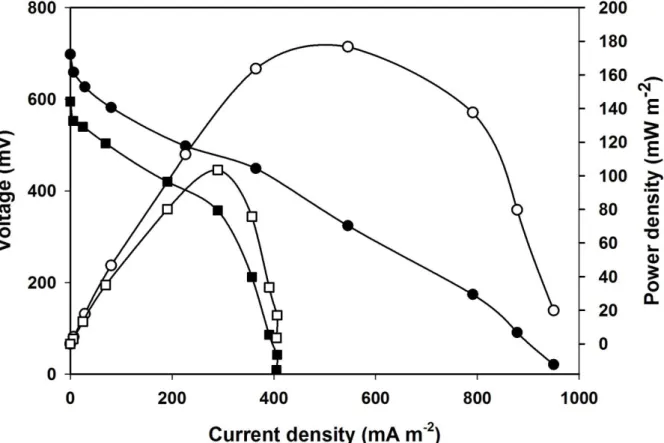
266
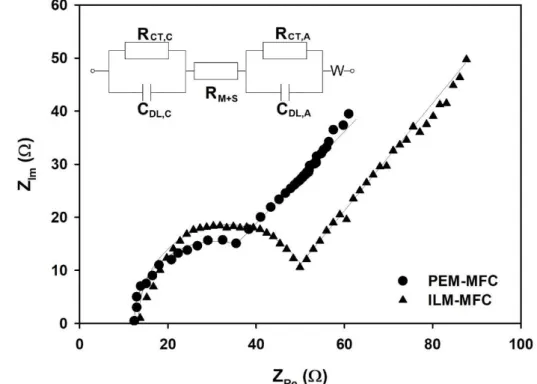
EIS measurements were carried out by using the impedance analysis
267
function of the combined potentiostat (PalmSens 3, PalmSens, Netherlands) in
268
11
a whole-cell experimental setup (two-electrode arrangement), where the
269
working electrode was the anode and the cathode served as both counter and
270
reference electrodes. AC amplitude of 10 mV and frequency range of 50 kHz –
271
1 mHz were used. The measurements were conducted in presence of acetate
272
substrate during the maximal electricity producing stage of the MFCs under
273
open circuit operating mode (established two hours before EIS analysis).
274
Equivalent circuit model fitting was carried out in EIS Spectrum Analyser
275
software (ABC Chemistry).
276 277
3. Results and Discussion
278 279
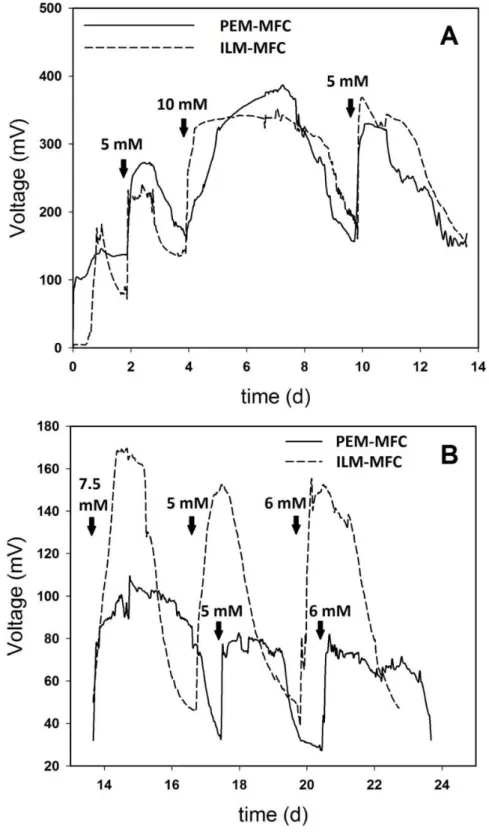
3.1. Voltage profiles and current generation in response to different
280
acetate supplementations
281 282
Once the cells were assembled, measurements and acquisition of data
283
were started. During the acclimation period, varied amounts of acetate
284
substrate were fed in subsequent batch cycles as indicated by arrows in Fig.
285
2A. After inoculation, as the start-up period commenced (no acetate feeding,
286
Fig. 2A, first cycle), all MFCs showed quite low voltage outputs but the
287
tendencies were different. On the one hand, almost prompt current generation
288
was noted in case of PEM-MFC and after reaching a peak value, Id remained
289
around 51 mA m-2. On the other hand, the ILM-MFC began to produce
290
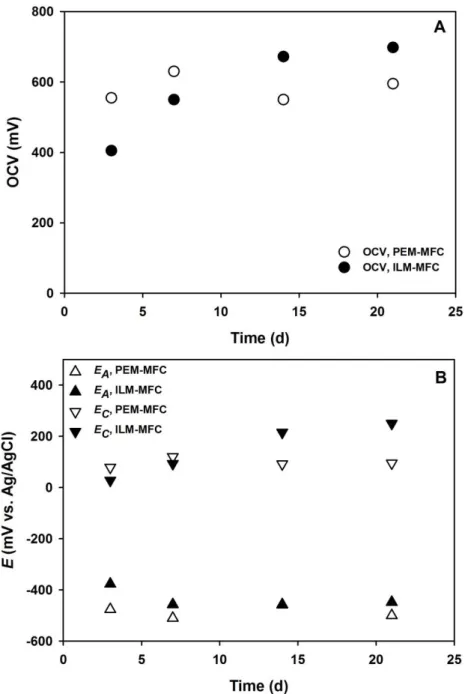
electricity less instantly (after a half-day) with a maximum Id of about 63 mA m-
291
2. Overall, in this period, in accordance with the statistical analysis in Table 1,
292
PEM-MFC generated significantly higher average voltages than ILM-MFC did
293
(Table 1).
294
12
Table 1 – Statistical analysis of voltages produced in MFCs operated with PEM and SILM
295
Dependent variable:
Closed-circuit voltage
(mV) Mean (PEM)
Mean
(SILM) t-value df p-value Valid N (PEM)
Valid N
(SILM) Std. Dev. (PEM)
Std. Dev.
(SILM) no acetate feeding (Fig.
2A first cycle) 126.616 78.750 7.372 170 <0.001 86 86 16.383 57.939
5 mM acetate feeding
(Fig. 2A second cycle) 223.354 191.196 5.355 214 <0.001 108 108 38.455 49.160
10 mM acetate feeding
(Fig. 2A third cycle) 300.029 312.595 -2.416 520 0.016 261 261 71.549 44.043
5 mM acetate feeding
(Fig. 2A fourth cycle) 241.715 277.429 -5.162 352 <0.001 177 177 60.960 68.974
7.5 mM acetate feeding
(Fig. 2B first cycle) 85.459 107.727 -5.794 318 <0.001 177 143 20.008 46.044
5 mM acetate feeding
(Fig. 2B second cycle) 61.190 97.097 -10.099 281 <0.001 140 143 20.424 36.898
6 mM acetate feeding
(Fig. 2B third cycle) 66.252 108.159 -13.565 283 <0.001 149 136 8.166 36.735
p < 0.05 indicates statistical significance
positive t-value means that PEM performs better than SILM, while negative t-value presents the opposite case
13
After 2 days, the first dose of acetate was injected (Fig. 2A, second
296
cycle) to ensure 5 mM concentration in the anode compartment. As a result,
297
quick response could be observed after this organic matter loading in both
298
systems. Still, the PEM-MFC reflected statistically higher voltages (Table 1),
299
reaching 102 mA m-2 as highest current density. In the meantime, peak Id of 88
300
mA m-2 was registered for the ILM-MFC. As it can be also seen in Fig. 2A
301
(third cycle), the 10 mM acetate induced proportionally higher voltage and
302
current density (compared to previous stage with 5 mM), peaking at 385 mV
303
and corresponding 148 mA m-2 for PEM-MFC, whilst at 342 mV and 131 mA
304
m-2 for ILM-MFC. It is noteworthy that in this period and onwards (Table 1), the
305
ILM-MFC outperformed the PEM-MFC.
306
Moreover, it is important to notice the significantly different outcomes of
307
the first and second 5 mM acetate additions (Fig. 2A, second and fourth
308
cycles), which imply the proper and gradual development of the
309
electrochemically-active populations. Actually, the extent of current density
310
increase was clearly distinguishable for the reactors employing the two
311
different separators. For instance, in case of MFCs equipped with PEM, the
312
increment was nearly 30 % (133 mA m-2 vs. 102 mA m-2), while for ILM-MFC,
313
the 152 mA m-2 realized in the fourth cycle (Fig. 2A) represented a more than
314
72 % enhancement relative to the second cycle. Consequently, in this term,
315
the bioelectrochemical system installed with SILM was capable to remarkably
316
outperform its counterpart with Nafion.
317
As mentioned in Section 2.2., at the point of the 4th substrate injection
318
(Fig. 2B, first cycle), the external resistor was changed from 1 kΩ to 100 Ω in
319
both ILM-MFC and PEM-MFC, because of the feedback received from cell
320
polarization measurements (elaborated later on in Section 3.5.) indicating the
321
change of total internal resistances over time. As a result, differences in the
322
efficiency of the two systems became even more remarkable. In particular, as
323
it can be seen in Fig. 2B, the highest voltages and thus, maximum current
324
densities were considerably better for ILM-MFC, i.e. 739, 656 and 695 mA m-2
325
14
compared to 461, 348 and 373 mA m-2 generated by PEM-MFC at 7.5, 5 and 6
326
mM acetate concentrations, respectively.
327
328
Fig. 2 – Voltage profiles of MFCs equipped with different membranes.
329
Measurements at various acetate concentrations (A) Ri = 1 kΩ and (B) Ri =
330
100 Ω.
331
15
The total (cumulative) energy recovery (normalized to the anode surface area)
332
is illustrated in Fig. 3. It can be seen that though PEM-MFC was more
333
effective in generating electrical energy for the two initial feeding cycles
334
(reflected also by the significantly higher, mean voltage values presented in
335
Table 2), the ILM-MFC could take over with time (from the 3rd substrate
336
addition and onwards) and perform in a considerably better way.
337
338
Fig. 3 – Cumulative energy production of MFCs equipped with different
339
membranes under conditions displayed in Fig. 2.
340
341
At this point, besides the evaluation presented so far, we feel important
342
to comment on process stability, which can be challenging when a supported
343
ionic liquid membrane is used. In SILMs, the IL stays in the pores of
344
supporting material thanks mainly to capillary forces, which is influenced by
345
factors e.g. the viscosity of IL [39]. In addition, the compatibility of IL and the
346
support membrane can affect consistent SILM performance as well as the
347
formation of water microenvironments inside the IL phase [39].
348
16
In this aspect, as discussed by Fortunato et al. [40], the loss of
349
immobilized liquid from the pores (in case of supported liquid membranes) can
350
potentially be mitigated by the appropriate selection of the phase properties in
351
contact, in particular the membrane and the solution around it. During SILM
352
fabrication, for a given support matrix in which the IL is filled, the membrane
353
traits can eventually be adjusted by the choice of IL, where the molecular
354
structures of anion and cation (building up the IL) will play a significant role. If
355
the purpose is the use of SILM in an aqueous media such as in MFCs (where
356
anolyte as well as catholyte are water-based solutions) hydrophobic, room-
357
temperature ILs may be more appropriate in order to reduce miscibility and
358
consequently, the threat of possible leaching of IL from the membrane pores.
359
In general, hydrophobicity of ILs with an imidazolium-type cation ([Cnmim]+)
360
increases with the length of alkyl side-chain and moreover, the anion ([X]-)
361
properties i.e. [NTf2]- vs. [PF6]- will also take an effect [41].
362
As a matter of fact, Fortunato et al. [42] investigated the durability of
363
SILMs prepared with ILs of the imidazolium family i.e. [bmim][PF6] and PVDF
364
support membrane, similar to this study. In essence, it was reported that such
365
SILMs could preserve their hydrophobic characteristic after contacted with
366
water and furthermore, no considerable displacement of IL from the pores
367
could be noted as long as mild stirring conditions were maintained.
368
Additionally, in the continuation of that work [40], it was demonstrated that
369
even if the concentration of imidazolium-type IL in the aqueous phase
370
surrounding the SILM rose under dynamic (e.g. intensely stirred)
371
circumstances, it was primarily originated from the rinsing of excess IL located
372
on the membrane surface rather than from displacing the IL from the
373
membrane pores.
374
On the grounds of these arguments and taking into account that no
375
stirring was directly provided in the MFCs of this investigation – representing
376
more or less static conditions on two, anode- and cathode-facing sides of the
377
SILM (though continuous air supply in the cathode chamber may have had
378
some inherent contribution here) – it may be supposed that SILMs
379
17
manufactured by embedding [bmim][PF6] in microfiltration PVDF membrane
380
could be considered stable enough. As a result, this SILM may be seen as a
381
plausible candidate withstanding longer-term MFC operation, which is implied
382
also by the outcomes of 3-4 weeks of experimentation lacking any membrane-
383
associated failures (Fig. 2). Nevertheless, to strengthen these assumptions
384
and conclusions, a future study can be proposed.
385
A further investigation on SILM stability and application can be also
386
useful to take a look into process safety. On the one hand, from previous
387
studies such as Nemestóthy et al. [43], it seems that ILs might act as inhibitors
388
in anaerobic fermentation systems, depending on the IL type and
389
concentration. Therefore, if leakage of ILs from the SILM occurs over time, it
390
may cause challenges to keep the electro-active bacteria in good conditions
391
and maintain sufficient process performance. However, this aspect should be
392
examined case-specifically for the actual underlying microbial community,
393
which, thanks to the wide range of inocula used by researchers, can be quite
394
different from one MFC to another. On the other hand, nevertheless, Jebur et
395
al. [44] have found that membranes prepared with ionic liquid can have anti-
396
microbial impact and in that way, suppress the undesired biofouling of the
397
separator. Such a property could deserve attention since fouling of
398
membranes in bioelectrochemical systems can lead to severe operational
399
issues.
400 401
3.2. Evaluation of bioelectrochemical cell performance applying ionic
402
liquid-containing and Nafion membrane separators
403 404
The efficiency parameters (for instance substrate removal, Coulombic
405
efficiency, energy yield, etc.) of microbial electrochemical systems are usually
406
dependent on the operating conditions [1, 13], among which substrate
407
concentration is one of the most important [45]. For instance, it has been
408
previously found that ILM-MFCs were able to reach higher energy yields at low
409
acetate concentrations than those relying on Nafion [33]. Hence, besides the
410
18
acetate loadings tested and discussed in Section 3.1., complementary
411
measurements along with additional substrate concentrations were carried out
412
and the dependency of YS on this process variable was assessed in MFCs
413
employing SILM or Nafion membrane. Overall, the 6 initial acetate
414
concentrations set in the anode chamber were as follows: 2, 5, 6, 7.5, 10 and
415
12 mM.
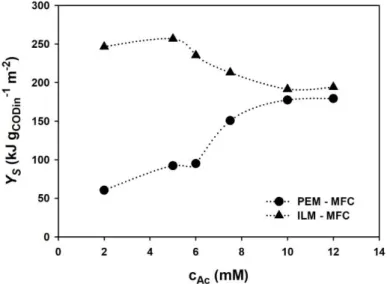
416
The results are illustrated in Fig. 4, where it is to observe that the energy
417
yield values were significantly enhanced between 2 – 7.5 mM substrate
418
concentrations (approximately 4x, 3x, 2.6x and 1.4x higher for 2, 5, 6 and 7.5
419
mM acetate, respectively) in case of ILM-MFC compared to PEM-MFC. At
420
higher acetate concentrations (10 and 7.5 mM), the differences between the
421
two cells became much smaller, but YS was still somewhat higher for the ILM-
422
MFC. This may suggest that under such substrate loadings, the metabolic
423
(substrate-utilizing) capacity of exoelectrogenic microorganisms in both MFCs
424
reached an upper-bound. Besides, the potential presence of methanogenic
425
archaea (occurring in the mesophilic, anaerobic sludge applied for inoculation)
426
should be also taken into account. This could affect the total energy recovery
427
via microbiological competition for the organic matter. This phenomenon can
428
be a possible threat at increased substrate availability [46].
429
430
Fig. 4 – YS as a function of acetate concentration. cAc represents initial acetate
431
concentrations in the anode chamber.
432
19
The largest YS was realized in the ILM-MFC (YS = 256.8 kJ gCOD,in-1 m-2
433
at 5 mM acetate concentration), while 180 kJ gCOD,in-1 m-2 could be achieved in
434
the MFC using the Nafion proton exchange membrane (at 12 mM acetate
435
concentration).
436
To evaluate the utilization of electrons (released from organic matter
437
degradation) in MFCs, the Coulombic efficiency was determined at 6 mM
438
acetate addition (last cycle in Fig. 2B). In fact, CE of 13.9 ± 0.4 % and 24.0 ±
439
0.7 % could be attained for the PEM-MFC and ILM-MFC, respectively.
440
Therefore, from this point of view, the application of SILM resulted in a more
441
attractive bioelectrochemical process. As for the alteration of CE in the
442
function of substrate concentration, a decreasing tendency was presented by
443
Sleutels et al. [47] within an acetate influent concentration range of 1 – 35 mM.
444
This is in good agreement with the findings of our previous [33] and present
445
studies, suggesting the use of low acetate concentrations in order to support
446
higher specific energy recoveries (Fig. 4).
447
In summary, the experiments revealed the positive impact of SILM on
448
both energy yield (especially at low substrate concentrations) and Coulombic
449
efficiency. In addition, it turned out that the hydrophobic [bmim][PF6]-based
450
SILM can be used properly for separating the electrode chambers in two-
451
compartment MFCs to produce electricity with an effectiveness more or less
452
comparable to Nafion when higher substrate loadings are applied.
453
Nevertheless, to dissect the possible contribution of membranes in the MFC’
454
behaviors and facilitate the understanding of the process, further tests e.g. (i)
455
cell polarization, (ii) monitoring of dehydrogenase enzyme activity as well as
456
(iii) cyclic voltammetry were performed and are discussed in the next sections.
457 458
3.3. Analysis of MFC behavior via polarization measurements
459 460
The cell polarization measurements assist the calculation of Ri for MFCs
461
and hence, help the selection of appropriate Re by which Pd is enhanced.
462
Under the condition then Ri = Re, the CDP of MFC is reached [48].
463
20
On the third day after inoculation, Ri values were found to be 581 ± 11 Ω
464
and 789 ± 9 Ω for ILM-MFC and PEM-MFC, respectively. Besides, estimated
465
power densities at CDP were 39.8 ± 2.7 mW m-2 and 78.0 ± 3.1 mW m-2,
466
respectively. After two weeks, Ri values decreased considerably in both
467
systems to 276 ± 16 Ω and 303 ± 11 Ω, respectively. The approximate
468
maximum power densities at CDP were as high as 190.1 ± 9 mW m-2 and 98.6
469
± 11.6 mW m-2 in case of ILM-MFC and PEM-MFC. The observed tendency
470
during the first 14 days for Ri supports the conclusions of Section 3.1. pertain
471
to the development of the MFCs reflected by current density outputs.
472
Polarization measurements were continued and after three weeks, almost no
473
additional change of Ri (268 ± 11 Ω and 302 ± 17 Ω for ILM-MFC and PEM-
474
MFC, respectively) could be noted. Consequently, stabilization of maximal
475
power densities was attained and the microbial fuel cells were considered as
476
adapted systems (Fig. 5).
477
Basically, the characteristics of polarization (Fig. 5) curves are similar to
478
those found in the relevant literature [23, 34, 49], showing a declining pattern
479
in current density along with increased Re. Furthermore, the absence of power
480
overshoot is good indication of appropriate bioelectrochemical system
481
operation [17]. Moreover, it is to infer that the MFCs employing the SILM not
482
only achieved lower Ri but at the same time, ensured > 70 % higher maximal
483
power density (500 ± 21 mA m-2 of Id vs. 290 ± 19 mA m-2 for PEM-MFC) at
484
CDP. The maximal 950 ± 84 mA m-2 of Id (vs. 405 ± 30 mA m-2 for PEM-MFC)
485
was accomplished with the lowest resistance (10 Ω), presumably because of
486
effective electron discharge [49].
487
In this polarization study, voltage drop was more significant for PEM-
488
MFC within the concentration polarization range (at high current density). It is
489
a probable signal of more pronounced increase in the ratio of oxidized and
490
reduced charge-shuttling molecules (being at different redox state) in the
491
vicinity of electrode surface [1]. This assumed phenomena can be ascribed to
492
the limited discharge of reduced or supply of oxidized compounds, leading to
493
higher anode potentials or on the contrary, lower potentials at the cathode [1].
494
21 495
Fig. 5 – Polarization curves for (●) ILM-MFC and (■) PEM-MFC and power
496
density plots for (○) ILM-MFC and (□) PEM-MFC (taken on the 21st day, 6 mM
497
acetate)
498
499
It is important to mention that the attractiveness of membranes for MFCs
500
should be assessed under the similar settings/combination of environmental
501
factors [17] such as in terms of seed source, substrate quality, electrode
502
materials, anode/cathode potential(s) and spacing, anolyte/catholyte solution
503
traits i.e. conductivity, physiological conditions i.e. temperature, pH, etc.
504
otherwise, it is difficult to say which system and in particular, which membrane
505
is more suitable than another [50]. Nonetheless, in general, MFCs are capable
506
of producing power densities both above and below the values reported in the
507
present work (Table 2). Similar conclusions can be made on the grounds of
508
the analysis carried out by Ge et al. [51], where it was clearly reported that
509
22
MFC power densities can span a wide range (through order of magnitudes),
510
fitting our results obtained both with the IL-containing and Nafion membranes.
511 512
Table 2 – Comparative table with literature data. The power density data
513
marked with (*) are given as granular anode volume specific values
514
515
MFC type Membrane
Power density (mW m-2 /
mW m-3*)
Internal resistance
(Ω)
Substrate Reference
Dual- chamber
MFC
Nafion (3.5, 6.2 and 30.6
cm2)
44 - 173 1110 –
89.2 Acetate [23]
Dual- chamber
MFC
Nafion (~20
cm2 ) 51 – 67.5 300 - 500 Synthetic
wastewater [53]
Single- chamber
MFC
[omim][PF6]-
PVC 45* 4500 –
5900
[54]
[mtoa][Cl]-
PVC 450* 440 - 750 Brewery
wastewater
Nafion 100* 2000
Dual- chamber
MFC
[hmim][PF6] 3.7 2900
Acetate [34]
[bmim][NTf2] 3.9 2500
Nafion 12.2 1350
Dual- chamber
MFC
[bmim][PF6] 179 268
Acetate This study
Nafion 101 302
516
23
3.4. Alteration of electrode potentials in MFCs equipped with SILM or
517
Nafion membrane
518 519
By monitoring both the individual anode and cathode potentials (and the
520
difference between those values), information about the potential losses
521
occurring in the system can be extracted and beside, the assignment of these
522
losses to given processes (e. g. electrode reaction or diffusive transport, etc.)
523
may be possible.
524
Considering the OCV of MFCs during acetate utilization (Fig. 6A), a
525
strictly monotonic increase could be observed as a function of elapsed time in
526
case of ILM-MFC, from 405 mV (on 3rd day) up to 698 mV (on 21st day). For
527
PEM-MFC, however, such a trend could not be detected and rather, a nearly
528
steady OCV (around 583 mV) was obtained. The determination of
529
accompanying anode and cathode potentials revealed quite comparable
530
values in the two systems: Ea = –452 ± 5 mV and Ea = –485 ± 25 mV in case
531
of ILM-MFC and PEM-MFC, respectively. Nevertheless, the alteration of Ec
532
with time in the two MFCs (assembled with various membrane separators)
533
was more distinguishable. In ILM-MFC, change of Ec followed a similar pattern
534
than respective OCV (Fig. 6B), resulting in an increment from +28 mV (3rd
535
day) to +250 mV (on 21st day). As for PEM-MFC, Ec was found to be relatively
536
higher at the early stage of operation (Ec = +79 mV, 3rd day) and rose to +120
537
mV on the 7th day. From that point onwards (14th and 21st days in Fig. 6B), a
538
stabilized value (+93 ± 2 mV) could be measured.
539
24 540
Fig. 6 – OCV (A) and electrode potentials (B) of the MFCs measured at
541
maximal current density stages.
542 543
These phenomena imply the importance of the membrane separator
544
type, which seemed to be a responsible factor for the registered changes of
545
electrode potentials, in particular Ec. As a matter of fact, the transport of
546
certain cations (e.g. Na+ and K+) may affect the migration of protons from the
547
anode to the cathode, causing potentially a pH split due to H+ accumulation in
548
the anode chamber [19]. Hence, the passage of those ions through the
549
25
membrane presents an issue to deal with and can be associated with
550
structural properties of the membrane material [19] since, for instance, the
551
sulfonate groups of Nafion can get occupied by the above mentioned cationic
552
species [21, 55, 56]. Additionally, problems related with the time-stability i.e.
553
due to (bio)fouling of Nafion may arise [57]. In contrast, the SILM (based on
554
[bmim][PF6] ionic liquid and PVDF as supporting membrane layer, which would
555
appear as a feasible separator candidate to improve (i) energy yields, (ii)
556
current and power densities and (iii) lower cathodic losses – has several
557
underexplored characteristics at the moment, including mechanism of H+
558
transport and selectivity to transfer various compounds in the anolyte and
559
catholyte (cross-over effect). In the light of that, the mechanism of ion transfer
560
through ILs having special physico-chemical properties is one crucial aspect to
561
be elaborated and compared to polymer membranes such as Nafion.
562
Nonetheless, as it has been recently communicated in our previous paper [34],
563
the SILMs can have lower O2 mass transfer coefficients and one order of
564
magnitude lower transport rate for acetate ion (referred as substrate cross-
565
over), which can be another relevant information to take into account from a
566
process evaluation point of view.
567 568
3.5. Assessment of SILM- and Nafion-dependent MFC behaviors by
569
dehydrogenase activity monitoring
570 571
To further elucidate the observed differences in the behavior of MFCs
572
assembled with various membrane separators, feedback from a biological
573
activity viewpoint can be useful (i.e. the production of charge carriers is
574
primarily attached to strain metabolism) [58]. Measurements on
575
dehydrogenase enzyme are able to characterize the metabolism-related
576
microbial redox activity, since this intracellular biocatalyst plays an important
577
role on H+ (and coupled e-) transfer between metabolites and indirectly (by
578
ensuring accessible charges and using redox mediators) on the maintenance
579
of electron driving force [38].
580
26
In our system, samples taken from the bulk phase as well as from the
581
anode (biofilm) were analyzed according to Section 2.3.3. In the former case,
582
for both ILM-MFC and PEM-MFC, a progressively decreasing tendency was
583
shown as the systems approached stable operation (Table 3).
584 585
Table 3 – Results of dehydrogenase activity measurements of bulk
586
samples taken at different stages of system development
587
588
DA (g mL-1 of toluene)
PEM-MFC ILM-MFC
Day 3 20.77 15.8
Day 7 4.07 8.15
Day 21 2.82 3.27
589
This could be an indicator of lowered metabolic redox activity in the
590
liquid surrounding the anode electrode [38]. This seems to be reasonable
591
since in an MFC system, the proper development of an electro-active biofilm
592
on the anode surface should be accompanied by the suppression of planktonic
593
cells [59]. These results coincide well with the literature, where, for instance,
594
DA over time was investigated by Reddy et al. [38] in single chamber MFCs at
595
different organic loading rates. In brief, initial increase from 9 up to 18 g mL-1
596
toluene (until ~ 12th hour) and a consecutive decrease down to 2 – 4 g mL-1
597
toluene were demonstrated for samples withdrawn from the anolyte
598
(containing the suspended/planktonic cells).
599
In contrast, higher DA could be presumed in case of anodic samples
600
because of the enrichment of active, anodophylic strains and indeed,
601
supporting experimental results were obtained (Table 3). On the 3rd day, the
602
anodic DA values were somewhat similar, i.e. 1.23 g mL-1 toluene and 1.15
603
g mL-1 toluene for the PEM-MFC and ILM-MFC, respectively. Later on (in
604
27
parallel with the evolution of current described in Section 3.1.), the DA data (in
605
both MFC systems) reflected rising tendencies with time. In case of ILM-MFC,
606
values determined on the 7th and 21st days were 5.77 g mL-1 toluene and
607
8.04 g mL-1 toluene. For PEM-MFC, respective DAs were found as 3.33 g
608
mL-1 toluene and 6.11 g mL-1 toluene (Table 4).
609 610
Table 4 – Results of dehydrogenase activity measurements of anode
611
samples taken at different stages of system development
612
613
DA (g mL-1 of toluene)
PEM-MFC ILM-MFC
Day 3 1.23 1.15
Day 7 3.33 5.77
Day 14 3.84 7.02
Day 21 6.11 8.04
614
To evaluate the likely positive effect of SILM on anode-related DA
615
compared to PEM-MFC (indicated by the differences in DA), various mass
616
transport phenomena (that may affect the microbial redox metabolism) taking
617
place across the membrane should be considered. In agreement with the
618
statements made above, SILMs can have lower oxygen transfer rate relative to
619
Nafion, as communicated in our recent work using [bmim][NTf2] ionic liquid
620
[34]. This property could be helpful to more successfully protect the anode
621
chamber from oxygen gas penetration and therefore, maintain anoxic
622
conditions. In MFCs, it is a requirement to keep the anaerobic
623
(electrochemically-active) microbes in good conditions and prevent metabolic
624
shifts, which may occur once terminal electron acceptors (such as oxygen)
625
other than the anode material itself are available for cell respiration. In
626
addition, SILMs (compared to Nafion) can have the potential to act as effective
627
barriers and reduce substrate-related losses linked to cross-over effect [34].
628
Faster transport of substrate towards the cathode chamber may result in
629
28
relatively lowered anode-side substrate concentration, which may limit the
630
redox activity of microorganisms. Mainly, this issue can occur at initially low
631
substrate concentrations, which was the case of the present study.
632 633
3.6. Cyclic voltammetric analysis of MFCs operated with SILM and Nafion
634
membranes
635 636
In general, as discussed in Section 3.5., DA gives insight to the
637
metabolic redox activity of particular microbial communities i.e. those located
638
and growing on the anode [38]. Nonetheless, in order to characterize the
639
electrochemically-active population itself, cyclic voltammetry (CV) can be
640
proposed [60, 61]. The cyclic voltammograms in Figs. 7A and B revealed
641
several oxidation-reduction peaks in both ILM- and PEM-MFCs and
642
furthermore, suggest the dynamic variation of electrocatalytic activity on
643
anodes, irrespective of the membrane used. Actually, the increase of detected
644
peak currents over time indicate (i) the enrichment of redox mediators and/or
645
(ii) larger coverage of anode by proteins involved in the electron transfer
646
process [62]. Notwithstanding, a comprehensive approach is required when it
647
is aimed to fairly compare various bioelectrochemically active systems based
648
on the quantification of the above-mentioned mediators and/or proteins taking
649
part in the electron transfer due to the commonly occurring lack of information
650
about the actual bacterial concentrations [61, 63]. This appears to be the case
651
in our MFCs as certain conditions were not identical for example in terms of
652
anolyte properties such as ion and cell concentrations, which can be
653
associated with the employment of membranes and their mass transport
654
features.
655