1
Investigating the specific role of external load on the performance versus 1
stability trade-off in microbial fuel cells 2
3
László Koók, Nándor Nemestóthy, Katalin Bélafi-Bakó*, Péter Bakonyi 4
5
Research Institute on Bioengineering, Membrane Technology and Energetics, 6
University of Pannonia, Egyetem u. 10, 8200 Veszprém, Hungary 7
8 9
10
*Corresponding Author: Prof. Katalin Bélafi-Bakó 11
Tel: +36 88 624726 12
E-mail: bako@almos.uni-pannon.hu 13
14
2 Abstract
15 16
The performance and behavior of microbial fuel cells (MFCs) are influenced by 17
among others the external load (Rext). In this study, the anode-surface biofilm 18
formation in MFCs operated under different Rext selection/tracking-strategies was 19
assessed. MFCs were characterized by electrochemical (voltage/current generation, 20
polarization tests, EIS), molecular biological (microbial consortium analysis) and 21
bioinformatics (principal component analysis) tools. The results indicated that the 22
MFC with dynamic Rext adjustment (as a function of the actual MFC internal 23
resistance) achieved notably higher performance but relatively lower operational 24
stability, mainly due to the acidification of the biofilm. The opposite (lower 25
performance, increased stability) could be observed with the static (low or high) Rext
26
application (or OCV) strategies, where adaptive microbial processes were assumed.
27
These possible adaptation phenomena were outlined by a theoretical framework and 28
the significant impact of Rext on the anode colonization process and energy recovery 29
with MFCs was concluded.
30 31
Keywords: microbial fuel cell; external load; current generation; biofilm formation;
32
microbial community analysis; process stability 33
3 1. Introduction
34 35
The study of bioelectrochemical systems, such as microbial fuel cells (MFCs), 36
requires a complex, multidisciplinary approach. The reason behind this is that the 37
processes taking place in the MFCs are simultaneously related to material science, 38
electrochemistry and microbiology (Bakonyi et al., 2018b; Patil et al., 2015). In fact, 39
MFCs are electrochemical devices that, just like galvanic cells, can convert chemical 40
energy directly into electric current (Logan et al., 2006; Pandey et al., 2016).
41
Nevertheless, for the accomplishment of this task, MFCs applications rely on living 42
microorganisms, in particular electrochemically active biocatalysts (EAB) (Kumar et 43
al., 2015; Logan et al., 2019). In the MFCs, EABs begin to grow in colonies and form 44
a biofilm on the surface of the anode electrode (provided that it is compatible with the 45
microbes and their functioning) kept under anaerobic conditions (Logan et al., 2006).
46
Furthermore, the substrate oxidation and electron transfer processes from the 47
microbes to the anode (and further through the external circuit to the cathode) take 48
also place here. The properties of this biofilm e.g. in terms of its electrochemical 49
activity and quality (diversity) of EABs strongly determine the efficacy of the MFC 50
(Bakonyi et al., 2018a; Koók et al., 2019b, 2018).
51
The efficiency of fuel cells such as MFCs, can be characterized by whole-cell 52
polarization measurements, where the cell voltage is plotted against the generated 53
current (density) at a given external resistance (Rext) in order to obtain the maximum 54
power (density) and the total internal resistance (Rint) of the fuel cell (Logan et al., 55
2006). However, the value of Rint - especially during the start-up phase of the MFC - 56
may show notable temporal variability e.g. due to the development / maturation 57
processes of the anode surface biofilm. In MFCs, the Rint is affected by three terms, 58
such as activation/charge transfer, Ohmic (electrolyte) and concentration (diffusion, 59
mass transfer) losses (Zhang and Liu, 2010). The operation of the MFCs should be 60
maintained to generate maximum power density, which is theoretically expected at 61
the point where Rext = Rint (Cell Design Point, CDP) (Raghavulu et al., 2009). Thus, a 62
real-time optimization is suggested so that MFCs are kept at or close to CDP based 63
on Rint-tracking strategy (Pinto et al., 2011). In order to real-time control Rext, periodic 64
disconnection of Rext is needed, followed by the determination of the open circuit 65
potential (OCV) of the MFC and voltage generation profile at various Rext values 66
(Pinto et al., 2011). Afterwards, the data are processed to display the current, power 67
4
as well as their relationship. Finally, a given maximum power-point tracking (MPPT) – 68
usually perturbation observation (P/O) – algorithm can be used for choosing the 69
optimal Rext based on the change in the power (observation) to a set of Rext
70
(perturbation) (Pinto et al., 2011; Woodward et al., 2010). Interestingly, some studies 71
demonstrated efficient MFC operation after an adaption to high currents applying low 72
Rext (Hong et al., 2011) or employing higher Rext (Suzuki et al., 2018). On the whole, 73
the importance and marked influence of Rext on the anodic bioprocess using MFC 74
seem to be confirmed (Katuri et al., 2011; Lyon et al., 2010; Pasternak et al., 2018;
75
Rismani-Yazdi et al., 2011; Zhang et al., 2011). To have a deeper understanding of 76
the process stability of MFCs operated under different external load conditions, it is 77
clear that investigations in MFCs regarding the effect of time-dependent variation of 78
Rint/Rext and responses induced in the community of EAB on the anode surface, as 79
well as their relationship to the MFC performance and stability are needed.
80
In the present study, therefore, the performance and stability of MFCs, as well 81
as the changes of electrochemically-active, anode-surface biofilms were addressed 82
under dynamic (adjusted to actual Rint) and static (fixed for the entire operation 83
regardless of Rint) Rext operating strategies employing electrochemical and molecular 84
biological methods. In the former case, full cell polarization, cyclic voltammetry (CV) 85
and electrochemical impedance spectroscopy (EIS) were undertaken, while useful, 86
supporting information was extracted by microbial consortium analysis based on 87
DNA-sequencing and metagenomics. By combining all of these data, the more 88
detailed understanding of relationships between biotic and abiotic features of MFCs 89
was put forward as the main objective. To enrich the literature in this specific field of 90
bioelectrochemical systems, the comprehensive evaluation of experimental results 91
was complemented by elaborating potential mechanisms for the various application 92
scenarios of Rext. 93
5 2. Materials and Methods
94
95
2.1. MFC setup and operation 96
97
The two-chambered MFCs were designed and operated as detailed previously 98
(Koók et al., 2019a, 2019b). In brief, the MFCs were equipped with carbon felt 99
anodes (Zoltek PX35, Zoltek Corp., USA) with apparent surface area of 30 cm2, while 100
the cathode electrode was made of Pt/carbon paper (0.3 mg Pt cm-2, FuelCellsEtc, 101
USA) (8 cm2 apparent surface area). Ti wiring was used in the external electric circuit 102
(Sigma-Aldrich, USA) between the electrodes. In order to investigate the effect of the 103
external resistance (Rext) applied, MFC external circuits were completed with either 104
no resistor (open circuit mode, OCV-MFC), Rext = 10 Ω (low resistance, Low-MFC), 105
10 kΩ (High resistance, High-MFC), or an external resistor dynamically changed 106
according to the internal resistance (Rint) (Dyn-MFC).
107
The cathode chambers were filled with (160 mL) 50 mM, pH = 7.2 phosphate 108
buffer solution (PBS). The anode chamber (160 mL) contained a mixture of activated 109
anaerobic sludge collected from a municipal wastewater treatment plant (10 V/V %) 110
and phosphate buffer, respectively. The initial pH of the anolyte was adjusted to 7.2, 111
and acetate as a sole substrate was injected in batch mode during the experiments in 112
5 mM concentration. The anode and cathode compartments were separated using a 113
Nafion 115 proton exchange membrane, which was pretreated as previously 114
described (Ghasemi et al., 2013). The reactors were kept at a constant temperature 115
of 37 °C.
116 117
2.2. Performance evaluation of MFCs 118
119
MFC voltage (V) was monitored and recorded by using a data logger, and the 120
performance of the systems was evaluated by using the output indicators including 121
the electric current (I) and power (P) (calculated according to Ohm’s law regarding 122
the voltage and the external resistance value, Rext), as well as their anode-surface 123
(Aa) standardized values, such as the current- and power densities (j and Pd, Eqs. 1 124
and 2) respectively.
125 126
6
(1)
127
128
(2)
129
130
Besides that, the energy recovery efficiency (E) and electron recovery 131
efficiency (CE*) were considered for the assessment of MFC behaviors according to 132
Eqs. 3 and 4, respectively (Logan et al., 2006).
133 134
∫
% (3)
135 136
∫
(4)
137
138
As can be noted, E reflects the efficiency of gaining energy (kJ) from a certain 139
quantity (nAc) of acetate loaded to the MFCs, considering its heat of combustion 140
(HAc). CE* delivers the efficiency of cumulative electron utilization as charge 141
compared to the charge theoretically obtainable from the organic matter (acetate) 142
COD content (CODAC). M, F, b and VA stand for the molecular weight of oxygen 143
gas, the Faraday’s constant, the number of electrons per oxygen molecule and the 144
volume of the anolyte, respectively.
145 146
2.3. Polarization tests 147
148
The MFC polarization tests were carried out by varying the external resistor in 149
the electric circuit in the range of 10 kΩ - 10 Ω (20 min at each external resistor).
150
Before recording the polarization curves, the external resistor (if any) was 151
disconnected from the circuit for at least two hours to ensure OCV operation in 152
advance to the tests. All measurements were done in the maximal current generation 153
state (peak current) of the MFCs. The internal resistance of the MFCs at various 154
operation stage was then determined from the slope of the Ohmic (linear) range of 155
the registered voltage – current curves.
156 157
7 2.4. Cyclic voltammetry (CV)
158 159
In order to characterize the bioelectrochemical activity of MFC anode biofilms, 160
cyclic Voltammetry (CV) measurements were carried out. CVs were recorded under 161
non-turnover (substrate depleted) conditions using a PalmSens 3 potentiostat 162
(PalmSens, Netherlands) and the data processing was done with PsTrace 5 software 163
(PalmSens, Netherlands). The measurements were conducted in three-electrode 164
configuration where an Ag/AgCl (3 M KCl) was employed as the reference electrode 165
and the anode and cathode played the role of working and counter electrodes, 166
respectively. The scan rate was set at 1 mV s-1 and an anode potential window of 167
(+)0.25 V to (-)0.65 V was scanned.
168 169
2.5. Electrochemical Impedance Spectroscopy (EIS) 170
171
The decomposition of the total Rint to its components was carried out by using 172
electrochemical impedance spectroscopy (EIS) and a PalmSens 3 potentiostat 173
equipped with EIS feature (PalmSens, Netherlands). The measurement was done in 174
two-electrode layout (whole-cell experimental setup) with the cathode as working and 175
the anode as counter/reference electrodes, respectively. To conduct EIS, the 176
frequency range of 50 kHz – 1 mHz was scanned with an AC amplitude of 10 mV.
177
The data were collected under peak current density conditions of MFCs. In advance 178
to the measurements, the external resistor was disconnected from the electric circuit 179
of the reactors for at least two hours. The EIS Spectrum Analyser program (ABC 180
Chemistry) was exploited to fit the equivalent circuit model. Based on the whole-cell 181
EIS spectra, the decomposition of internal resistance of the MFCs was carried out 182
resulting in charge transfer (Rct), ohmic membrane + solution (ROhm) and diffusion 183
(RD) resistance components (Nam et al., 2010; Rezaei et al., 2007).
184 185
2.6. Microbial community assessment and principal component analysis 186
187
The microbial community analysis and related metagenomics assessment of 188
the anodic biofilm samples taken from the MFCs operated under different external 189
load strategies were conducted by following the procedure detailed in our recent 190
8
article (Koók et al., 2019b).Before analysis, the data were resampled using 78,917 191
reads per sample (the lowest number of reads obtained). The principal component 192
analysis (PCA) was performed on relative abundances of main bacterial orders 193
identified in the anodic biofilms of different MFCs, using IBM SPSS Statistics 24 194
software. Bacterial orders with a relative abundance > 1% in at least one sample 195
were considered for the analysis. Based on bacterial genera, Shannon (H’) and 196
Simpson () phylogenetic diversity indices were calculated according to Eqs. 5 and 6, 197
respectively.
198 199
∑ (5)
200 201
∑ (6)
202 203
where R denotes the richness (total number of genera) in the sample and pi is the 204
relative abundance of the genus i.
205 206
3. Results and Discussion 207
208
3.1. Descriptive assessment of MFCs 209
210
3.1.1. Electricity generation 211
212
In the field of MFCs, the term ‘steady-state’ should be addressed carefully, as 213
electrochemical and biological steady-states may occur at distinct spots on the time- 214
scale (Menicucci et al., 2006). The steady state, as defined within the frame of 215
systems theory, cannot be fully achieved in such bioelectrochemical system at 216
microscopic level due to reasons such as quantitative and qualitative changes in the 217
anodic biofilm, the ongoing fouling on the membrane/cathode surface. Nevertheless, 218
macroscopic steady-state can be indicated by consistent operation of MFCs when 219
(usually 3) repeated impulses of the same feeding return with comparable voltage-, 220
current-, power-generation profiles, Coulombic and substrate removal efficiencies as 221
well as energy yields (Carmona-Martínez et al., 2015; Hashemi and Samimi, 2012;
222
Menicucci et al., 2006).
223
9
In Figs. 1A-D, the voltage progress curves over the 6 cycles of acetate 224
addition are shown for the MFCs operated under various external loads and in open 225
circuit mode (infinite external resistance, when there is no any flow of current from 226
the anode to the cathode). In the first four days after the point of inoculation, a pre- 227
acclimation period was ensured without the injection of acetate substrate and thus, 228
the organic matter inherently contained in the wastewater seed source could be 229
consumed. Thereafter, acetate supplementation was commenced consecutively (5 230
mM in the anolyte, arrows in Figs. 1A-D) and polarization measurements were 231
undertaken at the maximal current generation state (discussed in details in Section 232
3.2). At the end of the first acetate batch in the Dyn-MFC, the external load was 233
switched to 470 Ω from 680 Ω (‘I.’ in Fig. 1A). The 2nd and 3rd cycles resulted in 234
voltage curves with peak values comparable to the 1st feeding. As illustrated by ‘II.’ in 235
Fig. 1A, the external load was further reduced to 150 Ω. In the Low-MFC, a moderate 236
decrease could be observed at the third peak’s maximal voltage (Fig. 1B), while for 237
High-MFC’s voltage values, a slight increase was registered (Fig. 1C). In general, the 238
current density was considered to indicate the stabilization of MFCs, with the 239
exception of the OCV-MFC where due to the lack of current flow, voltage must have 240
been used for this purpose. Maximal current densities under steady-state (variation of 241
discrete peaks was < 7 %) were 266.6 ± 1.7, 424.6 ± 21.5 and 23.3 ± 1.6 mA m-2 for 242
the Dyn-MFC, Low-MFC and High-MFC, respectively. Under steady-state conditions, 243
peak voltages of 734.6 ± 24.2 mV were measured in the OCV-MFC (Fig. 1D). In 244
successive (4th and onwards) acetate feedings, quasi-stationary operational features 245
were demonstrated by the MFCs excluding Dyn-MFC, for which voltage peak values 246
declined gradually (Fig. 1A). During the 3 last substrate additions, Dyn-MFC and 247
Low-MFC could be characterized by similar mean current density values, 440.4 ± 248
180.6 mA m-2 and 435.6 ± 32.7 mA m-2, respectively. However, in the final cycle, 249
relatively high fluctuation was noticed in the Dyn-MFC and current density as low as 250
288.9 mA m-2 was documented (Fig. 2A). Therefore, it would appear that the Dyn- 251
MFC started-up via dynamic, stepwise tracking of internal resistance was unable to 252
maintain steady-state. In contrast, the other MFCs (Low-MFC, High-MFC and OCV- 253
MFC) acclimated under constant (static) external load or open circuit mode strategies 254
seemed to fulfill the criteria of steady-state operation throughout the cycles.
255
Although rather un-steady current generation tendency was achieved by the 256
Dyn-MFC, this setup provided even an order of magnitude higher performance 257
10
compared to Low-MFC and High-MFC. Actually, according to Fig. 2B, the power 258
densities during the last 3 acetate cycles were as follows: 184.4 – 37.6 mW m-2 (Dyn- 259
MFC), 10.4 ± 1.5 mW m-2 (Low-MFC) and 11.3 ± 4.7 mW m-2 (High-MFC).
260 261
3.1.2. Polarization characteristics 262
263
Whole-cell polarization tests were carried out at different stages of the MFC 264
operation. In Fig. 3A presenting the results for the 3rd acetate feeding cycle, it can be 265
seen that the Dyn-MFC significantly outperformed the other MFCs with maximum 266
(polarization) power density (Pd*
) of > 200 mW m-2 and current density (j*) of ~ 800 267
mA m-2. At the lowest applied external resistance, current density reached 1 A m-2. In 268
contrast, power and current densities of other MFCs were significantly lower. In fact, 269
High- and Low-MFCs were able to produce maximal Pd*
of 87 mW m-2 (j* ≈ 320 mA 270
m-2), while Pd*
was 68 mW m-2 (j* ≈ 200 mA m-2) for the OCV-MFC (Fig. 3A). Among 271
the 4 different MFC setups, the Dyn-MFC exhibited the lowest internal resistance (Rint
272
= 122 Ω) followed by High-MFC, Low-MFC and OCV-MFC (Rint = 228 Ω, 360 Ω and 273
458 Ω, respectively).
274
From the polarization curves drawn at the end of the experiments (6th cycle) 275
(Fig. 3B), it is to deduce that still the Dyn-MFC produced the highest Pd*
(and j*) 276
values, although the maximal Pd*
value and related current density decreased to 173 277
mW m-2 at j* ≈ 700 mA m-2, respectively. Moreover, the power overshoot 278
phenomenon was strikingly experienced at high current densities in this MFC, 279
causing a typical backdrop of Pd*
and j* at low resistances (Fig. 3B). Consequently, 280
Rint of Dyn-MFC increased from 122 Ω to 445 Ω, while it remained rather unchanged 281
in High- and Low-MFCs. Moreover, further significant decrease of Rint (458 Ω → 170 282
Ω) in the OCV-MFC was noticed. This observation might be explained by the 283
limitation processes taking over in Dyn-MFC e.g. compared to the previously seen 284
data of the 3rd cycle. In addition, the least attractive Pd*
(30 mW m-2 at 130 mA m-2) 285
was attained by the Low-MFC. The above maximal power density range (30 – 173 286
mW m-2) observed in this study with two-chamber, batch-type MFCs using (i) mixed 287
culture as inoculum, (ii) Nafion membrane as separator and (iii) acetate as substrate 288
are in good agreement with literature data, where MFCs of similar biotic and 289
architectural traits were able to generate 38 mW m-2 (Min et al., 2005), 43.6 mW m-2 290
(Tang et al., 2010), 65 mW m-2 and 173.3 mW m-2 (Oh and Logan, 2006).
291
11
3.1.3. Cyclic voltammetry (CV) analysis under non-turnover conditions 292
293
Non-turnover (substrate-depleted) cyclic voltammograms (Fig. 3C) were 294
registered after the 6th cycle in order to evaluate the activity of the biofilms on the 295
anode. In general, all MFC biofilms reflected redox activity (cathodic and anodic 296
peaks) within the scanned potential window. Although the redox peaks appeared at 297
similar formal potentials, Dyn-MFC followed by Low-MFC demonstrated the highest 298
peak currents, implying the presumably higher coverage of the anode by electro- 299
active redox compounds e.g. cytochromes. This assumption is strengthened by the 300
derivative CV curves (Fig. 3D), according to which the Dyn- and Low-MFC had 301
remarkably higher dI∙dE-1 values relative to High- and OCV-MFCs (Fig. 3D) and refer 302
to enhanced bioelectrochemical activity (Hong et al., 2011). These observations are 303
in good agreement with the current density ranges of the individual MFCs. However, 304
CV curves and their derivatives suggest differences in terms of the redox properties 305
of the biofilms between the Dyn-MFC and Low-MFC, while the High- and OCV-MFCs 306
could be a way more identical.
307 308
3.2. MFC efficiency in the light of energy and charge recoveries 309
310
The evaluation of MFCs in terms of energy and charge recovery efficiencies – 311
and their mutual relationship – can contribute to the elaboration of external resistance 312
effect. As can be seen in Fig. 4 for particular experimental setups (acetate batches of 313
High-MFC and the first three cycles of Dyn-MFC) along the dashed line, the higher 314
CE* was coupled with higher E. As could be seen previously (Section 3.1), electricity 315
generation in Dyn-MFC was keep on decreasing during the 4th-6th acetate feeding 316
cycles and this is well-reflected in the corresponding CE* and E values (Fig. 4). As 317
for the Low-MFC, although high CE* results were documented, E in this case 318
seemed to be completely limited throughout the operating period.
319
Actually, E vs. CE* in Fig. 4 shows a clear analogy with the common power 320
curves (Pd*
vs. j*) of two-chamber MFCs where the power overshoot occurs (see for 321
instance Figure 1 in the work of Nien et al. (Nien et al., 2011) or Figure 3 in the paper 322
of Watson and Logan (Watson and Logan, 2011)). The decrease of MFC efficiency is 323
usually related to the insufficient activity of the anodic biofilm (Kim et al., 2017) 324
12
caused often by increasing diffusion-limitation (associated with the transport of 325
substrate to cell, e- from cell to the anode or H+ from the electrode towards the 326
cathode) (De Lichtervelde et al., 2019).
327
From the above, it is to conclude that adequate efficiency in the Dyn-MFC 328
could not be maintained for long (the peak performance was shortly followed by a 329
persistent decrease of both E vs. CE*). Nonetheless, one can observe that the 330
operation under either charge transfer- (High-MFC and OCV-MFC) or mass transfer- 331
limited (Low-MFC) regimes resulted in more stable but less-efficient performance.
332
This suggests that a certain trade-off (where stability and performance are 333
compromised) could be beneficial for sustaining MFC in longer-terms. To further 334
elucidate these aspects, the internal resistance components and the anodic microbial 335
communities of the MFCs will be investigated (Sections 3.5 and 3.6). This approach 336
may help to reveal the effect of varied Rext in the light of Rint in MFCs and support the 337
examination of microbiological response strategies to architectural modifications 338
related to Rext. 339
340
3.3. Electrode potentials, internal resistance components and pH 341
alterations during MFC operation at different external loads 342
343
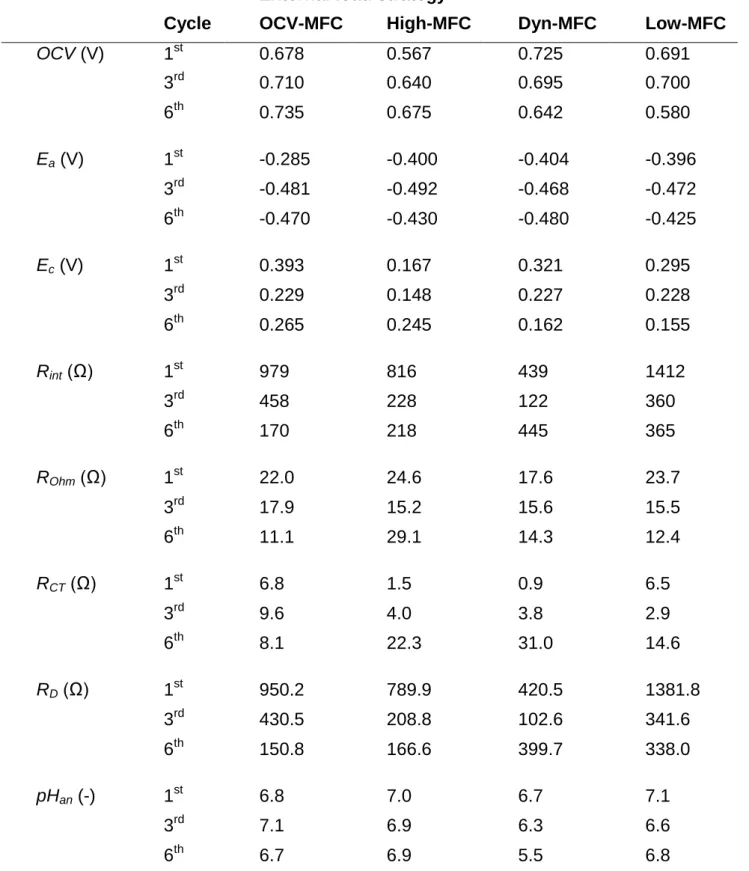
Some essential data for discussing the MFC behaviors are presented in Table 344
1. In fact, anode potentials in all MFCs were found insignificantly different in most 345
acetate feeding cycles, however, some literature studies reported the dependence of 346
Ea on Rext (Katuri et al., 2011; Menicucci et al., 2006). The cathode potentials were 347
also similar except for High-MFC until the 3rd cycle, after which the MFCs with low or 348
no current generation (High-MFC and OCV-MFC, respectively) were characterized by 349
somewhat higher Ec in comparison with Dyn- and Low-MFCs. This can be attributed 350
to the finding that high current densities, by hindering the oxygen reduction reaction 351
(ORR), may cause larger cathodic losses (diffusion limitation) (Liang et al., 2007;
352
Zhang et al., 2011).
353
Breakdown analysis of internal resistance using EIS technique indicates in 354
general that the diffusion resistance (RD) was the most substantial component of Rint, 355
while the contributions of RCT and ROhm were considered less significant (Table 1).
356
Supportive experiences are frequently communicated in the literature (for systems 357
without physical mixing such as in this work) (Hutchinson et al., 2011; Nam et al., 358
13
2010; Ter Heijne et al., 2011; Wang and Yin, 2019). Actually, RD gradually decreased 359
in all the MFCs except in Dyn-MFC during the experiments (Supplementary material).
360
In case of Dyn-MFC, after an initial decrease of RD (where the performance 361
increased simultaneously), the increment of RD from 102.6 Ω to nearly 400 Ω was 362
noted. Actually, the increment of RD in Dyn-MFC over time may point to the 363
occurrence of adverse mass transport conditions in the anode chamber. This 364
matches with the previous discussion of polarization curves (Section 3.2) and energy 365
and electron recovery efficiencies (Section 3.4), where biofilm malfunctioning and 366
diffusion limitation were implied. The mass transfer conditions could be distinguished 367
in the MFCs producing higher current or low/no current, as more than 2-times higher 368
RD values were encountered for the former group (comprising of Dyn-MFC and Low- 369
MFC) compared to the latter one encompassing OCV-MFC and High-MFC. This 370
could be seen supportive to the results of CV measurements (Section 3.3), according 371
to which the anode surfaces of Low-MFC and Dyn-MFC could have been better 372
enriched in redox-active components and thus, covered by a thicker biofilm.
373
The analysis of the pH for samples taken from the anode environment at the 374
end of the cycles strengthens the assumption that mass transport limitation took 375
place the Dyn-MFC. While OCV-, High- and Low-MFCs produced a relatively static 376
final pH (6.6 – 7.1), the anolyte of Dyn-MFC became more acidic likely due to the 377
accumulation of H+. In fact, pH = 6.0 and 5.5 were measured at the end of the 3rd and 378
6th cycles, respectively that may have influenced the bioelectrochemical activity of the 379
anode-respiring biofilm compared to previous cycles (Yuan et al., 2011). To get more 380
useful feedback concerning the anodic biofilm behavior, respective microbial 381
population analysis was carried out and elaborated in the next section.
382 383
3.4. The relationship between electrochemical and microbial properties 384
385
3.4.1. Microbial consortia analysis 386
387
Assessment of microbial communities in the anodic biofilms can promote the 388
more confident understanding of MFC development and operational behavior under 389
different external loads. In this work, the anodic biofilm samples were evaluated 390
based on the number of OTUs, plus the Shannon and Simpson diversity indices. The 391
lowest richness (low number of OTUs) and low evenness were found for the biofilm 392
14
of Dyn-MFC (Supplementary material). This means that the anode could be 393
colonized only by a few phyla to form the electro-active biofilm. Shannon indexes 394
were significantly higher in case of the other MFCs, and relatively high diversity was 395
presented by the Simpson indexes in case of OCV-MFC and High-MFC (pointing to 396
the increased number of phyla in the respective anodic biofilms).
397
The results of PCA analysis, as bioinformatics tool, supported that the 398
maturation of anodic biofilm in Dyn-MFC and Low-MFC was notably different at the 399
level of bacterial orders (Fig. 5A). As a matter of fact, Dyn-MFC had strongly 400
negative value on Dim1 axis and moderate positive value on Dim2 axis. This 401
correlates with the high relative abundance of the order Desulfuromonadales, and the 402
minor contribution of Spirochaetales and Bulkholderiales, among others (Fig. 5B). On 403
the contrary, in case of Low-MFC, moderate to high negative values are observable 404
on Dim1 and Dim2 axes, respectively, which coincides with the high relative 405
abundance of orders particularly Rhodospirillales and Desulfuromonadales.
406
Concerning High-MFC and OCV-MFC, similar microbial selection progresses 407
(differing significantly from those in Dyn-MFC and Low-MFC) were assumed.
408
Actually, high positive value on the Dim1 axis and low positive value on the Dim2 axis 409
can be noticed for both systems thanks to the dominant bacterial orders such as 410
Burkholderiales, Desulfuromonadales, Acholeplasmatales, Bacteroidales and 411
Rhodocyclales (Figs. 5A-B). The various members of these bacterial orders were 412
found in bioelectrochemical systems such as MFCs (Koch et al., 2018; Oh et al., 413
2010), and it is important to discuss the complexity of anodic biofilms at lower 414
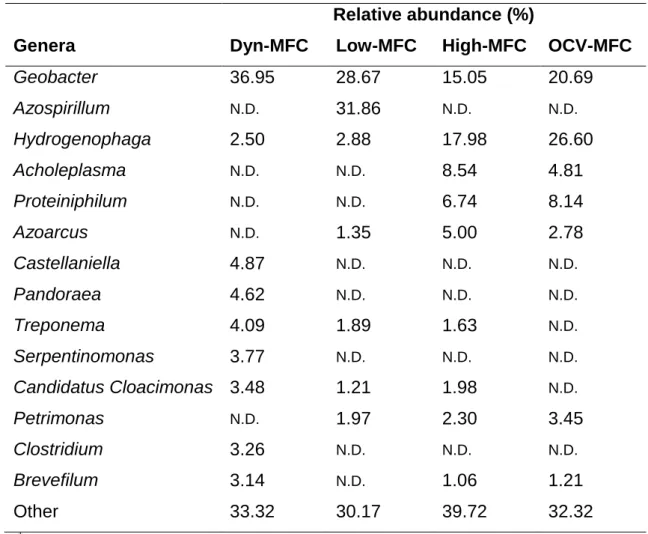
taxonomic levels, particularly based on genera. From relative abundances of genera 415
in Table 2, a complex selection process in the MFCs can be supposed. First of all, it 416
should be underlined that the Dyn-MFC enriched Geobacter (36.95 %) the most 417
among all MFCs and in addition, Castellaniella, Pandoraea, Treponema, 418
Serpentinomonas, Candidatus Cloacimonas, Clostridium and Brevefilum were 419
identified in 4.87 – 3.14 %. Thus, in this particular MFC biofilm, Geobacter was the 420
predominant genus. The relatively high abundance of Geobacter was observed in 421
Low-MFC (28.67 %), however, Azospirillum could be ranked as the most abundant 422
genus (31.86 %). Other genera were present only in < 3 %. Furthermore, it turned out 423
that the biofilms of High-MFC and OCV-MFC, on qualitative grounds, underwent a 424
similar selection progress. Unlike in Dyn-MFC and Low-MFC, Geobacter and 425
Hydrogenophaga were quasi-proportionally observed together. Compared to High- 426
15
MFC, OCV-MFC demonstrated larger abundance of Geobacter (20.69 % vs. 15.05 427
%) and Hydrogenophaga (26.60 % vs. 17.98 %).
428 429
3.4.2. Dissecting the results of electrochemical and molecular biological assays 430
431
In line with the colonization of anode, the electro-active biofilm gets thicker and 432
consequently, an inner, dead-core layer may develop (between the anode surface 433
and the outer, active layer of microorganisms) through which the electron transfer still 434
needs to take place (Sun et al., 2015). Thus, accessibility of the electrode might 435
become spatially hampered for some electro-active microbes to transfer their 436
electrons and under such conditions, the adaption of the microbial consortia can be 437
supposed in order to sustain anode-respiration. From our results on the microbial 438
consortia analysis, it is inferred that the acclimatization of electro-active populations 439
was different in MFCs applying various external load strategy. In essence, similar 440
genera (and relatively diverse biofilm composition) were found in High-MFC and 441
OCV-MFC compared to the other, Dyn- and Low-MFCs. In High-MFC and OCV- 442
MFC, the current density was low to zero due to high external load and the open 443
circuit operation, respectively. As it was reported in previous studies pertain to the 444
effect of external resistance on biomass yield in MFCs, that only small amount of 445
biofilm could be obtained using high resistances, although it was compact in structure 446
and contained mostly active cells in addition to a moderate extent of EPS (Zhang et 447
al., 2011). Moreover, the reduced flow of electrons caused by high external 448
resistance (or the absence of current in case of OCV-MFC) may depress the 449
metabolic activity of electro-active bacteria such as Geobacter, as supported by the 450
outcomes of this work. In structurally compact biofilms, however, the diffusion of 451
protons can get easily limited, which could lead to the even complete inactivation of 452
electro-active bacteria due to the accumulation of H+ and occurrence of pH < 5 453
locally. As for Geobacter, its capability to oxidize acetate into CO2 and H2 (Eq. 7) in 454
the presence of biological hydrogen scavengers was documented. The removal of H2
455
maintains its partial pressure low enough in order for the reaction in Eq. 7 to proceed 456
(Cord-Ruwisch et al., 1998).
457 458
(7) 459
460
16
According to the discussion in Section 3.6, the growth of Hydrogenophaga along with 461
Geobacter was observed in the biofilms of High-MFC and OCV-MFC, implying that 462
indirect interspecies electron transfer (IIET) via H2 could have taken place (Fig. 6A).
463
Such cooperation between Geobacter and hydrogen-utilizing microbes has been 464
explained in previous literature studies (Cord-Ruwisch et al., 1998; Kimura and 465
Okabe, 2013a). Moreover, it was also concluded that Hydrogenophaga can 466
demonstrate exoelectrogenic features (Kimura and Okabe, 2013b) and the 467
contribution of cooperative hydrogen-consuming strains to the net electron flow can 468
be as high as 5-10 % (Cord-Ruwisch et al., 1998). Therefore, it can be presumed that 469
in High-MFC and OCV-MFC, a compact biofilm could have formed with relatively 470
lower metabolic activity (supported by CV measurements) and in these cases, 471
acetate oxidation in Geobacter may have been aided by Hydrogenophaga. This 472
mechanism could be viewed as a strategic response (alternative metabolic pathway) 473
to hindered electron transfer conditions. Moreover, the stability of anodic pH values 474
suggests that the consumption of protons produced by exoelectrogens (according to 475
Eq. 7) contributed to the steady – although less energy-productive – operation.
476
Based on the microbial consortia analysis, in Low-MFC, the flow of electrons 477
was not remarkably obstructed because of the low external load (10 Ω), and the 478
higher current densities (associated with the sufficient metabolic activity) were 479
concomitant to a probably higher yield of biofilm. In fact, it was previously 480
demonstrated in the literature (Zhang et al., 2011) that sub-optimal resistances 481
induced the maturation of thicker but looser biofilm structure with greater portion of 482
extracellular polymeric substances (EPS). In such a situation, more advantageous 483
diffusion of substrate and protons to/from the biofilm, lower biofilm conductivity (as 484
the cells are relatively far from each other compared to a compact biofilm) and mass 485
transfer limitation of charge carriers (within the thick and loose biofilm layer) are likely 486
(Zhang et al., 2011). At the anode of Low-MFC, the predominance of Azospirillum 487
(non-fermentative, nitrogen-fixing genus from Rhodospirillaceae family) in addition to 488
the population of Geobacter was experienced. The Azospirillum was found previously 489
at MFC anodes of previous literature, however, its function/role has not been well- 490
detailed (Pepè Sciarria et al., 2019; Xiao et al., 2015). Nevertheless, it is known that 491
Azospirillum is able to accomplish EET via the reduction of anthraquinone-2,7- 492
disulphonic acid (AQDS) (Zhou et al., 2013). Additionally, it was presumed and 493
investigated in earlier studies that members of this genus could be able to alter the 494
17
pH in its microenvironment (Alonso and Marzocca, 1991). Hence, in Low-MFC 495
(where the current flow is not externally hindered) with a thick and loose biofilm 496
(having significant EPS content as supposed), the higher resistance to the electron 497
transfer within the biofilm matrix may take place and the enrichment of Azospirillum 498
besides Geobacter could be provoked in order to simultaneously facilitate the MFC 499
operation by mediated EET (Fig. 6B). Moreover, since higher currents mean higher 500
quantities of protons, Azospirillum may take part in the pH-balancing (neutralization) 501
of the anodic environment (the measured pH values also assume negligible pH- 502
splitting), as indicated previously (Alonso and Marzocca, 1991).
503
In Dyn-MFC, in which the external load was set close to the theoretical 504
optimum (Rext = Rint), the current- and power generation seemed to be sufficient and 505
well-balanced during the adaption (start-up) period (Section 3.1). These, taking also 506
into consideration the outputs of microbial consortia analysis, enlighten the 507
improvement of MFC performance through adequate (varying/dynamic) external 508
resistance strategy that more selectively promotes Geobacter spp. in the anodic 509
biofilm (presumed to be rich in active microbial cells). However, this low microbial 510
diversity (with remarkable enrichment of Geobacter spp.) could have an adverse 511
effect on the stability of the Dyn-MFC. Actually, once the internal resistance of Dyn- 512
MFC increased (after 3rd cycle, most likely due to the accumulation of protons in 513
anodic microenvironments), the performance of the system declined consistently. As 514
Geobacter seemed to be the main and predominant genus in the biofilm, it is our 515
assumption that the Dyn-MFC was unable to preserve sufficient microbial activity and 516
thus, keep the MFC working in a stable way. Nonetheless, despite an operational 517
instability, it should be recalled that Dyn-MFC achieved the highest current and 518
power densities. In summary, it would appear that although optimal external load 519
conditions are beneficial for the selection of Geobacter spp. and enhance the MFC 520
performance, the low microbiological diversity of the biofilm may lead to the lack of 521
ability in managing the metabolism-related limitations (e.g. accumulation of protons).
522
In this section, the results were attempted to be elucidated by setting-up a 523
plausible theoretical framework or in other words, a hypothesis-driven explanation 524
regarding the behavior of MFCs start-up with different external load strategies. To 525
verify or discard these ideas and assumed mechanisms behind the observed effects, 526
future research will have to be conducted. It is proposed to investigate (i) how the 527
biofilm composition/structure of Dyn-MFC changes in longer-terms (to reveal slow 528
18
post-adaptation, if any), (ii) what pattern the performance of decline follows in Dyn- 529
MFC over time and find out if a new steady-state can be reached, and (iii) what is the 530
exact role of different microbes other than Geobacter spp. in the biofilm. The data 531
and assumptions presented here may be initiative for reconsidering the relationship 532
between performance and operational stability of MFCs from the viewpoint of 533
external load conditions and related microbiological responses.
534 535
4. Conclusions 536
537
In this work, the effect of different external load strategies was studied in 538
microbial fuel cells. The Dyn-MFC, although showed significantly higher performance 539
compared to other MFCs, failed to keep sufficient operational stability. It was 540
assumed that the marked dominance of Geobacter spp. in the anodic biofilm of Dyn- 541
MFC could have an adverse impact on the MFC stability, likely due to severe H+ 542
accumulation in vicinity of the anode. Meanwhile, High-, OCV- and Low-MFCs 543
seemed to be more adaptive to the charge and mass transfer limitations at microbial 544
level thanks to the co-existence of either Hydrogenophaga or Azospirillum with 545
Geobacter.
546 547
Acknowledgements 548
549
Péter Bakonyi acknowledges the János Bolyai Research Scholarship of the 550
Hungarian Academy of Sciences for the support. The financial support of this work by 551
Széchenyi 2020 under the project GINOP-2.3.2-15-2016-00016 is gratefully 552
appreciated.
553 554
Appendix A. Supplementary data 555
E-supplementary data for this work can be found in e-version of this paper online.
556
19 References
557
558
1. Alonso, M.R., Marzocca, M.C., 1991. Autoregulation of PH by Azospirillum 559
Spp., in: Nitrogen Fixation. Springer, Dordrecht, pp. 303–304.
560
https://doi.org/10.1007/978-94-011-3486-6_57 561
2. Bakonyi, P., Koók, L., Keller, E., Bélafi-Bakó, K., Rózsenberszki, T., Saratale, 562
G.D., Nguyen, D.D., Banu, J.R., Nemestóthy, N., 2018a. Development of 563
bioelectrochemical systems using various biogas fermenter effluents as 564
inocula and municipal waste liquor as adapting substrate. Bioresour. Technol.
565
259, 75–82. https://doi.org/10.1016/j.biortech.2018.03.034 566
3. Bakonyi, P., Koók, L., Kumar, G., Tóth, G., Rózsenberszki, T., Nguyen, D.D., 567
Chang, S.W., Zhen, G., Bélafi-Bakó, K., Nemestóthy, N., 2018b. Architectural 568
engineering of bioelectrochemical systems from the perspective of polymeric 569
membrane separators: A comprehensive update on recent progress and future 570
prospects. J. Membr. Sci. 564, 508–522.
571
https://doi.org/10.1016/j.memsci.2018.07.051 572
4. Carmona-Martínez, A.A., Trably, E., Milferstedt, K., Lacroix, R., Etcheverry, L., 573
Bernet, N., 2015. Long-term continuous production of H<inf>2</inf> in a 574
microbial electrolysis cell (MEC) treating saline wastewater. Water Res. 81, 575
149–156. https://doi.org/10.1016/j.watres.2015.05.041 576
5. Cord-Ruwisch, R., Lovley, D.R., Schink, B., 1998. Growth of Geobacter 577
sulfurreducens with acetate in syntrophic cooperation with hydrogen-oxidizing 578
anaerobic partners. Appl. Environ. Microbiol. 64, 2232–2236.
579
6. De Lichtervelde, A.C.L., Ter Heijne, A., Hamelers, H.V.M., Biesheuvel, P.M., 580
Dykstra, J.E., 2019. Theory of Ion and Electron Transport Coupled with 581
Biochemical Conversions in an Electroactive Biofilm. Phys. Rev. Appl. 12.
582
https://doi.org/10.1103/PhysRevApplied.12.014018 583
7. Ghasemi, M., Wan Daud, W.R., Ismail, M., Rahimnejad, M., Ismail, A.F., 584
Leong, J.X., Miskan, M., Ben Liew, K., 2013. Effect of pre-treatment and 585
biofouling of proton exchange membrane on microbial fuel cell performance.
586
Int. J. Hydrogen Energ. 38, 5480–5484.
587
https://doi.org/10.1016/j.ijhydene.2012.09.148 588
8. Hashemi, J., Samimi, A., 2012. Steady state electric power generation in up- 589
flow microbial fuel cell using the estimated time span method for bacteria 590
20
growth domestic wastewater. Biomass Bioenerg. 45, 65–76.
591
https://doi.org/10.1016/j.biombioe.2012.05.011 592
9. Hong, Y., Call, D.F., Werner, C.M., Logan, B.E., 2011. Adaptation to high 593
current using low external resistances eliminates power overshoot in microbial 594
fuel cells. Biosens. Bioelectron. 28, 71–76.
595
https://doi.org/10.1016/j.bios.2011.06.045 596
10. Hutchinson, A.J., Tokash, J.C., Logan, B.E., 2011. Analysis of carbon fiber 597
brush loading in anodes on startup and performance of microbial fuel cells. J.
598
Power Sources 196, 9213–9219.
599
https://doi.org/10.1016/j.jpowsour.2011.07.040 600
11. Katuri, K.P., Scott, K., Head, I.M., Picioreanu, C., Curtis, T.P., 2011. Microbial 601
fuel cells meet with external resistance. Bioresour. Technol. 102, 2758–2766.
602
https://doi.org/10.1016/j.biortech.2010.10.147 603
12. Kim, B., An, J., Chang, I.S., 2017. Elimination of Power Overshoot at 604
Bioanode through Assistance Current in Microbial Fuel Cells. ChemSusChem 605
10, 612–617. https://doi.org/10.1002/cssc.201601412 606
13. Kimura, Z.I., Okabe, S., 2013a. Acetate oxidation by syntrophic association 607
between Geobacter sulfurreducens and a hydrogen-utilizing exoelectrogen.
608
ISME J. 7, 1472–1482. https://doi.org/10.1038/ismej.2013.40 609
14. Kimura, Z.I., Okabe, S., 2013b. Hydrogenophaga electricum sp. nov., isolated 610
from anodic biofilms of an acetate-fed microbial fuel cell. Journal of General 611
and Appl. Microbiol. 59, 261–266. https://doi.org/10.2323/jgam.59.261 612
15. Koch, C., Korth, B., Harnisch, F., 2018. Microbial ecology-based engineering 613
of Microbial Electrochemical Technologies. Microb. Biotechnol. 11, 22–38.
614
https://doi.org/10.1111/1751-7915.12802 615
16. Koók, L., Kanyó, N., Dévényi, F., Bakonyi, P., Rózsenberszki, T., Bélafi-Bakó, 616
K., Nemestóthy, N., 2018. Improvement of waste-fed bioelectrochemical 617
system performance by selected electro-active microbes: Process evaluation 618
and a kinetic study. Biochem. Eng. J. 137, 100–107.
619
https://doi.org/10.1016/j.bej.2018.05.020 620
17. Koók, L., Kaufer, B., Bakonyi, P., Rózsenberszki, T., Rivera, I., Buitrón, G., 621
Bélafi-Bakó, K., Nemestóthy, N., 2019a. Supported ionic liquid membrane 622
based on [bmim][PF6] can be a promising separator to replace Nafion in 623
microbial fuel cells and improve energy recovery: A comparative process 624
21
evaluation. J. Membr. Sci. 570–571, 215–225.
625
https://doi.org/10.1016/j.memsci.2018.10.063 626
18. Koók, L., Quéméner, E.D. Le, Bakonyi, P., Zitka, J., Trably, E., Tóth, G., 627
Pavlovec, L., Pientka, Z., Bernet, N., Bélafi-Bakó, K., Nemestóthy, N., 2019b.
628
Behavior of two-chamber microbial electrochemical systems started-up with 629
different ion-exchange membrane separators. Bioresour. Technol. 278, 279–
630
286. https://doi.org/10.1016/j.biortech.2019.01.097 631
19. Kumar, R., Singh, L., Wahid, Z.A., Din, M.F.M., 2015. Exoelectrogens in 632
microbial fuel cells toward bioelectricity generation: A review. Int. J. Energ.
633
Res. 39, 1048–1067. https://doi.org/10.1002/er.3305 634
20. Liang, P., Huang, X., Fan, M.Z., Cao, X.X., Wang, C., 2007. Composition and 635
distribution of internal resistance in three types of microbial fuel cells. Appl.
636
Microbiol. Biotechnol. 77, 551–558. https://doi.org/10.1007/s00253-007-1193- 637
4 638
21. Logan, B.E., Hamelers, B., Rozendal, R., Schröder, U., Keller, J., Freguia, S., 639
Aelterman, P., Verstraete, W., Rabaey, K., 2006. Microbial fuel cells:
640
Methodology and technology. Environ. Sci. Technol. 40, 5181–5192.
641
https://doi.org/10.1021/es0605016 642
22. Logan, B.E., Rossi, R., Ragab, A., Saikaly, P.E., 2019. Electroactive 643
microorganisms in bioelectrochemical systems. Nat. Rev. Microbiol. 17, 307–
644
319. https://doi.org/10.1038/s41579-019-0173-x 645
23. Lyon, D.Y., Buret, F., Vogel, T.M., Monier, J.M., 2010. Is resistance futile?
646
Changing external resistance does not improve microbial fuel cell 647
performance. Bioelectrochemistry 78, 2–7.
648
https://doi.org/10.1016/j.bioelechem.2009.09.001 649
24. Menicucci, J., Beyenal, H., Marsili, E., Veluchamy, R.A., Demir, G., 650
Lewandowski, Z., 2006. Procedure for determining maximum sustainable 651
power generated by microbial fuel cells. Environ. Sci. Technol. 40, 1062–1068.
652
https://doi.org/10.1021/es051180l 653
25. Min, B., Cheng, S., Logan, B.E., 2005. Electricity generation using membrane 654
and salt bridge microbial fuel cells. Water Res. 39, 1675–1686.
655
https://doi.org/10.1016/j.watres.2005.02.002 656
26. Nam, J.Y., Kim, H.W., Lim, K.H., Shin, H.S., Logan, B.E., 2010. Variation of 657
power generation at different buffer types and conductivities in single chamber 658
22
microbial fuel cells. Biosens. Bioelectron. 25, 1155–1159.
659
https://doi.org/10.1016/j.bios.2009.10.005 660
27. Nien, P.C., Lee, C.Y., Ho, K.C., Adav, S.S., Liu, L., Wang, A., Ren, N., Lee, 661
D.J., 2011. Power overshoot in two-chambered microbial fuel cell (MFC).
662
Bioresour. Technol. 102, 4742–4746.
663
https://doi.org/10.1016/j.biortech.2010.12.015 664
28. Oh, S.E., Logan, B.E., 2006. Proton exchange membrane and electrode 665
surface areas as factors that affect power generation in microbial fuel cells.
666
Appl. Microbiol. Biotechnol. 70, 162–169. https://doi.org/10.1007/s00253-005- 667
0066-y 668
29. Oh, S.T., Kim, J.R., Premier, G.C., Lee, T.H., Kim, C., Sloan, W.T., 2010.
669
Sustainable wastewater treatment: How might microbial fuel cells contribute.
670
Biotechnol. Adv. 28, 871–881.
671
https://doi.org/10.1016/j.biotechadv.2010.07.008 672
30. Pandey, P., Shinde, V.N., Deopurkar, R.L., Kale, S.P., Patil, S.A., Pant, D., 673
2016. Recent advances in the use of different substrates in microbial fuel cells 674
toward wastewater treatment and simultaneous energy recovery. Appl. Energ.
675
168, 706–723. https://doi.org/10.1016/j.apenergy.2016.01.056 676
31. Pasternak, G., Greenman, J., Ieropoulos, I., 2018. Dynamic evolution of 677
anodic biofilm when maturing under different external resistive loads in 678
microbial fuel cells. Electrochemical perspective. J. Power Sources 400, 392–
679
401. https://doi.org/10.1016/j.jpowsour.2018.08.031 680
32. Patil, S.A., Gildemyn, S., Pant, D., Zengler, K., Logan, B.E., Rabaey, K., 2015.
681
A logical data representation framework for electricity-driven bioproduction 682
processes. Biotechnol. Adv. 33, 736–744.
683
https://doi.org/10.1016/j.biotechadv.2015.03.002 684
33. Pepè Sciarria, T., Arioli, S., Gargari, G., Mora, D., Adani, F., 2019. Monitoring 685
microbial communities’ dynamics during the start-up of microbial fuel cells by 686
high-throughput screening techniques. Biotechnol. Rep. 21.
687
https://doi.org/10.1016/j.btre.2019.e00310 688
34. Pinto, R.P., Srinivasan, B., Uiot, S.R., Tartakovsky, B., 2011. The effect of 689
real-time external resistance optimization on microbial fuel cell performance.
690
Water Res. 45, 1571–1578. https://doi.org/10.1016/j.watres.2010.11.033 691
35. Raghavulu, S.V., Mohan, S.V., Goud, R.K., Sarma, P.N., 2009. Effect of 692
23
anodic pH microenvironment on microbial fuel cell (MFC) performance in 693
concurrence with aerated and ferricyanide catholytes. Electrochem. Commun.
694
11, 371–375. https://doi.org/10.1016/j.elecom.2008.11.038 695
36. Rezaei, F., Richard, T.L., Brennan, R.A., Logan, B.E., 2007. Substrate- 696
enhanced microbial fuel cells for improved remote power generation from 697
sediment-based systems. Environ. Sci. Technol. 41, 4053–4058.
698
https://doi.org/10.1021/es070426e 699
37. Rismani-Yazdi, H., Christy, A.D., Carver, S.M., Yu, Z., Dehority, B.A., 700
Tuovinen, O.H., 2011. Effect of external resistance on bacterial diversity and 701
metabolism in cellulose-fed microbial fuel cells. Bioresour. Technol. 102, 278–
702
283. https://doi.org/10.1016/j.biortech.2010.05.012 703
38. Sun, D., Cheng, S., Wang, A., Li, F., Logan, B.E., Cen, K., 2015. Temporal- 704
spatial changes in viabilities and electrochemical properties of anode biofilms.
705
Environ. Sci. Technol. 49, 5227–5235.
706
https://doi.org/10.1021/acs.est.5b00175 707
39. Suzuki, K., Kato, Y., Yui, A., Yamamoto, S., Ando, S., Rubaba, O., Tashiro, Y., 708
Futamata, H., 2018. Bacterial communities adapted to higher external 709
resistance can reduce the onset potential of anode in microbial fuel cells. J.
710
Biosci. Bioeng. 125, 565–571. https://doi.org/10.1016/j.jbiosc.2017.12.018 711
40. Tang, X., Guo, K., Li, H., Du, Z., Tian, J., 2010. Microfiltration membrane 712
performance in two-chamber microbial fuel cells. Biochem. Eng. J. 52, 194–
713
198. https://doi.org/10.1016/j.bej.2010.08.007 714
41. Ter Heijne, A., Schaetzle, O., Gimenez, S., Fabregat-Santiago, F., Bisquert, 715
J., Strik, D.P.B.T.B., Barrière, F., Buisman, C.J.N., Hamelers, H.V.M., 2011.
716
Identifying charge and mass transfer resistances of an oxygen reducing 717
biocathode. Energ. Environ. Sci. 4, 5035–5043.
718
https://doi.org/10.1039/c1ee02131a 719
42. Wang, J., Yin, Y., 2019. Progress in microbiology for fermentative hydrogen 720
production from organic wastes. Crit. Rev. Environ. Sci. Technol. 49, 825–865.
721
https://doi.org/10.1080/10643389.2018.1487226 722
43. Watson, V.J., Logan, B.E., 2011. Analysis of polarization methods for 723
elimination of power overshoot in microbial fuel cells. Electrochem. Commun.
724
13, 54–56. https://doi.org/10.1016/j.elecom.2010.11.011 725
44. Woodward, L., Perrier, M., Srinivasan, B., Pinto, R.P., Tartakovsky, B., 2010.
726