The in fl uence of external load variables on creatine kinase change during preseason
training period
D ANIEL CSALA
1,2p, BENCE M ARK KOV ACS
1,2, P ETER BALI
2, G ABOR REHA
2,4and GERGELY P ANICS
2,31University of Physical Education, Budapest, Hungary
2Sports Science Department, Ferencvarosi TC, Budapest, Hungary
3Department of Traumatology, Semmelweis University, Budapest, Hungary
4Department of Orthopedics & Traumatology, Uzsoki Hospital, Budapest, Hungary
Received: October 29, 2020 • Accepted: July 7, 2021 Published online: September 16, 2021
© 2021 The Author(s)
ABSTRACT
Objective:The aim of the present study was to analyse the relationships between creatine kinase (CK) concentration, an indirect marker of muscle damage, and global positioning system (GPS)-derived metrics of a continuous two-week-long preseason training period in elite football.Design:Twenty-one elite male professional soccer players were assessed during a 14-day preseason preparatory period. CK concentrations were determined each morning, and a GPS system was used to quantify the external load. A generalized estimating equation (GEE) model was established to determine the extent to which the external load parameter explained post-training CK levels.Results:The GEE model found that higher numbers of de- celerations (c257.83, P 50.005) were most strongly associated with the post-training CK level. De- celerations and accelerations accounted for 62% and 11% of the post-training CK level, respectively, and considerable interindividual variability existed in the data.Conclusion:The use of GPS to predict muscle damage could be of use to coaches and practitioners in prescribing recovery practices. Based on GPS data, more individualized strategies could be devised and could potentially result in better subsequent perfor- mance.
pCorresponding author. University of Physical Education, Alkotas street 44, 1123, Budapest, Hungary. Tel.:þ36 202928847. E-mail: daniel.csalahk@gmail.com
Physiology International108 (2021) 3, 371–382 DOI:10.1556/2060.2021.30019
KEYWORDS
creatine kinase, preseason, external load, generalized estimating equations, football
INTRODUCTION
Football is a contact team sport played over a duration of approximately 90 min and is char- acterized by repeated high-intensity passages of play interspersed with active recovery periods [1]. These high-intensity passages consist of numerous intensive accelerations and decelerations and a series of high-intensity activities, such as sprinting, jumping, and changing direction [2,3].
The tactical evolution of the game has seen increases in the numbers of activities such as sprints, accelerations and decelerations [4–6]. Sprints, accelerations and decelerations generate large eccentric-based contractions [7,8], which are major contributors to muscle damage [7,9,10]. As a result of these combined physical loads in elite football, there is potential for significant muscle damage to occur.
The concentration of plasma creatine kinase ([CK]) is used as a marker of muscle damage [9–11]. The possible mechanism behind an elevated [CK] is a function of the damage to muscle cell membranes during exercise [12]. The eccentric activation of the muscle results in a higher tension per cross-sectional area and causes damage to cell membranes [13]. These actions are common during intense bouts of activity in football matches [14]. Therefore, the serum [CK] is a marker of player fatigue and may be useful when monitoring the recovery status of football players. Most studies have focused on the post-match CK response. Studies have shown that markers of muscle microtrauma, such as [CK], increase within 48–72 h after a game [15,16].
Most studies on this topic have determined CK levels at only one time point after the game [14], investigated friendly games [15], or analysed one or two games separately [8, 15, 17]. The interpretation of CK monitoring as a basis for making practical adjustments to athlete training and recovery practices over the course of a preseason training period (PTP) has not been established.
Accordingly, PTP is seen as a crucial period to develop physical abilities to meet the physical demands of the football season. The accurate management of training loads during this period is essential to both maximize training adaptations and minimize injury occurrence. Quantifying the muscle damage associated with measures of training load has direct implications for the weekly modification of recovery. The purpose of this study was to document the changes in serum [CK] as a result of a two-week-long PTP and to investigate the extent to which indices of training load can explain [CK] changes in elite football.
MATERIALS AND METHODS
Study design
This 2-week study was designed to investigate the effects of training load on the biochemical marker status of professional elite male football players during the preseason training period.
During the off-season period, the physical activity of the football players was not controlled, but
372 Physiology International108 (2021) 3, 371–382
an individualized training programme was applied (supplementary content 1). The training programme implemented during the PTP was planned by team staff and was not influenced by the researchers, and no modifications were applied based on the CK level. During the PTP, systematic resistance training was not included in the training schedule.
Subjects
Twenty-one elite male professional soccer players (mean± SD: age: 25.4 ±4.8 years; height:
179.5±6.9 cm; body mass: 75.6±8.1 kg; and body mass index: 23.4±1.5) representing a single club participated in the study. The inclusion criteria were attending at least 75% of the training sessions and undergoing all sample collections. The exclusion criteria were any type of injury that caused additional CK elevation, modification of the training or non-attendance. Players with any ongoing rehabilitation programme or medical treatment were excluded from the analysis. All participants provided written informed consent for this study, which was approved by the local Ethics Committee (University of Physical Education) in accordance with the Hel- sinki Declaration.
Procedures
Biomarker status. Plasma [CK] was measured using a fingertip blood sample obtained using a disposable spring-loaded lancet. A heparinized capillary tube was used to collect a 32
m
L sampleof capillary blood, which was pipetted onto commercially available Reflotron strips employing a Reflotron Plus Apparatus (Roche Diagnostics, Germany). During the preseason training period (15 days), blood samples were collected each day (before breakfast, between 7:00 am and 8:00 am) to determine the extent of muscle damage as a result of the training.
Training load. The players’physical activity during each training session was monitored using an athlete monitoring system with a 10-Hz GPS unit integrated with a 100-Hz triaxial accel- erometer (firmware version v6.01, Vector S7, Catapult Sports, Melbourne, Australia). The receiver was positioned on each player in the centre area of the upper back and slightly superior to the shoulder blades by a tightlyfitted vest manufactured by Catapult. The reliability [18] and validity [19] for velocity-based and accelerometer-derived data [20] of the device have previ- ously shown acceptable levels. The use and collection of the GPS data process were in accor- dance with the recommended guidelines for the use of GPS data in sports [21]. To avoid interunit error, each player wore the same GPS device for each training session [18]. The minimal effort duration was set to 0.4 s for all datafiles to detect velocity. After recording, the data were downloaded to a computer and analysed by the manufacturer’s software (Openfield v2.3.1, Catapult Sports, Melbourne, Australia). The analysis only included data from the team’s field-based training sessions, and all rehabilitation or individualfitness sessions were excluded from the analysis. Based on the literature [13, 22, 23], combinations of expert knowledge regarding which variables hold superior practical or clinical importance, and discussions focusing on the likely predictors of muscle damage, the following indices of training and match physical load were used in the analysis: player physical load data were recorded from the period of the investigation as total distance (TD), high-speed running distance (HSR; >19.8 km h1), and sprint distance (SP; >21.5 km h1) [24, 25]. Based on the characteristics of football, the
Physiology International108 (2021) 3, 371–382 373
mechanical load of each player was investigated as the number of accelerations (2/ms2) and decelerations (2/ms2) [26]. Session duration was also recorded (minutes), and total distance and high-speed running distance covered were divided by session duration (minutes) to obtain the intensity values per minute.
Statistical analysis
Preliminary analyses included assessments of normality, linearity, and homoscedasticity, along with calculations of descriptive statistics (mean±SD and range) and 95% confidence intervals (CIs). All analyses were undertaken in R statistical computing software version 3.4.1 [27]. To determine the extent to which nine training-load indices explained CK levels, a generalized estimating equation (GEE) model was built using the Geepack package [28]. For this, an exchangeable correlation structure, Gaussian distribution of the response variable (CK), and identity link function were assumed. For the GEE models, the predicted CK for each instance was outputted and visualized for comparison with the observed values, whereas the overall model performance was determined as the root mean square error (RMSE) of the prediction.
RESULTS
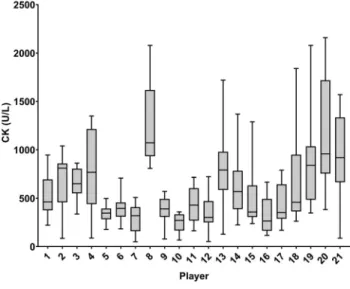
Tables 1aandbshow the training-load distribution day by day. Considerable variability in CK was observed within and between players (Fig. 1) and between days (Tables 1a and b). The results from the GEE revealed one index of training-load explanatory of [CK] (Table 2). Spe- cifically, higher numbers of decelerations (c257.82,P50.005) were strongly associated with higher CK values. The RMSE of the model was 413 U L1. Generalized estimating equationc2 values for each match-load index were converted to a relative format (Fig. 2A) in an attempt to apportion the percent contribution. The relative contribution of decelerations to changes in [CK] was 62%, that of accelerations was 11%, and that of total distance was 5%, but 21% of the contribution was still unfitted to the model. The prediction error plotted against each observed CK value in the GEE model is shown inFig. 2B.
DISCUSSION
In the present study, the number of accelerations and decelerations was shown to be a main contributor to changes in [CK], with 11% and 62% relative contributions, respectively. This suggests that greater changes in mechanical demands of the training are associated with greater muscle damage. These findings highlight the physically demanding nature of the preseason training period and the challenges of individual player load management and recovery.
The high contribution of deceleration and acceleration may be a consequence of muscle strain during the accelerating or decelerating phase of high-intensity movement, which exac- erbates the damage response [7,8]. Our research is in accordance with a previous study [22] in Australian rules football (AF) showing that changes in [CK] following AF matching were correlated with high acceleration metres covered (r50.75). Furthermore, deceleration measures were significantly greater in the high [CK] group than in the low [CK] group, supporting the hypothesis that eccentric muscle activity is more strongly associated with high CK levels [29,30].
374 Physiology International108 (2021) 3, 371–382
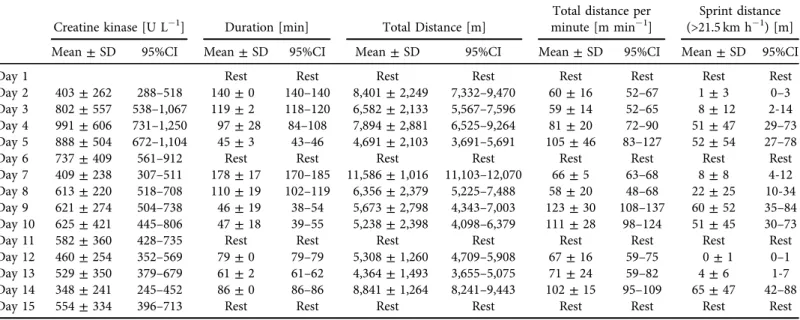
Table 1a.Training load indices and creatine kinase levels across the preseason training camp
Creatine kinase [U L1] Duration [min] Total Distance [m]
Total distance per minute [m min1]
Sprint distance (>21.5 km h1) [m]
Mean±SD 95%CI Mean±SD 95%CI Mean±SD 95%CI Mean±SD 95%CI Mean±SD 95%CI
Day 1 Rest Rest Rest Rest Rest Rest Rest Rest
Day 2 403±262 288–518 140±0 140–140 8,401±2,249 7,332–9,470 60±16 52–67 1±3 0–3 Day 3 802±557 538–1,067 119±2 118–120 6,582±2,133 5,567–7,596 59±14 52–65 8±12 2-14 Day 4 991±606 731–1,250 97±28 84–108 7,894±2,881 6,525–9,264 81±20 72–90 51±47 29–73 Day 5 888±504 672–1,104 45±3 43–46 4,691±2,103 3,691–5,691 105±46 83–127 52±54 27–78
Day 6 737±409 561–912 Rest Rest Rest Rest Rest Rest Rest Rest
Day 7 409±238 307–511 178±17 170–185 11,586±1,016 11,103–12,070 66±5 63–68 8±8 4-12 Day 8 613±220 518–708 110±19 102–119 6,356±2,379 5,225–7,488 58±20 48–68 22±25 10-34 Day 9 621±274 504–738 46±19 38–54 5,673±2,798 4,343–7,003 123±30 108–137 60±52 35–84 Day 10 625±421 445–806 47±18 39–55 5,238±2,398 4,098–6,379 111±28 98–124 51±45 30–73
Day 11 582±360 428–735 Rest Rest Rest Rest Rest Rest Rest Rest
Day 12 460±254 352–569 79±0 79–79 5,308±1,260 4,709–5,908 67±16 59–75 0±1 0–1 Day 13 529±350 379–679 61±2 61–62 4,364±1,493 3,655–5,075 71±24 59–82 4±6 1-7 Day 14 348±241 245–452 86±0 86–86 8,841±1,264 8,241–9,443 102±15 95–109 65±47 42–88
Day 15 554±334 396–713 Rest Rest Rest Rest Rest Rest Rest Rest
PhysiologyInternational108(2021)3,371–382375
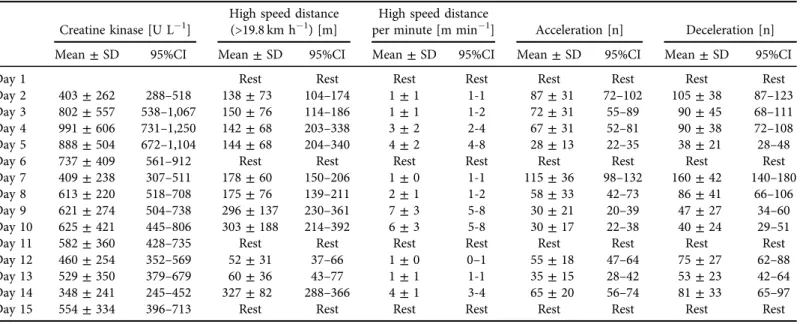
Table 1b.Training load indices and morning creatine kinase levels across the preseason training camp
Creatine kinase [U L1]
High speed distance (>19.8 km h1) [m]
High speed distance
per minute [m min1] Acceleration [n] Deceleration [n]
Mean±SD 95%CI Mean±SD 95%CI Mean±SD 95%CI Mean±SD 95%CI Mean±SD 95%CI
Day 1 Rest Rest Rest Rest Rest Rest Rest Rest
Day 2 403±262 288–518 138±73 104–174 1±1 1-1 87±31 72–102 105±38 87–123
Day 3 802±557 538–1,067 150±76 114–186 1±1 1-2 72±31 55–89 90±45 68–111
Day 4 991±606 731–1,250 142±68 203–338 3±2 2-4 67±31 52–81 90±38 72–108
Day 5 888±504 672–1,104 144±68 204–340 4±2 4-8 28±13 22–35 38±21 28–48
Day 6 737±409 561–912 Rest Rest Rest Rest Rest Rest Rest Rest
Day 7 409±238 307–511 178±60 150–206 1±0 1-1 115±36 98–132 160±42 140–180
Day 8 613±220 518–708 175±76 139–211 2±1 1-2 58±33 42–73 86±41 66–106
Day 9 621±274 504–738 296±137 230–361 7±3 5-8 30±21 20–39 47±27 34–60
Day 10 625±421 445–806 303±188 214–392 6±3 5-8 30±17 22–38 40±24 29–51
Day 11 582±360 428–735 Rest Rest Rest Rest Rest Rest Rest Rest
Day 12 460±254 352–569 52±31 37–66 1±0 0–1 55±18 47–64 75±27 62–88
Day 13 529±350 379–679 60±36 43–77 1±1 1-1 35±15 28–42 53±23 42–64
Day 14 348±241 245–452 327±82 288–366 4±1 3-4 65±20 56–74 81±33 65–97
Day 15 554±334 396–713 Rest Rest Rest Rest Rest Rest Rest Rest
376PhysiologyInternational108(2021)3,371–382
However, in previous studies, acceleration and deceleration were identified as contributors to muscle damage, and sprint distance (r 5 0.42–0.89), sprint number (r 5 0.86) and high-in- tensity running (r50.92) showed strong associations with CK changes [13,22]. These studies analysed only match situations where these loading parameters occurred more frequently compared to our technical staff-driven PTP period, which may result in the fact that we did not find a high contribution of these parameters to CK change.
Interestingly, in our study, even though the subjects had not yet begun PTP, the mean CK level was 403.1±262.0 U L1, which is higher than the published CK norms for healthy men
Table 2.Generalized estimating equation model for creatine kinase concentration
b(mean±SE) c2 P
Intercept 439.70±267.40 2.7 0.1
Duration [min] 0.25±3.75 0.01 0.95
High speed distance (>19.8 km h1) [m] 0.07±0.60 0.014 0.91
Deceleration [n] 2.64±0.94 7.82 0.005
Total distance [m] 0.05±0.06 0.61 0.435
Total distance per minute [m min1] 0.23±3.46 0.01 0.95
Acceleration [n] 1.87±1.57 1.41 0.23
Sprint distance (>21.5 km h1) [m] 0.04±0.77 0.01 0.96
High speed distance per minute [m min1]
1.61±24.99 0.01 0.95
pb5beta coefficient;c25Wald chi-square.
Fig. 1.Individual player (n521) creatine kinase concentrations during the preseason training camp. Data are presented as box and whisker plots with median, 25th to 75th percentiles and the whiskers as the
minimum and maximum
Physiology International108 (2021) 3, 371–382 377
[31]. The high CK levels found on day one of the PTP can likely be explained by uncontrolled summer conditioning programmes. Furthermore, Hortobagyi and Denahan [12] showed that it is not uncommon for healthy exercising athletes to have blood CK levels ranging from 100 to 1000 U L1. The [CK] was substantially elevated until thefirst rest day of the PTP (on the sixth day), with an average 212% increase in the [CK] from thefirst day of PTP. In the next four (7th– 10th) days of PTP, there was only a 149% increase in the [CK], and in thefinal phase (12th–14th day) of PTP, the average CK response was only 118% of that on thefirst day. The reduction in [CK] observed over time in this study may be ascribed to the repeated bout effect. The repeated bout effect is a phenomenon in which the magnitude of muscle damage is attenuated in a subsequent exercise bout after performing a single bout of exercise. Because of the repeated bout effect, the recovery of muscle from eccentric exercise-induced muscle damage is not retarded by additional eccentric exercise bouts performed in early recovery days [32–34]. These findings suggest that protective mechanisms take place soon after the first exercise bout and further muscle damage is prevented.
In this study, high individual variability was observed in [CK] day by day (Fig. 1), which is similar to previously published results [9,35,36]. The literature suggests that differences exist between individuals in the context of CK response with the level of training, fibre type, and Fig. 2.Relative importance of the match-load variables (A) and model error (B) to predict creatine kinase concentration from the GEE model. GEE5generalized estimating equation; RMSE5root mean square
error
378 Physiology International108 (2021) 3, 371–382
muscle size [10]. In fact, a higher increase in CK levels is to be expected in individuals with lower physical fitness, as during initial training periods [10], athletes with a chronically low [CK]
exhibit predominantly low variability (men up to 200 U L1, whereas athletes with chronically higher values (men up to 400 U L1) exhibit considerable variability in CK response [37]. This inherent variability may limit its usefulness as a monitoring tool in elite team sports beyond understanding the overall demands of this congestive period. Alternately, and provided indi- vidual baselines and player characteristics are taken into account [35], it may provide useful insights into instances when certain players, or the team as a whole, have experienced muscle damage greater than usual or are displaying residual levels of fatigue. As with any monitoring tool to facilitate coach decision-making, data need to be analysed using appropriate techniques and interpreted individually and cautiously, and this type of monitoring is best undertaken with a suite of practical, sport-specific measures [38].
Several limitations in the conduct of this study should be acknowledged and considered when interpreting the findings. Compared to venous blood sampling, the capillary blood collection method was found to be a less reliable method and tended to overestimate the [CK]
[39]. In contrast, capillary blood sampling rather than venipuncture provides a less invasive sampling method with minimal disturbance to routine athletes. During this two-week sample collection period, capillary blood collection was the more“real-word”solution, despite its lower reliability. As an additional limitation, [CK] was the only marker of muscle damage used, and using more than one marker from both blood and urine could provide a better estimation of muscle stress [11]. In our study, blood collection was performed on mornings, 14–22 h after training during a 14-day interval; however, peak CK levels occur after 48 h of a game and persist for 42–72 h [8,15]. Thus, we speculate that there is an overlap of the individual training effects, which increases the predictive error of the model. This consideration combined with repeated bout effect-induced adaptation and highlighted the limitation of parametric, linear analyses when modelling complex, dynamic phenomena.
The use of GPS to predict muscle damage could be of use to coaches and practitioners to control the training workload. The relationship between training workload and injury risk has been widely studied in the sports science literature [40,41]. Thefindings may be important for conditioning professionals. For example, [CK] cut-off value-based recovery strategies can be quickly established (practitioners can establish group and individual predictions during the season from the best external load metrics) through specific predictive GPS-derived indices such as the number of accelerations and decelerations. This predictive strategy may be an additional method for decision-making and monitoring directions for profiling the fatigue and recovery process of athletes. These new findings can serve as examples of the predictive usefulness of commonly used wearable tracking devices every day and thereby establish strategies to monitor performance, fatigue and recovery.
Conflict of interest: The authors have no professional relationships with any company or manufacturer who would benefit from the current study results.
Funding:Prepared with the professional support of the doctoral student scholarship program of the co-operative doctoral program of the Ministry of Innovation and Technology financed from the National research, Development and Innovation fund.
Physiology International108 (2021) 3, 371–382 379
Data availability:The datasets used and/or analysed during the current study are available from the corresponding author on reasonable request. Please contact the authors for data requests.
ACKNOWLEDGEMENTS
We would like to thank all the staff of Ferencvarosi TC involved in this study.
REFERENCES
1. Bloomfield J, Polman R, O’Donoghue P. Physical demands of different positions in FA Premier League soccer.
J Sport Sci Med 2007; 6(1): 63–70.
2. Bangsbo J, Iaia FM, Krustrup P. Metabolic response and fatigue in soccer. Int J Sports Physiol Perform 2007;
2(2): 111–27.
3. Stølen T, Chamari K, Castagna C, Wisløff U. Physiology of soccer: an update. Sport Med 2005; 35(6): 501–36.
4. Barnes C, Archer DT, Hogg B, Bush M, Bradley PS. The evolution of physical and technical performance parameters in the English premier league. Int J Sports Med 2014; 35(13): 1095–100.
5. Bush M, Barnes C, Archer DT, Hogg B, Bradley PS. Evolution of match performance parameters for various playing positions in the English Premier League. Hum Mov Sci 2015; 39: 1–11.
6. Bradley PS, Archer DT, Hogg B, Schuth G, Bush M, Carling C, et al. Tier-specific evolution of match per- formance characteristics in the English Premier League: it’s getting tougher at the top. J Sports Sci 2016;
34(10): 980–7.
7. Howatson G, Milak A. Exercise-induced muscle damage following a bout of sport specific repeated sprints.
J Strength Cond Res 2009; 23(8): 2419–24.
8. Ispirlidis I, Fatouros IG, Jamurtas AZ, Nikolaidis MG, Michailidis I, Douroudos I, et al. Time-course of changes in inflammatory and performance responses following a soccer game. Clin J Sport Med 2008; 18(5):
423–31.
9. Baird MF, Graham SM, Baker JS, Bickerstaff GF. Creatine-kinase- and exercise-related muscle damage implications for muscle performance and recovery. J Nutr Metab 2012; 2012: 960363.
10. Brancaccio P, Maffulli N, Limongelli FM. Creatine kinase monitoring in sport medicine. Br Med Bull 2007;
81–82: 209–30.
11. Brancaccio P, Lippi G, Maffulli N. Biochemical markers of muscular damage. Clin Chem Lab Med 2010;
48(6): 757–67.
12. Hortobagyi T, Denahan T. Variability in creatine kinase: methodological, exercise, and clinically related factors. Int J Sports Med 1989; 10(2): 69–80.
13. Thorpe R, Sunderland C. Muscle damage, endocrine, and immune marker response to a soccer match.
J Strength Cond Res 2012; 26(10): 2783–90.
14. Lazarim FL, Antunes-Neto JMF, da Silva FOC, Nunes LAS, Bassini-Cameron A, Cameron LC, et al. The upper values of plasma creatine kinase of professional soccer players during the Brazilian National Cham- pionship. J Sci Med Sport 2009; 12(1): 85–90.
15. Ascens~ao A, Rebelo A, Oliveira E, Marques F, Pereira L, Magalh~aes J. Biochemical impact of a soccer match - analysis of oxidative stress and muscle damage markers throughout recovery. Clin Biochem 2008; 41(10–11):
841–51.
380 Physiology International108 (2021) 3, 371–382
16. Rampinini E, Bosio A, Ferraresi I, Petruolo A, Morelli A, Sassi A. Match-related fatigue in soccer players. Med Sci Sports Exerc 2011; 43(11): 2161–70.
17. Andersson H, Raastad T, Nilsson J, Paulsen G, Garthe I, Kadi F. Neuromuscular fatigue and recovery in elite female soccer: effects of active recovery. Med Sci Sports Exerc 2008; 40(2): 372–80.
18. Thornton HR, Nelson AR, Delaney JA, Serpiello FR, Duthie GM. Interunit reliability and effect of data- processing methods of global positioning systems. Int J Sports Physiol Perform 2019; 14(4): 432–8.
19. Roe G, Darrall-Jones J, Black C, Shaw W, Till K, Jones B. Validity of 10-Hz GPS and timing gates for assessing maximum velocity in professional rugby union players. Int J Sports Physiol Perform 2017; 12(6): 836–9.
20. Nicolella DP, Torres-Ronda L, Saylor KJ, Schelling X. Validity and reliability of an accelerometer-based player tracking device. PLoS One 2018; 13(2): e0191823.
21. Malone JJ, Lovell R, Varley MC, Coutts AJ. Unpacking the black box: applications and considerations for using gps devices in sport. Int J Sports Physiol Perform 2017; 12(Suppl. 2): S218–26.
22. Young WB, Hepner J, Robbins DW. Movement demands in Australian Rules football as indicators of muscle damage. J Strength Cond Res 2012; 26(2): 492–6.
23. Gastin PB, Hunkin SL, Fahrner B, Robertson S. Deceleration, acceleration, and impacts are strong contrib- utors to muscle damage in professional Australian football. J Strength Cond Res 2019; 33(12): 3374–83.
24. Di Salvo V, Gregson W, Atkinson G, Tordoff P, Drust B. Analysis of high intensity activity in premier league soccer. Int J Sports Med 2009; 30(3): 205–12.
25. Varley MC, Gregson W, McMillan K, Bonanno D, Stafford K, Modonutti M, et al. Physical and technical performance of elite youth soccer players during international tournaments: influence of playing position and team success and opponent quality. Sci Med Footb 2017; 1(1): 18–29.
26. Schuth G, Carr G, Barnes C, Carling C, Bradley PS. Positional interchanges influence the physical and technical match performance variables of elite soccer players. J Sports Sci 2016; 34(6): 501–8.
27. R development core team 3.0.1. A language and environment for statistical computing. R Found Stat Comput;
2013.
28. Halekoh U, Højsgaard S, Yan J. The R package geepack for generalized estimating equations. J Stat Softw 2006.
29. Newham DJ, Jones DA, Edwards RHT. Large delayed plasma creatine kinase changes after stepping exercise.
Muscle Nerve 1983; 6(5): 380–5.
30. Nosaka K, Newton M. Concentric or eccentric training effect on eccentric exercise-induced muscle damage.
Med Sci Sports Exerc 2002; 34(1): 63–9.
31. Pagana KD, Pagan TJ. Manual of diagnostic and laboratory tests. Elsevier; 2018.
32. Chen TC, Nosaka K. Responses of elbowflexors to two strenuous eccentric exercise bouts separated by three days. J Strength Cond Res 2006; 20(1): 108–16.
33. Nosaka K, Newton M. Repeated eccentric exercise bouts do not exacerbate muscle damage and repair. J Strength Cond Res 2002; 16(1): 117–22.
34. Nosaka K, Newton M. Is recovery from muscle damage retarded by a subsequent bout of eccentric exercise inducing larger decreases in force? J Sci Med Sport 2002; 5(3): 204–18.
35. Hecksteden A, Pitsch W, Julian R, Pfeiffer M, Kellmann M, Ferrauti A, et al. A new method to individualize monitoring of muscle recovery in athletes. Int J Sports Physiol Perform 2017; 12(9): 1137–42.
36. Prelle A, Tancredi L, Sciacco M, Chiveri L, Comi GP, Battistel A, et al. Retrospective study of a large pop- ulation of patients with asymptomatic or minimally symptomatic raised serum creatine kinase levels. J Neurol 2002; 249(3): 305–11.
37. Hartmann U, Mester J. Training and overtraining markers in selected sport events. Med Sci Sports Exerc 2000; 32(1): 209.
Physiology International108 (2021) 3, 371–382 381
38. Bourdon PC, Cardinale M, Murray A, Gastin P, Kellmann M, Varley MC, et al. Monitoring athlete training loads: consensus statement. Int J Sports Physiol Perform 2017; 12(Suppl. 2): S2161–70.
39. De Oliveira DCX, Frisselli A, De Souza EG, Stanganelli LCR, Deminice R. Venous versus capillary sampling for total creatine kinase assay: effects of a simulated football match. PLoS One 2018; 13(9).
40. Gabbett TJ, Ullah S. Relationship between running loads and soft-tissue injury in elite team sport athletes. J Strength Cond Res 2012; 26(4): 953–60.
41. Gabbett TJ. The development and application of an injury prediction model for noncontact, soft-tissue in- juries in elite collision sport athletes. J Strength Cond Res 2010; 24(10): 2593–603.
Open Access. This is an open-access article distributed under the terms of the Creative Commons Attribution 4.0 International License (https://creativecommons.org/licenses/by/4.0/), which permits unrestricted use, distribution, and reproduction in any medium, provided the original author and source are credited, a link to the CC License is provided, and changes–if any–are indicated. (SID_1)
382 Physiology International108 (2021) 3, 371–382