559
1) E. N. Harvey, Plant Physiol. 3, 85 [1928].
2
) E. N. Harvey, Biol. Bull. W o o d ' s Hole 29, 308 [1915].
3
) F. H. Johnson, H. Eyring and R. W. Williams, J. cellular comp. Physiol. 20, 247 [1942].
4
) B. L. Strehler and / . R. Totter, Arch. Biochem. Biophysics 40, 28 [1952].
s) W. D. McElroy, Proc. nat. Acad. Sci. U S A 33, 342 [1947].
6) W. D. McElroy and B. L. Strehler, Arch. Biochem. Biophysics 22, 420 [1949].
7) W. D. McElroy and / . Coulombre, J. cellular c o m p . Physiol. 39, 475 [1951].
8
) /. W. Hastings and W. D. McElroy in F. H. Johnson: The Luminescence of Biological Systems.
Amer. A s s o c . A d v . Sci., Washington, D . C. 1955, p. 257.
9
) W. D. McElroy and A. Green in O. H. Gaebler: Enzymes, Units of Biological Structure and Func
tion. Academic Press, N e w York 1956, p. 369.
1Q
) B. L. Strehler and / . R. Totter in D. Glick: Methods of Biochemical Analysis. Interscience Publi
shers, N e w York 1954, Vol. I, p. 341.
u
> B. L. Strehler and W. D. McElroy in S. P. Colowick and N. O. Kaplan: Methods in Enzymology.
Academic Press, N e w York 1957, Vol. I l l , p. 871.
12
) B. L. Strehler in W. D. McElroy and H. B. Glass: Phosphorus Symposium. The Johns Hopkins Press Baltimore, Md. 1952, Vol. II, p. 491.
13
) R. Grenell in H. E. Himwich: Tranquilizing Drugs. Amer. Assoc. Adv. Sci., Washington, D . C.
1957, Publ. N o . 46, p. 61.
14
) D. Billen, B. L. Strehler, G. E. Stapleton and E. Brigham, Arch. Biochem. Biophysics 43, 1 [1953].
15
) F. D. Carlson and A. Siger, J. gen. Physiol. 43, 301 [1959].
16
) L. B. Nanninga and W. F. H. M. Mommaerts, Proc. nat. Acad. Sci. U S A 46, 1155 [I960].
Adenosines-triphosphate and Creatine Phosphate
Determination with Luciferase
Bernard L. Strehler
Bioluminescence was first used as an indicator of metabolic activity by E. N. Harvey
1
). H e used luminous bacteria (Achromobacter fischer'i) to detect the photosynthetic oxygen production of* Elodea leaves by immersing the leaves in a thick suspension of the bacteria. Harvey and his collaborators also used the inhibition or stimulation o f luminescence to study the effect of narcotics, respiratory inhib
itors and pressure on enzymes and enzyme systems
2
»
3
>. The first application of bioluminescent reactions in vitro to determine important metabolic intermediates was described by Strehler and Totter
4
) in 1952. They used extracts of the luminous organ of the firefly, Photinus pyralis, to assay adenosine triphosphate (ATP) and a number of metabolically related substrates and enzymes. The method was based upon the earlier discovery by McElroy
5
) that aqueous extracts of firefly lanterns which were no longer luminous emitted light once again on the addition of A T P . McElroy and Strehler^) then showed that, in addition to the enzyme, A T P and oxygen, two other components were necessary for the emission of light: a divalent cation (e.g. M g
+ +
, M n
+ +
, F e
+ +
, C o
+ +
, Z n
+ +
) and a fluorescent c o m p o u n d called luciferin. During the intervening years, McElroy et al.
7 _ 9
) have contrib
uted much to the understanding of the mechanism of firefly bioluminescence. Strehler and Totter
10
) and Strehler and McElroy
11
) have published reviews of this method of analysis and its applications.
The determination of A T P with luciferase, because of its specificity and sensitivity, has been used for studies o n p h o t o s y n t h e s i s
1 2
) , neural f u n c t i o n
1 3
) , radiation effects
1 4
), oxidative phosphorylation
4
) and muscle biochemistry
1 5
*
1 6
). Luciferase preparations are available commercially. The quantitative determination of A T P and creatine phosphate is described here. Assay methods for related substrates (e.g. mixtures o f A T P , A D P , A M P and creatine phosphate) and enzymes (myokinase, hexokinase, apyrase, creatine kinase) can be found in the original papers of Strehler and Totter
4
»
1Q
).
Principle
Luciferase in the presence of luciferin, oxygen, magnesium and adenosine triphosphate (ATP) catalyses the formation of adenyl-luciferin from A T P and luciferin. Adenyl-luciferin is oxidized by atmospheric oxygen to adenyl-oxyluciferin and this process is accompanied by emission of light.
Mg++
(1) A T P + luciferin ^ * adenyl-luciferin + pyrophosphate enzyme
o
2
(2) Adenyl-luciferin > adenyl-oxyluciferin + H
2
0 + lightReaction (1) is reversible and the equilibrium lies far to the right. Reaction (2) is practically irrever
sible, and its product, adenyl-oxyluciferin, is a potent inhibitor of the luminescent reaction.
Fig. 1. The relationship between light intensity and A T P concentra
tion. Light production measured with a quantum counter.
Abscissa:
A T P concentration [[ig.~P/5 ml.].
1 (i.g.~P is equivalent to 8.15 pig.
A T P .
The
Michaelisconstant for ATP is 5
x10~
5
M at pH 7.4. At ATP concentrations which are a little below the
Michaelishalf saturation value, the rate of the over-all reaction is propor
tional to the ATP concentration. In the presence of ATP the reaction reaches its maximum rate almost immediately and then decreases essentially as a first order process with time as
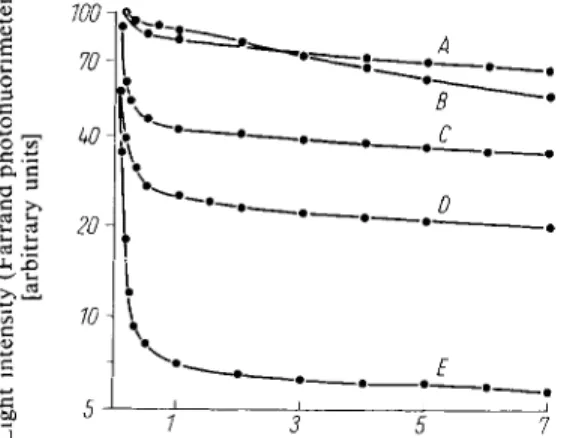
Fig. 2. Time course of the luminescence in the presence of various buffers (pH 7.4).
Curve A : succinate + 0.02 M phosphate Curve B : succinate + 0.0125 M arsenate Curve C: succinate + 0.01 M phosphate Curve D : succinate + 0.005 M arsenate Curve E : succinate buffer
Abscissa:
Time after mixing luciferase and A T P solu
tions [min.]
ATP is consumed or as inhibitors accumulate. The determination of ATP therefore involves the measurement of the relative intensity of the light emitted by a luciferase solution within a few seconds after the addition of an ATP solution (in the presence of adequate amounts of M g
+ +
, oxygen and luciferin).
V.2.g
Adenosine-5'-triphosphate and Creatine Phosphate 561The proportionality between the light intensity and the ATP concentration is shown in Figure 1. The time course of luminescence in the presence of various buffers is shown in Figure 2.
Since the intensity of the emitted light is proportional to the A T P concentration under defined conditions, with the m e t h o d described here it is also possible to determine any substance which affects the A T P concentration. By addition of the appropriate coupling enzymes or enzyme systems the following substances can be determined: A D P , A M P , creatine phosphate and glucose. In the same way the activity of the following enzymes or enzyme systems can be assayed: hexokinase, myokinase, various ATPases or apyrases and A T P synthesizing systems such as phosphorylating mitochondria
4
) or phosphorylating chloroplasts
17
h
Apparatus
The sensitivity of the method depends on the sensitivity of the instrument used for the measurement of the light. These light measuring devices consist of the following essential parts: a lightproof housing for the photomultiplier; a lightproof sample chamber; a shutter between the t w o ; a photo- multiplier; a stablized high voltage supply and an instrument for measuring the amount of current flowing through the photomultiplier.
For routine assays of A T P concentrations o f the order o f 1 (i,g./ml. the Farrand fluorimeter*) or a modified A m i n c o photometer **) are suitable. The use of a quantum counter, which counts indi
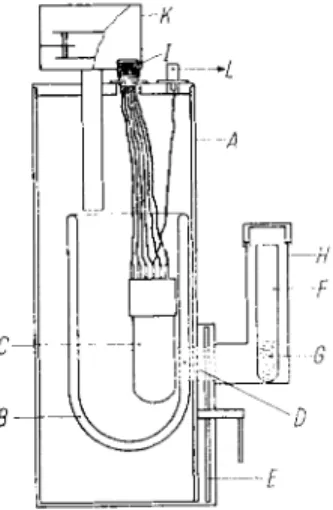
vidual photoelectrons, increases the sensitivity by a factor of 100 to 1000. The essential component of this counter is a photomultiplier which is immersed in a Dewar flask containing liquid nitrogen (see Fig. 3).
Fig. 3. Quantum counter (for details, see Text).
A : Lightproof housing for the photomultiplier B : Dewar flask containing liquid nitrogen C : Photomultiplier
D : Unsilvered window in the Dewar flask E : Shutter
F : Test tube G : Sample
I H : Lightproof housing for the sample I: H i g h voltage source
K : Lightproof filling device for liquid nitrogen L: T o the counter
The light reaches the photosensitive surface of the photomultiplier through an unsilvered window in the D e w a r flask. Operation at the temperature of liquid nitrogen has the advantage of a much lower rate of emission of thermal electrons from the photocathode and dynodes than occurs at room temperature. Thus the background counting rate is reduced. The single photo-electron pulses, after amplification, consist of about a million electrons which arrive practically simultaneously at the anode. These pulses last for less than a micro-second. Each impulse is then amplified by a linear
*) Manufacturer: Farrand Optical Co., Inc., N e w York 70, N . Y., U S A .
**) Manufacturer: American Instrument Co., Silver Spring, U S A . Md., U S A .
1?
) B. L. Strehler and D. D. Hendley in W. D. McElroy and H. B. Glass: Symposium on Light and Life.
The Johns Hopkins Press, Baltimore, Md. 1961, p. 601.
amplifier, for example, an A1A preamplifier-Al amplifier combination. Such amplifiers, which were primarily developed for scintillation counting, are available commercially from the Radiation Counter Laboratories, Chicago, U S A . They can be used for the counting of individual light quanta without major changes.
After amplification the impulse passes through a discriminator which discards all pulses which have too low an amplitude and therefore did not originate from the photocathode of the photomultiplier.
The pulses passed by the discriminator are given a uniform size and are directed to the output terminal of the A l amplifier. They are then counted with a scaler which gives counts per unit time, or an inte
grator may be used which gives a D C voltage proportional to the counting rate. This voltage may then be employed to drive a recorder.
A recorder is particularly useful when the time course of very low levels of luminescence have to be measured (e.g. A T P formation as a result of the action of physical or chemical factors on biological material, e.g. illumination of luciferase-chloroplast mixtures). A quantum counting photometer with a simple recorder costs about $ 2500. Of particular importance in the design of such an instrument
H J K L
A B C DE F S
M 0
1
o o i
N
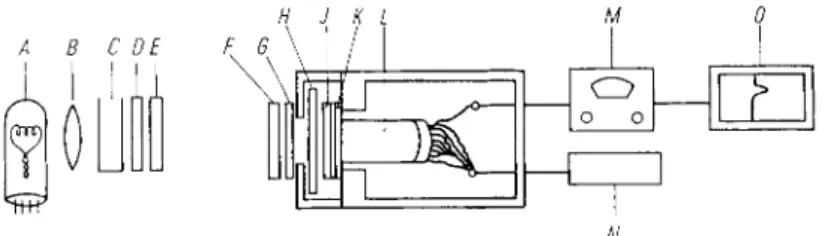
Fig. 4. Apparatus for the continual measurement of the A T P concentration in illuminated chloro- plasts
H : Sample cuvette (light path: 2 mm.) J: Corning filter N o . 9782
K : Wratten filter N o . 65 L: Photomultiplier M : A m i n c o photometer
N : High voltage source (Baird A t o m i c Model 312) O: Recorder
A : Tungsten filament lamp B: Condensing lens C: Water (heat filter) D : Wratten filter N o . 25
E: Wratten filter N o . 26 F : Wratten filter N o . 29 G: Corning filter N o . 2408
Fig. 5. A simple housing for photomultiplier and sample A : Lightproof w o o d e n housing
B: Photomultiplier (inserted into a hole in the top of the hous
ing in such a way that light is excluded) C: Tube mounted rigidly in the top of the housing
D : Rotatable, but lightproof tube inserted in tube C (container for the test tube with sample)
E: Opening in tube C F: Opening in tube D
G : Handle for rotatable tube D H : Lightproof cap for tube D
The tubes C and D with their openings E and F form the equi
valent of a shutter, which is opened and closed by rotation of tube D .
0 4 8 12 1620 cm
is the complete protection of the photomultiplier from external light, either during the measurements or during the introduction of the sample. If light falls on the photomultiplier during the changing of the sample it may yield some low level phosphorescence which can give false results or may even damage the photomultiplier. With a properly constructed housing the background counting rate with a cooled 1P21 or 1P22 photomultiplier is three or four impulses/min. The use of the more expensive
V.2.g
Adenosine-5'-triphosphate and Creatine Phosphate 563 1P21 photomultiplier has no appreciable advantage over the m u c h less expensive 1P22, since both tubes have practically no dark current at the temperature of liquid nitrogen. For further details of the construction and applications of a quantum counter, s e e1 8
.
1 9
) . A relatively simple apparatus
1 7
> for the continuous measurement o f the A T P concentration in chloro- plasts is illustrated in Figure 4. A n easily constructed adaptation of the A m i n c o photometer suitable for the routine assay of microgram quantities of A T P is shown in Figure 5.
A) Determination of Adenosines-triphosphate
Reagents
1. Adenosine triphosphate, ATP
crystalline sodium salt, ATP-Na2H2-3 H2O; commercial preparation, see p. 1006.
2. Luciferase
In most cases it is not necessary to use a highly purified preparation. For methods of preparing the enzyme, see " A p p e n d i x " , p. 572.
For other reagents, see the sections "Experimental material" (p. 564), "Enzymatic reaction"
(p. 564, 565) and "Appendix" (p. 570).
Preparation of Solutions
Use distilled water free from heavy metal ions.
I. ATP standard solution
a) Stock solution (1.6 x 10r* M):
Dissolve 25 mg. ATP-Na 2 H 2 • 3 H 2 0 in 250 ml. distilled water. Store the solution frozen at - 2 0 ° C.
b) Dilute solution (1.6 x 10~6 M):
Dilute 5 ml. solution a) to 500 ml. with distilled water. Store the solution between 0 and 4°C and prepare freshly each day. For the determination of purity, see" Appen
dix", p. 570.
II. Luciferase
Solutions, see "Appendix", p. 572.
For other solutions, see the sections "Enzymatic reaction" (p. 565) and "Appendix" (p. 572).
Stability of the solutions
The stability of dilute A T P solutions is variable, even at — 20° C. Therefore prepare the standard A T P solution freshly each day. The luciferase preparations prepared according to p. 572 keep for a year at - 2 0 ° C .
Procedure
Experimental material
Because of its inhibitory and denaturing action on enzymes trichloroacetic acid is not suitable for the extraction of ATP. In many cases, especially with highly dispersed suspensions (tissue cultures, blood, bacteria, algae, mitochondria, etc.) it is sufficient to heat the samples
18) B. L. Strehler, Arch. Biochem. Biophysics 34, 239 [1951].
19) W. E. Arthur and B. L. Strehler, Arch. Biochem. Biophysics 70, 507 [1957].
at 100°C for between 5 and 15 min. (boiling water bath). However, it is important that the samples are brought as quickly as possible to 100°C so that enzymatic degradation of sub
strates in the sample during the heat inactivation of the proteins is avoided. It is preferable to inject the sample into two or three volumes of boiling water. Immediately after heating, transfer the sample to an ice bath or deep-freeze and store there until the assay.
Before using this method for the extraction of ATP it should be compared with other proce
dures to see if similar results are obtained. In studies on the effect of light on photosynthetic phosphorylation in green algae, heating the sample at 100°C for 10 — 15 min. was found to be sufficient to extract all the ATP. For larger, and especially for solid samples this simple extraction by heating is obviously not sufficient.
Tissues which contain high concentrations of enzymes capable of reacting with ATP require special treatment.
Carlson2
®
has developed a procedure for the analysis of ATP in muscle:
freeze the tissue sample in dry ice-petroleum ether, grind in a cold mortar with frozen 8 % perchloric acid (1 ml. perchloric acid/100 mg. muscle). Thaw the mixture and then allow to stand for 10 to 15 min. at 0°C. Filter, neutralize the filtrate with 1 N NaOH or KOH and dilute to 25 ml. with distilled water. The solution can be stored at — 20° C.
In certain cases, for example, in the assay of ATP in chloroplasts, extraction is not necessary.
Usually the samples need not be deproteinized. The luciferase preparation is contaminated with appreciable quantities of myokinase, pyrophosphatase and a p y r a s e
8 9 )
. If the sample contains light-scattering or absorbing particles (chloroplasts, mitochondria, suspended lipids), a known amount of ATP should be added to the reaction mixture after the deter
mination of the ATP contained in the sample. The experimental results are then related to this internal standard.
Enzymatic reaction
Preliminary remarks:
Four methods for the determination of ATP are described below. They are based on two principles: 1. The sample containing ATP is rapidly injected into the luci
ferase solution. The maximum light intensity observed is a measure of the ATP concentration.
However, the maximum intensity depends on the rate at which the sample and enzyme are mixed and also on the presence of ADP. 2. The rapid decay of luminescence is retarded by use of a high concentration of arsenate (or phosphate) and magnesium in the assay mixture
4
*.
The ATP concentration is obtained by extrapolation of the light intensity to zero time. Also with this method, the sample and enzyme must be mixed rapidly and in a reproducible manner.
Method:
a) If a Farrand fluorimeter is available, proceed as follows:
dilute
0.2 ml. luciferase solution (preparation a, p. 572)
to 0.6 ml. with distilled water. Immediately before the measurements add 0.2 ml. of sample,
mix rapidly and measure the light intensity at 5, 10, 15, 20, 25 and 30 sec. after mixing in the sample.
2
°) F. Carlson, personal communication.
V.2.g Adenosine-5'-triphosphate and Creatine Phosphate 565
b) If a quantum counter is available, proceed as follows:
dilute the
luciferase solution (preparation b, p. 572) five-fold with arsenate-magnesium buffer*).
Add l
ls volume of sample and proceed as described under a).
c) According to McElroy
2i) mix
0.1 ml. luciferase solution (preparation c, p. 572) with
2.1 ml. glycylglycine-magnesium buffer**).
Place the solution in the instrument in front of the photomultiplier. With a 0.25 ml. syringe rapidly inject
0.2 ml. sample
and proceed as described under a).
d) For continuous measurement of the ATP concentration in chloroplast preparations 1 7
) proceed as follows:
Prepare the luciferase solution according to procedure a) (p. 572), but use phosphate buffer without adding MgS04.
Mix the following solutions:
0.2 ml. luciferase solution 1.4 ml. suspension medium +) 0.1 ml. PMS solution ++) 0.1 ml. AMP solution®).
Add to this mixture in subdued light
0.2 ml. chloroplast suspension (about 700 [ig. chloroplasts/ml. suspension).
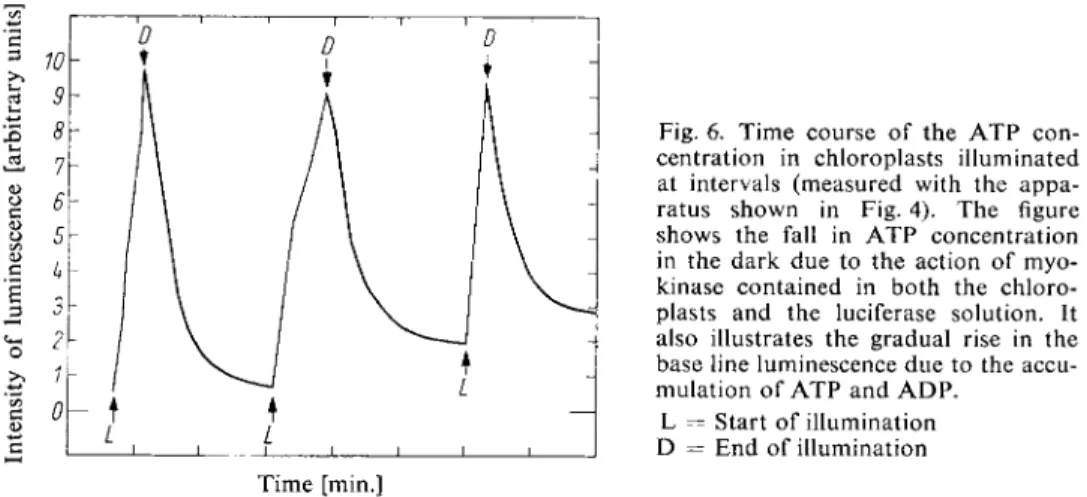
Pour the mixture into a cuvette (2 mm. light path) and place in the apparatus shown in Fig. 4. The result of a typical experiment is illustrated in Fig. 6.
*) Arsenate-magnesium buffer (0.1 M arsenate: 0.05 M M g
2 +
; pH 7.4): Dissolve 42.5 g. N a 3 A s 0 . r 12 H
2
0 and 10 g. M g C l2
- 6 H2
0 in 500 ml. distilled water, adjust to pH 7.4 with 1 N HC1 and dilute to 1 000 ml. with distilled water.**) Glycylglycine-magnesium buffer (0.025 M glycylglycine; 0.1 M M g
2 +
; pH 7.5):
Dissolve 1.65 g. glycylglycine and 12.3 g. M g S 0 4 - 7 H
2
0 in 400 ml. distilled water, adjust to pH 7.5 with 1 N N a O H and dilute to 500 ml. with distilled water.4)
Suspension medium:
Dissolve 0.139 g. K
2
H P 04
, 0.495 g. NaCl, and 0.341 g. M g C l2
- 6 H2
0 in distilled water, add 95 ml. 0.1 M tris buffer (pH 8.0) and make up to 500 ml. with distilled water.Tris buffer (0.1 M ; pH 8.0):
Dissolve 6.05 g. tris-hydroxymethyl-aminomethane in 400 ml. distilled water, adjust to pH 8.0 with 30 ml. 1.0 N HCl and dilute to 500 ml. with distilled water.
+ +
) Phenazine methosulphate, PMS (5 X 10~4 M ) : Dissolve 0.145 g. PMS in 1000 ml. distilled water.
e)
Adenosine monophosphate, A M P (2x 10~
2
M ) : Dissolve 1.03 g. A M P - N a
2
in 125 ml. distilled water.21
) W. D. McEIroy, unpublished.
Calculations
Since the luminescence obtained with luciferase is directly proportional to the A T P concentration (in the physiological concentration range), the light intensity produced by the sample is compared to that produced by a standard. It is advisable to construct a standard curve to check whether the relationship between the luminescence and the A T P concentration is linear.
c S
O
>»
'55 C o c
Fig. 6. Time course of the A T P con
centration in chloroplasts illuminated at intervals (measured with the appa
ratus shown in Fig. 4). The figure shows the fall in A T P concentration in the dark due to the action of myo
kinase contained in both the chloro
plasts and the luciferase solution. It also illustrates the gradual rise in the base line luminescence due to the accu
mulation of A T P and A D P . L = Start of illumination D = End of illumination Time [min.]
Example
A T P synthesis in Chlorella pyrenoidosa
21
\ The reaction mixture prepared according to method a) contained 2 mg. algae (wet weight). The following values were measured:
Duration of illumination [sec] Luminescence [counts/15 s e c ] 0 1052 10
20
30 2311 60 2091
1362 A
20
= 1410 counts/15 sec.2462
A
20
duration of illumination 1410
20 70 counts/15 s e c / s e c illumination 0.152 [jig. ~ P*) gave A
{
= 5000 counts/15 s e c Therefore:7
° *
Q
qq5 2
= ° -
0 0 2
~ P*Vsec. illu
mination was synthesized in the reaction mixture. This contained 2 mg. ( = 2 0 0 0 algae (wet weight). Therefore the algae synthesized 10~
6
times**) their weight of A T P .
Other Determinations
Adenosine diphosphate ( A D P ) : First determine the A T P content of the sample as described above.
Then convert the A T P to A D P with A T P a s e prepared from crayfish muscle according to Lohmann
23
>.
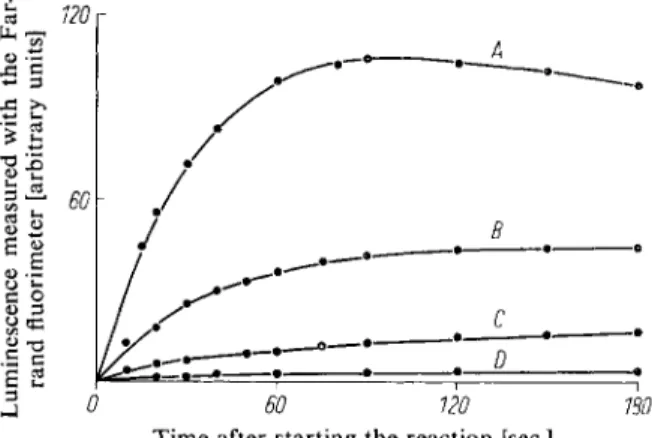
Boil the reaction mixture for 5 to 10 min., and determine the total A D P (ATP + A D P ) as described for A T P . The luciferase preparation contains myokinase which converts A D P to A T P . Obtain the A D P content by comparison with a standard curve. The time course of the luminescence with A D P is illustrated in Fig. 7.
*) 1 [xg. ~ p is equivalent to 8.15 jxg. A T P 0.002 2 X 10-3
= 10 6 2000 2 x 10³
22) B.L. Strehler, Arch. Biochem. Biophysics 43, 67 [1953].
23) K. Lohmann, Biochem. Z. 282, 109 [1935].
V.2.g Adenosine-5'-triphosphate and Creatine Phosphate 567
Specificity
The reaction is specific for A T P , although substances which can alter the concentration of A T P available to the luciferase affect the luminescence. A D P in the absence of myokinase, creatine phos
phate in the absence of creatine kinase, adenosine tetraphosphate, inosine triphosphate, cytidine triphosphate, uridine triphosphate, acetyl phosphate and other phosphorylated intermediates do not react.
Fig. 7. The time course of the luminescence in the A D P assay.
The reaction mixture (0.8 ml.) contained: 0.2 ml. luciferase solu
tion (preparation b), p. 572;
- • 0.2 ml. arsenate buffer (0.1 M ; p H 7 . 4 ; 0.05 M M g S 0
4
) a n d A D P : curve A : 0.650 u m o l e s ; curve B:- • 0.260 [jimoles; curve C : 0.130 [xmoles; curve D : 0.065 u.moles.
Sources of Error
Possible sources of error are:
1. Precipitation of buffer, enzyme or activator.
2. Depletion of oxygen due to respiratory activity of the sample or the luciferase.
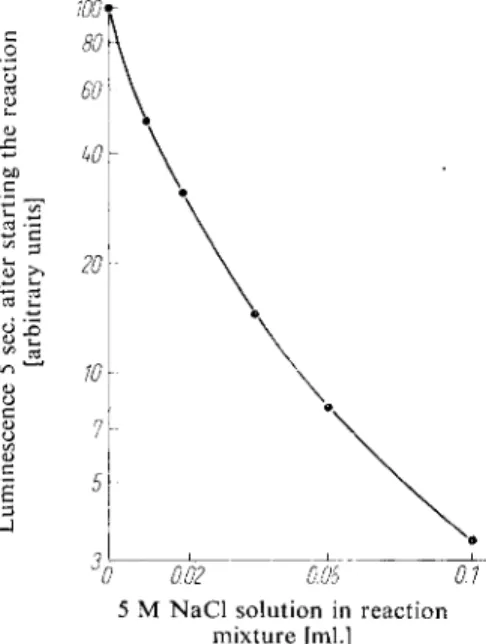
3. Quenching of luminescence by monovalent anions, turbidity, absorption or natural inhibitors (see Fig. 8).
4. Utilization of A T P by side reactions or binding of A T P at inactive sites
9
> (high concentrations of arsenate buffer decrease this error).
5. Luminescent or phosphorescent impurities
2 4
).
6. Presence of a m m o n i u m ions in photosynthetic phosphorylation test systems.
7. Hydrolytic enzymes in the sample. This source of error can be obviated if the samples are depro
teinized with perchloric acid.
8. Injection of the sample into the reaction mixture without proper protection from light; damage to the photomultiplier by over-exposure to light; faulty performance of the instrument, leading to non-linear response.
Nearly all such sources of error can be eliminated or corrected by use of internal standards (see p. 35) or standard curves.
Other Methods of Determination
Other methods for the estimation of A T P can be found on pages 539, 543 and 551. The ion exchange method of Cohn and Carter
2
^ which is described in the " A p p e n d i x " (p. 570) is also useful. However,
24
> B. L. Strehler and W.A.Arnold, J. gen. Physiol. 34, 809 [1951].
2
5) W. E. Cohn and C. E. Carter, J. Amer. chem. Soc. 72, 4273 [1950].
0 60 120 Time after starting the reaction [sec]
the most sensitive appears to be the determination of A T P with luciferase, especially if a quantum counter is available. It has the advantages of being rapid and simple and it permits the continual measurement of A T P concentration in certain systems.
Fig. 8. Effect of chloride ions on the inten
sity of the luminescence. The reaction mix
ture (0.8 ml.) contained 0.2 ml. luciferase (preparation b, p. 572); 0.2 ml. A T P solu
tion containing 250 pig. ~ P/ml. *); 0.2 ml.
0.1 M arsenate buffer (pH 7.4); 2 mg.
M g S 0
4
and the amounts of 5 M NaCl solution stated on the abscissa.]
0 0.02 0.06 01 5 M N a C l solution in reaction
mixture [ml.]
B) Determination of Creatine Phosphate
Reagents
See under A (p. 563). In addition:
3. Creatine phosphate
sodium salt; commercial preparation, see p. 1008.
4. Adenosine monophosphate, AMP
sodium salt, AMP-Na2; commercial preparation, see p. 1005.
5. Sodium arsenate, Na3AsC>4-12 H2O 6. Creatine kinase
lyophilized powder from m u s c l e
2 6
) ; commercial preparation, see p. 973.
Preparation of Solutions
See under A (p. 563). In addition:
III. Creatine phosphate standard solution ( 1 0 -4
M):
Dissolve 1 mg. creatine phosphate (Na salt) in 5 ml. distilled water. Prepare freshly each day. For the determination of the content of the solution, see "Appendix", p. 571 and 610.
IV. Adenosine monophosphate ( 2x 10~
2
M AMP):
Dissolve 40 mg. AMP-Na2 in 5 ml. distilled water.
*) 1 pig. ~ P corresponds to 16 mumoles ATP.
26) K.Lohmann, Biochem. Z. 271, 264 [1934].
V.2.g A d e n o s i n e s - t r i p h o s p h a t e and Creatine Phosphate 569
V. Sodium arsenate (0.1 M; pH 7.4):
Dissolve 42.5 g. Na 3 As0 4 -12 H 2 0 in 500 ml. distilled water, adjust to pH 7.4 with 1 N HC1 and dilute to 1000 ml. with distilled water.
VI. Creatine kinase, CPK:
Dissolve the CPK preparation in sufficient distilled water so that the intensity of the luminescence is readily measurable during the 10 — 30 sec. reaction time. Prepare the solution freshly each day.
Procedure
Enzymatic reaction
The following should be prepared: experimental tube, control tube without creatine kinase and AMP (especially if the sample contains much ATP and ADP*)), and a standard tube containing creatine phosphate standard solution (III) instead of the sample. A standard curve should also be prepared (see Fig. 10).
Pipette into a test tube:
0.20 ml. luciferase solution (preparation a, p. 572) 0.20 ml. sodium arsenate solution (V)
0.12 ml. AMP solution (IV) 0.01 ml. creatine kinase (VI) 0.02 to 0.2 ml. sample distilled water to 1.0 ml.
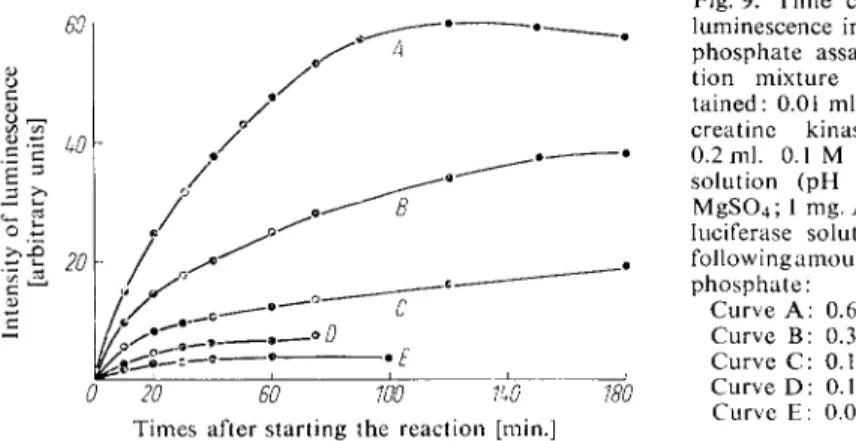
Mix thoroughly and read the luminescence every 10 sec. The time course of the luminescence is shown in Fig. 9.
Calculations
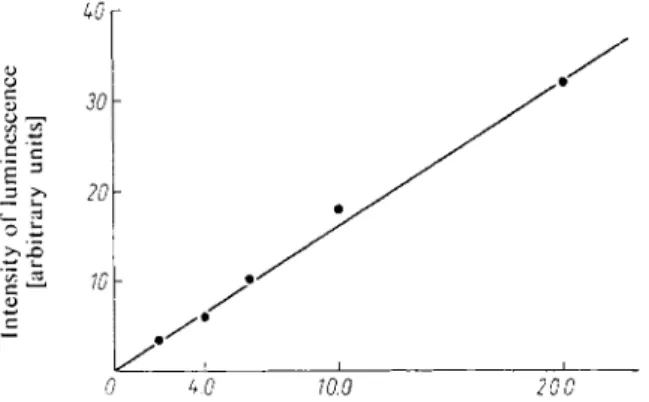
The creatine phosphate content of the sample is read off from a standard curve (see Fig. 10).
Sources of Error
See p. 567.
Fig. 9. Time course of the luminescence in the creatine phosphate assay. The reac
tion mixture (1 ml.) con
tained: 0.01 ml. of a crude creatine kinase solution;
0.2 ml. 0.1 M N a arsenate solution (pH 7.4); 10 mg.
M g S 0
4
; 1 mg. A M P ; 0.2 ml.luciferase solution and the following amounts of creatine phosphate:
Curve A : 0.664 [jimoles;
Curve B: 0.332 jxmoles;
Curve C: 0.199 pinoles;
Curve D : 0.132 [xmoles;
Times after starting the reaction [min.] Curve E: 0.0664 jimoles.
*) Alternatively, the A T P and A D P contained in the sample can be converted to A M P with ATPase (from crayfish
2 3
)) and myokinase, and then the ATPase is inactivated by boiling.
Other Methods of Determination
Creatine phosphate can also be determined by the method described in the " A p p e n d i x " (p. 571.) Another method can be found on p. 610.
4tf
30
20
• J £ 10
0 if.O 10.0 20.0 Creatine phosphate content of the assay mixture [ug.
Fig. 10. Relationship between lumines
cence (30 sec. after mixing) and creatine phosphate content. For constituents of the assay mixture see Legend to Fig. 9.
' P I
Appendix
Assay of the Purity of the ATP Standard Solutions 2 5 )
R e a g e n t s and S o l u t i o n s 1. D o w e x 1 ( N H
4
+
form), 2 0 0 - 4 0 0 mesh 2. Hydrochloric acid, 3 X 10~3 N ; 1 0
-2
N ; 1 N 3. A m m o n i u m chloride (0.01 M ) :
Dissolve 0.053 g. N H
4
C 1 in 100 ml. distilled water.4. Sodium chloride-HCl (0.02 M N a C l ; 10"
2
N HC1):
Dissolve 0.1169 g. N a C l in 100 ml. 10~
2
N HC1.
5. Sodium chloride-HCl (0.2 M N a C l ; 10~
2
N HC1):
Dissolve 1.169 g. N a C l in 100 ml. 1 0 '
2
N HC1.
Procedure
Suspend D o w e x 1 in distilled water, prepare a 1.5 cm. high column (ca. 1 cm. diameter) and convert the resin to the chloride form with ca. 50 ml. 1 N HC1. Wash the column with water until the washings are neutral. Adjust the p H of the A T P solution to 8 to 9 and pour the solution on the column *). Wash the column with ca. 50 ml. distilled water and then elute successively with 100 ml. of each of the following solutions: 0.01 M N H
4
C 1 (elutes adenosine and adenine); 3 x 10~3
N HC1 (elutes A M P and inorganic phosphate); 0.02 M N a C l in 10~
2
N HC1 (elutes A D P ) ; 0.2 M N a C l in 10~
2
N HC1 (elutes A T P ) * * ) .
Determine the adenine nucleotide content of the eluate by measurement of the optical density at 260 m u (pH 2). Under these conditions the molar extinction coefficient of adenosine and its phospho
rylated derivatives is about 14.2 X 1 0
6
c m
2
. / m o l e .
*) To ensure that all the nucleotides are adsorbed on the resin the anion concentration of the solution should not exceed 0.01 N .
**) According to Cohn (personal communication) the adenosine phosphates can also be separated by elution with 0.1 M N a 2 S 0
4
in 10~2
N H 2 S 0
4
, with 1.5 M ammonium formate or with 0.2 M ammonium formate in 4 M formic acid. These reagents are approximately as effective as 0.1 M N a C l in 10~2
N HC1 in eluting A T P from the column.
V.2.g A d e n o s i n e s - t r i p h o s p h a t e and Creatine Phosphate 571
Assay of the Purity of the Creatine Phosphate Solutions 2 7 )
R e a g e n t s and S o l u t i o n s 1. A m m o n i u m molybdate:
Dissolve 25 g. ( N H
4
)6
M o7
02 4
- 4 H2
0 in 500 ml. 10 N H2
S 04
and dilute to 1000 ml. with distilled water.2. Ferrous sulphate:
Dissolve 5 g. F e S 0
4
- 7 H2
0 in 50 ml. distilled water containing 1 ml. I N H2
S 04
. Prepare the solution freshly each day.3. Hydrochloric acid, 0.4 N . 4. Sodium hydroxide, 0.4 N 5. Sodium chloride, 0.4 M
6. a-Naphthol, recrystallized, 1 % (w/v).
7. Diacetyl (butane-2,3-dione).
Procedure
a) Fiske Subbarow phosphate determination:
Pipette into 10 ml. test tubes:
Tube A
2.0 ml. creatine phosphate standard solution (III) 1.0 nil. 0.4 N HC1
Tube B
2.0 ml. distilled water 2.0 ml. 0.4 M N a C l solution Heat tube A in a water bath at 65°C for 10 min., cool and add
1.0 ml. 0.4 N N a O H . Pipette into both tubes
1.0 ml. molybdate solution (1) 0.1 ml. F e S 0
4
solution (2).Mix, allow to stand for 5 min. and read the optical density at 600 mu. or a suitable adjacent wave
length (A against B). Obtain the phosphate content of tube A from a standard curve.
b) Determination of creatine:
Pipette into 10 ml. test tubes (graduated to 10 ml.):
Tube C Tube D Tube E creatine standard solution (III) 2.0 ml. 2.0 ml. — distilled water 1.0 ml. 1.0 ml. 3.0 ml.
0.4 M N a C l solution - 2.0 ml. 2.0 ml.
Warm tube C to 65° C in a water bath, add 1.0 ml. 0.4 N HC1
and keep at 65° C for 9 min. Then add 1.0 ml. 0.4 N N a O H
and quickly cool to r o o m temperature in an ice bath.
To all three tubes in the dark, add 2.0 ml. 1 % a-naphthol solution+>
1.0 ml. diacetyl (butane-2,3-dione) distilled water to 10 ml.,
+
) If an unknown sample is analysed instead of the creatine phosphate standard solution and it contains proteins or other SH groups, add 1 ml. 0.5 M Na-p-chloromercuribenzoate solution.
27
) A. H. Ennor in S. P. Colowick and N. O. Kaplan: Methods in Enzymology. Academic Press, N e w York 1957, Vol. Ill, p. 850.
and keep in the dark for 20 min. at 20° C. Measure the optical density at 520 mu. (C and D against E).
With the difference E£?° — E-
D 20
obtain the creatine content from a standard curve. If the standard curve has been prepared with a pure solution of creatine, then the amount of creatine corresponding to E^
20
— E
5 D
20
must be multiplied by 1.122, because the creatine phosphate forms some creatinine o n hydrolysis. Naturally, this correction is not necessary if the standard curve is prepared with creatine phosphate.
Preparation of Luciferase
M e t h o d a
This simple m e t h o d was described by Strehler and Totter
4
\ w h o used preparations obtained in this way to determine A T P with the Farrand fluorimeter.
Grind 50 mg. of vacuum-dried firefly lanterns*) (10 or 12 lanterns) with 5 ml. ice-cold 0.1 M N a arsenate buffer**) or N a phosphate buffer
4
) (pH 7.4) for 5 to 10 min. Filter the mixture into a test tube standing in an ice bath. Dissolve 50 mg. M g S 0
4
- 7 H2O in the filtrate. The preparation keeps for several days at 4 ° C .M e t h o d b
A purer preparation can be obtained according t o
6
>
1 0
) . This m e t h o d involves fractional precipitation with a m m o n i u m sulphate, and the final preparation contains relatively little apyrase. However, it is not suitable for the continuous measurement of the A T P concentration in chloroplasts, since N H
4
+
ions inhibit the photosynthetic p h o s p h o r y l a t i o n
2 8
) .
Grind thoroughly 4 g. vacuum-dried firefly lanterns with sand and extract with two 50 ml. portions of distilled water. Adjust the extract to p H 6 with 1 N HC1, centrifuge and discard the precipitate.
T o the supernatant add 10 g. ( N H
4
) 2 S 04
, allow to stand for 15 min. at 0 ° C , centrifuge and discard the precipitate. Adjust the p H of the supernatant to 7.5 with 1 N N a O H , again add 10 g.
( N H
4
)2
S 04
, allow to stand for 15 min. a t 0 ° C , centrifuge and discard the precipitate. Adjust the p H of the supernatant to 4.5 with 1 N HC1, add 30 g. ( N H4
)2
S 04
, allow to stand for 10 min. at 0 ° C , filter and discard the filtrate. Dissolve the precipitate in 50 ml. distilled water, store the clear amber- yellow coloured solution in small portions at — 20° C (keeps for several years) or lyophilize and store the residue in a deep-freeze.M e t h o d c McElroy
21
) recommends the following modification.
Grind thoroughly 5 g. dried firefly lanterns in a mortar and extract with 25 ml. cold distilled water.
Adjust the p H of the suspension to ca. 1.1 with 1 N N a O H , centrifuge for 10 min. in the cold at 3 000 g and save the supernatant. Extract the precipitate once again with 25 ml. cold distilled water and centri
fuge as already described. Combine the supernatants and use this crude enzyme preparation for the determinations. Store frozen! On thawing, centrifuge off any precipitate which appears and adjust the p H o f the supernatant to ca. 1.5.
*) Obtainable from Sigma Chemical Co. St. Louis, M o . ; Schwarz Bio-Research Inc., Mt. Vernon, N e w York; Worthington Biochemical Corp., Freehold, N e w Jersey, U S A .
**) N a arsenate buffer (0.1 M ; p H 7.4):
Dissolve 42.5 g. N a
3
A s 04
- 1 2 H2
0 and 10 g. M g C l2
- 6 H2
0 in 1000 ml. distilled water.+) N a phosphate buffer (0.1 M ; p H 7.4):
Dissolve 14.42 g. N a
2
H P 04
- 2 H2
0 and 2.62 g. N a H2
P 04
H2
0 in 1 000 ml. distilled water.2
8) A. T. Jagendorf in C. Fuller et al.: The Photochemical Apparatus, Its Structure and Function.
Brookhaven National Laboratory, U p t o n , N . Y. 1958, p. 236.