The final version of this paper was published in
Society and Economy Vol 34 (2012), No 1, pp. 73-93
Elektronikus elérhetıség:
http://akademiai.com/content/y5077g3qrw7977l9/?p=a6e636ad9f4744b3a059c0ad011a87f1&pi=2
DOI: 10.1556/SocEc.2011.0011
The impact of external market factors on operational practices and performance of companies
1Zsolt Matyusza , Krisztina Demeterb and Csenge Szigetváric
aCorvinus University of Budapest,zsolt.matyusz@uni-corvinus.hu
b Corvinus University of Budapest, krisztina.demeter@uni-corvinus.hu
cGrundfos Magyarország Kft., cszigetvari@grundfos.com Abstract
The links between operational practices and performance are well studied in the literature, both theoretically and empirically. However, mostly internal factors are inspected more closely as the basis of operational performance, even if the impact of external, environmental factors is often emphasized. Our research fills a part of this existing gap in the literature. We examine how two environmental factors, market dynamism and competition impact the use of some operational practices (such as quality improvement, product development, automation, etc.) and the resulting operations and business performance.
The method of path analysis is used. Data were acquired through an international survey (IMSS – International Manufacturing Strategy Survey), which was executed in 2005, in 23 participating countries in so called
“innovative” industries (ISIC 28-35) with a sample of 711 firms. Results show that both market dynamism and competition have large impact on business performance, but the indirect effects, through operations practices are rather weak compared to direct ones. The most influential practices are from the area of process and control, and quality management.
Keywords: operational practice, operational performance, business performance, market dynamism, competition, path analysis
1. Introduction
Companies operate in market economies. They buy materials from a mix of suppliers and sell products to various customers on markets regulated by governments. Moreover, they have to compete with others for the same customers (and sometimes for suppliers), which demands continuous development in companies’ products and processes. Thus the local environment has a huge impact on companies’ strategies and everyday operations.
The market environment plays an important role in some areas of economics – such as business policy, organizational theory, strategic or marketing management – for more than fifty years now. However, the field of operations management has not paid enough attention to the market environment until recently (Sousa – Voss, 2008), although some market factors can influence the operations heavily. For example, dynamic market changes might require more flexible technologies and human resources, as well as more intense innovation to react to the changes. Also, fierce market competition can require strategies that make new practices, like waste elimination, productivity increase, more intense innovation necessary.
But where should operations managers invest in order to serve company performance the most? There are several operations management practices that increase the efficiency and effectiveness of resource (technology and human) utilization and inward, internal and outward processes in factories and plants. Many companies are not aware which operations management practices influence their performance the most, and hence can be considered as
‘best’ practices. Moreover, those best practices are usually considered universal, neglecting the environment, the characteristics of the companies and the fact that after due time these practices will be rendered obsolete and new practices will be favoured. Because of these phenomena Davies and Kochbar (2002) put forward three possible ways for future research:
(1) best practices are those practices that lead to better performance, (2) best practices are context specific, so they must be investigated in the context they have been taken from, and
1 The contribution of authors is 47.5% - 47.5% - 5%, respectively.
(3) practices should be analysed more holistically, in which case best practices are improving the overall performance, not just the performance of one specific area. Davies and Kochbar (2002) also note that the few studies that have taken place vary widely in methodology and results. Thus there is a theoretical gap which should be examined closer.
In this article we examine the impact of two important contextual factors, market dynamism and competition intensity on operations management practices, their resulting effect on operations performance (such as cost, quality, dependability and flexibility) and finally on business level (financial and market related) performance. Thus we will be able to identify which operational practices to use or avoid under different market conditions in order to achieve the best operational and/or business level performance. Although market dynamism and competition impact other systems than operations within companies, we focus on the operations management field, and the work of operations managers. Non-related strategic issues or other functional fields (eg. marketing) are out of scope of this article.
The article is structured as follows. First, we review the relevant literature of the operations management practices and performance with a focus on the best practice approach, as well as the role of market environment in operations in the past and nowadays. We finish this part with building our model. Then we describe the research methodology including sampling and survey instruments development. During our research we search answers to the following questions: a) Have the external market factors any impact on operations management practices? If so, which practices are affected and which are not? b) Do the external market factors affect business performance either directly or indirectly? c) Do operations management practices influence business performance through operational performance dimensions with external market factors in the context? We analyse the results based on the IMSS IV data.
Finally we discuss our findings, draw the main conclusions, identify the limitations of the research, and propose ideas for further research.
2. Literature review
Operations practices and performance
Manufacturing strategy – which sets objectives and gives directions for operations practice – has its origin in Skinner’s seminal article (Skinner, 1969). Since then three interrelated paradigms of manufacturing strategy have emerged – competing through manufacturing, strategic choices in manufacturing (striving for internal and external consistency between choices in manufacturing strategy) and best practices (Voss, 2005a), the first and third of them relevant for this article.
The paradigm of competing through manufacturing is based on the resourced based view of the firm (Schroeder et al, 2002). It argues that the firm should compete through manufacturing capabilities (developed on the basis of order winners: cost, quality, dependability, flexibility, see Hill – Hill, 2009). Thus having lower costs, and/or higher quality, dependability and flexibility is essential task for manufacturing which it can achieve by managing its resources and capabilities, especially those which are limited and difficult to replicate (Schroeder et al, 2002). This paradigm is the most proactive: by relying on and developing existing or potential capabilities manufacturing can become the driving force of business strategy. That happened in such cases as Toyota, IKEA or Amazon: there new way of producing products and delivering services set new standards in their industry.
We rely on the competing through manufacturing paradigm by assuming a cumulative relationship between order winners (Ferdows – de Meyer, 1990; Grössler – Grübner, 2006) as opposed to a trade-off relationship (Skinner, 1969). In the sand cone model, the most well known representative of cumulative relationship (Ferdows – de Meyer, 1990) quality forms
the bottom layer. If companies improve quality, then dependability, flexibility and cost efficiency will also increase. So companies should reach an adequate level of quality first before moving on to improve dependability, which, in parallel, will also improve flexibility and cost efficiency. After having reached enough dependability they can enhance flexibility, and finally they can focus on the cost drivers. If the companies start to increase cost efficiency first, then trade-off will work: quality, dependability and flexibility will suffer.
Best practice is the most recent and for us the most relevant paradigm. It originates from the mid 1980s, including practices such as MRP (Material Requirements Planning), OPT (Optimized Production Technology), FMS (Flexible Manufacturing Systems) or group technology. These practices were united under the concept of “world class manufacturing”.
According to Voss (2005a), world class means “having best practice in total quality, concurrent engineering, lean production, manufacturing systems, logistics and organization and practice“. The underlying assumption of best (or world class) practice paradigm is that the use of these methods will lead to superior performance, equalling or surpassing the operational performance of the best international companies. Though this assumption is clearly true, there is a substantial failure rate when companies try to implement these practices. We need to take the context into account, because many practices are strongly influenced by special circumstances (see also Sousa – Voss, 2002). This is exactly what we did in article: we considered two contextual factors and looked at how various practices perform in such an environment.
Success can depend on the number and type of applied practices. Voss (2005b) states that it may be useful to examine a set of practices instead of single practices, as they can be grouped into wider bundles and strong complementarity can be shown between the practices in a bundle. Following this advice we created bundles of practices.
Laugen et al. (2006) already have looked at the connection between various manufacturing practices and operational performance with the objective to identify current best practices.
There are two important differences between their and our research. First, we searched for relationship between external environment factors and business performance improvement with a mediating role of operations practices and operations performance, not only between practices and operations performance improvements. A second difference is that we investigated sets of practices, not practices individually.
Market environmental factors
Markets have significant impact on operations. The number and power of customers, suppliers, the existing and potential competitors, their behaviour and the changes they make in time are important building blocks of Porter’s five forces model, the most well-known framework of industrial organization (Porter, 1980). Clearly, these forces will affect the actions and reactions on the operations field: the objectives they target and the tools they use.
But what are the underlying factors behind these forces that adequately describe the market environment? Bourgeois (1980) identified two main attributes of the environment, complexity and dynamism. Complexity refers to the number and diversity of external factors (e.g.
customers, suppliers) facing the organization, while dynamism shows the degree of change in these factors. Sharfman and Dean, Jr. (1991) added a third dimension, resource availability, which includes competition in itself, too. They found that in a highly competitive environment, managers perceived profitability as a harder goal to achieve. In dynamic environments managers perceived their markets more unstable. And finally in complex environments managers perceived their decisions as more uncertain. Richard et al. (2007) collected a full list of attributes from literature, “such as levels of uncertainty, stability,
turbulence, volatility, complexity, relative scarcity of resources and hostility” (p. 1219), but each of these can be traced back to our original attributes discussed before.
To summarize, the intensity of competition and market dynamism seem to be adequate factors to describe the market environment.
3. The model
Our central question is to what extent various external market factors, namely market dynamism and competition affect the use of operations management practices and business performance improvement. We assume that the level of contribution is significant and thus it is important to know which factor and how affect the use of operations practices and the resulting performance.
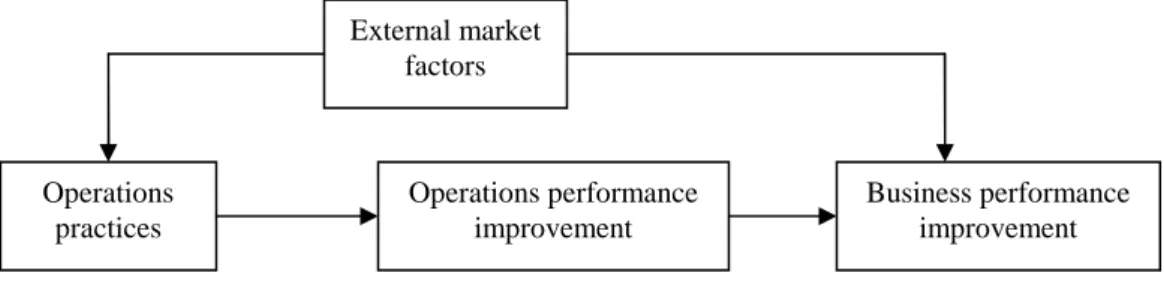
Our model has four levels: 1) external market factors, 2) operations practices, 3) operations performance improvement, 4) business performance improvement (see Figure 1).
Operations performance, such as cost, quality, dependability and flexibility are the result of how the operations process is carried out with the available resources. It is thus an internal performance feature of operations. Business performance, however, depends partly on how well the resources and processes within the whole company operated internally (which results in cost terms), and partly depends on how customers and competitors react on our movements.
So we expect that the external market factors affect business performance directly and indirectly, through operations practices and operational performance. More dynamic changes, for example, urge companies to fasten product development processes and production ramp up, require closer follow-up of customer needs, and/or more flexible technology and partner relations. On the other hand, higher competition demands less waste in processes and more involved employees and suppliers to improve continuously. As new, modern and efficient operations practices are implemented, operations performance can improve and customers are able to realize the change in operations performance (such as quality, delivery, flexibility or cost). This operations performance increase makes customers more satisfied and urge them to repeat purchase and thus automatically improve companies’ business performance. External market factors, however, can affect business performance directly, as well. We investigate only the manufacturing function of the firm in detail, but other business functions and characteristics (e.g. R&D, marketing, organizational structure) can be affected by external factors too, which appears in our model as direct effect. In fact we expect that the direct effects of external market factors on business performance will be higher than indirect ones as market factors have closer relationship with and faster feedback on business functions which are closer to market than operations.
Figure 1: The basic model
External market factors
Operations performance improvement Operations
practices
Business performance improvement
4. Research methodology Survey data
We have used IMSS (International Manufacturing Strategy Survey) data for our analyses.
IMSS is a global network of researchers with the objective to study international manufacturing strategies, their implementation and resulting performances in operations and related areas, such as supply chain management and new product development.
In IMSS data are collected by national research groups using a standard questionnaire developed by a panel of experts, exploiting the previous editions of the research. The questionnaire is translated, if needed, for local languages by OM professors. Respondents are typically production managers, production engineers, people who have deep knowledge about operations within the company.
IMSS-IV data bank, the one we use in this article, extends to 711 valid observations from 23 countries (mainly from Europe but from all other continents but Africa) from the time period between 2005 February and 2006 March. Altogether we sent out questionnaires to 4251 companies which means a response rate of 17% on valid answers.
Industries are not represented in each country in the sample. Nevertheless, even the smallest industry sample (manufacture of office, accounting and computing machinery with 16 observations) stems from 8 countries. The industry and country characteristics of the database can be seen in Table 1 and 2.
Manufacture of … Observations
fabricated metal products 270
machinery and equipment 146
office, accounting and computing machinery 16
electrical machinery and apparatus 92
radio, television and communication equipment and apparatus 39 medical, precision and optical instruments, watches and clocks 29
motor vehicles, trailers and semi-trailers 68
other transport equipment 41
Missing 10
Table 1: Number of observations in various industries in the survey
Countries Valid answers Countries Valid answers Countries Valid answers
Argentina 44 Germany 18 Norway 17
Australia 14 Greece 13 Portugal 10
Belgium 32 Hungary 54 Sweden 82
Brazil 16 Ireland 15 Turkey 35
Canada 25 Israel 20 UK 17
China 38 Italy 45 USA 36
Denmark 36 New Zealand 30 Venezuela 30
Estonia 21 Netherlands 63 Total average 31
Table 2: Geographic distribution of the participating firms
We emphasize that our focus in this article is limited to the market attributes (competition and dynamism) as contingency factors. Although cultural and technological contexts are also important contingency factors, the diversity of industries and countries, even if not totally balanced, reduce the impact of these contextual factors on our results and make them more generalizable.
5. Building survey instruments
In order to operationalize the model we had to make some preliminary analysis to create constructs used later for the path analysis.
5.1. Creating constructs for practice and performance
Since we have a number of variables which makes analyses quite complex, we combined variables into constructs. Our major tool for this combination was the principal component method of factor analysis.
For practices we didn’t have an a priori assumption for the exact number of factors, so we ran the analysis with different number of factors and chose that solution which seemed to be the most reasonable one. In order to judge the goodness of the analysis, we used the Kaiser- Meyer-Olkin (KMO) measure of sampling adequacy, and the Bartlett’s test of sphericity.
The initial unrotated factors of the component matrix were rotated using the Varimax method with Kaiser normalization in order to get the final set of factors. We used the rotated factors as constructs and named them after their content. We used a 0.4 cut-off value for factor loadings, so only those variables, which reached this level, were taken into account. (Azaranga et al., 1998; Flynn – Saladin, 2001).
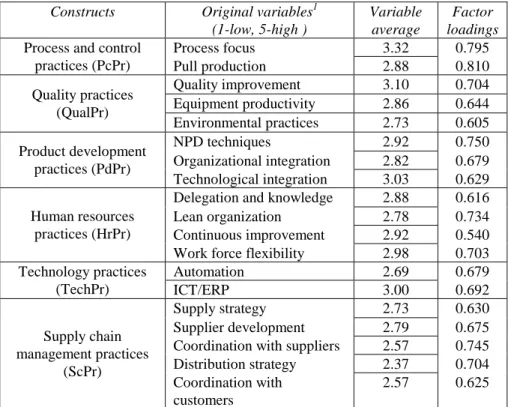
First we created constructs for operations practices by following the steps described above.
The constructs were computed as the average of the original variables. After performing principal component analysis we separated six different factors: 1) process and control practices, 2) quality practices, 3) product development practices, 4) human resources practices, 5) technology practices and 6) supply chain practices. The value of the KMO measure was 0.923, which means a very good fit between the model and the data. Also, we were able to reject Bartlett’s test (Chi-square value = 3504.644, df = 171, sig. = 0.000), so our examined original variables were correlated. The six factors explain 64,606% of total variance, which is an acceptable result. See Table 2 for more details.
Constructs Original variables1 (1-low, 5-high )
Variable average
Factor loadings
Process focus 3.32 0.795
Process and control
practices (PcPr) Pull production 2.88 0.810
Quality improvement 3.10 0.704
Equipment productivity 2.86 0.644 Quality practices
(QualPr)
Environmental practices 2.73 0.605
NPD techniques 2.92 0.750
Organizational integration 2.82 0.679 Product development
practices (PdPr)
Technological integration 3.03 0.629 Delegation and knowledge 2.88 0.616
Lean organization 2.78 0.734
Continuous improvement 2.92 0.540 Human resources
practices (HrPr)
Work force flexibility 2.98 0.703
Automation 2.69 0.679
Technology practices
(TechPr) ICT/ERP 3.00 0.692
Supply strategy 2.73 0.630
Supplier development 2.79 0.675 Coordination with suppliers 2.57 0.745 Distribution strategy 2.37 0.704 Supply chain
management practices (ScPr)
Coordination with customers
2.57 0.625
1 Indicate the degree of the following action programmes undertaken over the last 3 years. (1-5 scale)
Table 2: Constructs for operations practices
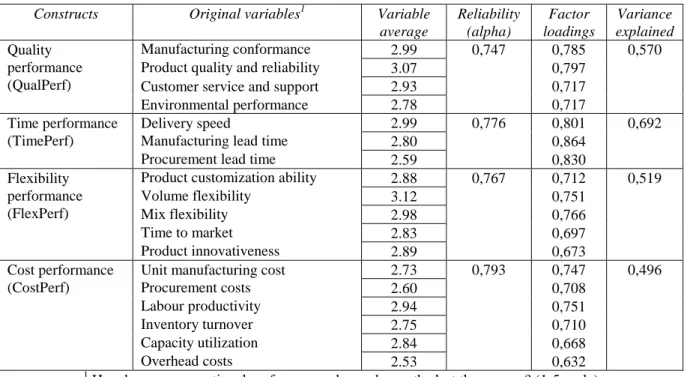
For operational performance improvement constructs we relied on existing literature. As we accepted the sand cone concept in our model, we used the same performance dimensions for analysis, namely: quality, time, flexibility and cost. These constructs can be well separated from each other and are also well supported by existing literature (see e.g. Waters, 2002;
Chase et al., 2006). In the IMSS survey there are several variables concerning operational performance. We created our constructs by grouping these variables in order to measure quality, time, flexibility and cost performance improvement. The variables included in the constructs as well as the reliability and confirmatory factor analysis results can be seen in Table 3. It should be also noted here, that the results show the reliability and validity of the constructs due to the high Cronbach’s alphas and factor loadings. Table 4 also shows the business performance improvement construct created from the original business improvement measures.
Constructs Original variables1 Variable
average
Reliability (alpha)
Factor loadings
Variance explained
Manufacturing conformance 2.99 0,785
Product quality and reliability 3.07 0,797
Customer service and support 2.93 0,717
Quality performance (QualPerf)
Environmental performance 2.78
0,747
0,717
0,570
Delivery speed 2.99 0,801
Manufacturing lead time 2.80 0,864
Time performance (TimePerf)
Procurement lead time 2.59
0,776
0,830
0,692
Product customization ability 2.88 0,712
Volume flexibility 3.12 0,751
Mix flexibility 2.98 0,766
Time to market 2.83 0,697
Flexibility performance (FlexPerf)
Product innovativeness 2.89
0,767
0,673
0,519
Unit manufacturing cost 2.73 0,747
Procurement costs 2.60 0,708
Labour productivity 2.94 0,751
Inventory turnover 2.75 0,710
Capacity utilization 2.84 0,668
Cost performance (CostPerf)
Overhead costs 2.53
0,793
0,632
0,496
1 How has your operational performance changed over the last three years? (1-5 scale)
Table 3: Constructs for operations performance
Construct Original variables Variable
average
Reliability (alpha)
Factor loadings
Variance explained
Sales 2.94 0,762
Market share 2.55 0,732
Return on sales (ROS) 2.48 0,854
Business performance (BusPerf)
Return on investment (ROI) 2.47
0,814
0,861
0,647
1 How has your business performance changed over the last three years? (1-5 scale)
Table 4: Construct for business performance
According to the sand cone model (Ferdows – de Meyer, 1990) there are relationships between operations performance measures. Thus quality is the basis, which affects all other performance measures. Next is delivery performance, then flexibility and finally cost efficiency.
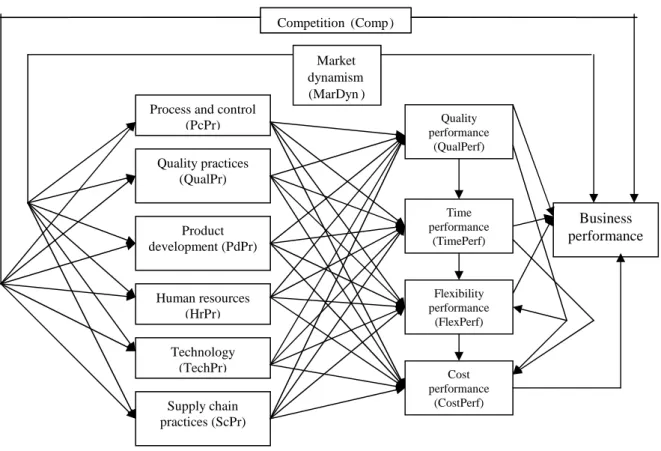
We built two external market factors into the model, market dynamism (1-decline rapidly, 5-growing rapidly) and competition (1-low, 5-high intensity). We examine the direct and indirect effects of these factors on operations practices and business performance. See the
elaborated model in Figure 2.
Figure 2: The elaborated model 5.2. Path analysis
The elaborated model was analyzed with path analysis using SPSS 15.0 program. Path analysis allows us to examine the model as a set of multiple regression equations, one for each dependent variable (Flynn – Saladin, 2001). As we did not have an a priori hypothesis about the linear relationships among the constructs, we were not able to use structural equation modeling (SEM). Because of the exploratory nature of our research the measurement structure is not well defined, so we found regression analysis a more appealing tool (Shah – Goldstein, 2006). This preliminary path analysis specified the significant relationships and the path coefficients (Ward – Duray, 2000). The correlation between any two elements of the model can be broken down into direct and indirect effects. Path coefficients are equivalent to standardized regression coefficients, so the statistical significance of each path coefficient can be determined with conventional t-tests (Rungtusanatham et al., 1998). Hence we will be able to determine which paths are relevant. During the path analysis we allow connections between independent variables, so the problem of multicollinearity does not occur.
In our elaborated model we also assumed that external market factors may influence business performance directly too, not just through operations management practices and operational performance constructs. So we have taken those paths into account during our analysis. Thus, altogether, we had to analyze eleven regression equations: for business performance (affected by 6 independent variables), for quality performance (6 variables), time performance (7 variables), flexibility performance (8 variables), cost performance (9 variables), process and control (2 variables), quality programs (2 variables), product development (2 variables), human resource practices (2 variables), technology (2 variables), SCM practices (2 variables). According to the analysis all the regression equations are significant. Each operations management practice is affected significantly by exactly one
Market dynamism (MarDyn) Competition(Comp)
Market dynamism (MarDyn) Competition(Comp)
Business performance Product
development (PdPr) Quality practices
(QualPr) Process and control
(PcPr)
Human resources (HrPr) Technology
(TechPr) Supply chain practices (ScPr)
Quality performance
(QualPerf)
Time performance
(TimePerf)
Flexibility performance
(FlexPerf)
Cost performance
(CostPerf)
external factor and business performance is influenced by both of them. There are also several relationships among practices and operational performance dimensions, while business performance is affected only by quality and cost performance. The number of significant coefficients is about 40% of the initially examined possible relationships (20 of 48).
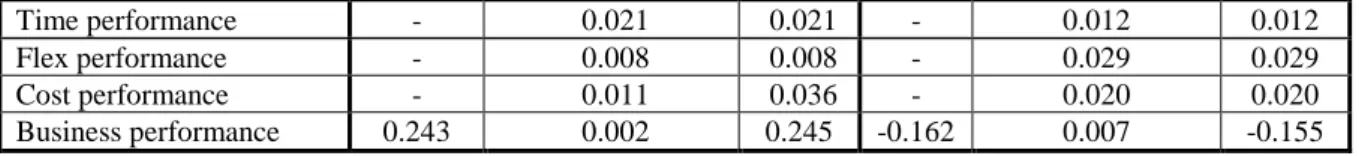
Figure 3 contains the significant relationships between the constructs of the model, while in Table 5 we collected the total direct and indirect effects of the environmental variables on operations performance. Total direct effect means the value of the coefficient between two constructs indicated by numbers above or below arrows in Figure 3. Indirect effect is the sum of each possible path, excluding the direct effect. For example, the indirect effect of competition on quality performance is the sum of two paths: 1) competition – quality practices – quality performance (0.113 x 0.304 = 0.034352) and 2) competition – technology – quality (0.091 x -0.113 = -0.010283), altogether 0.024.
Remark: Thin line shows 0.05 significance level of regression coefficients, and thick line 0.01.
Figure 3: Significant relationships based on path analysis
Market dynamism Competition
Dependent variables
Direct
effect Indirect effect
Total effect
Direct
effect Indirect effect
Total effect
Process and control 0.132 - 0.132 - - -
Quality practices - - - 0.113 - 0.113
Product development - - - 0.135 - 0.135
Human resources 0.078 - 0.078 - - -
Technology - - - 0.091 - 0.091
Supply chain management 0.102 - 0.102 - - -
Quality performance - - - - 0.024 0.024
Market dynamism (MarDyn) Competition(Comp)
Market dynamism (MarDyn) Competition(Comp)
Business performance Product
development (PdPr) Quality practices
(QualPr) Process and control
(PcPr)
Human resources (HrPr) Technology
(TechPr) Supply chain practices (ScPr)
Quality performance
(QualPerf)
Time performance
(TimePerf)
Flexibility performance
(FlexPerf)
Cost performance
(CostPerf) -0.162
0.243
-0.085 -0.113 0.132
0.113
0.102 0.091
0.078 0.135
0.157 0.304
0.111
0.516
0.387
0.240
0.142
0.212 0.501 0.357
Time performance - 0.021 0.021 - 0.012 0.012
Flex performance - 0.008 0.008 - 0.029 0.029
Cost performance - 0.011 0.036 - 0.020 0.020
Business performance 0.243 0.002 0.245 -0.162 0.007 -0.155
Table 5: Total effect of external market factors on operations practices and performance
6. Discussion
Dynamically growing market results in higher business performance improvement, dynamically declining market, on the other side, leads to business performance decrease. In other words, rapidly changing environment has huge direct impact on business performance, primarily due to changing demand and sales. The economic downturn nowadays clearly support this result. However, these changes only very partially run through the operations practices, as the total indirect impact of market dynamism on business performance improvement is negligible (0.002, see Table 5).
Within manufacturing dynamic market changes force companies to make significant changes in their human resource (0.135) and supply chain management practices (0.102), as well as in their process and control (0.132). Human resource and supply chain management practices finally result in non-significant relationships to operations and business performance improvement. This may be the consequence of several things: 1) some efforts were made, but not enough yet. For example, the use of supply chain management programs seems to be relatively low as compared to other practices. 2) Great efforts were made, but their results will be evident only later. Human resource management practices, for example, might have been implemented, but they require years to change the whole organizational culture and then sustain the results. 3) Great efforts were made, but other companies also went through significant changes, so they did not lead neither to competitive advantage nor business performance improvement. 4) Finally, these efforts might have been taken simply to eliminate the disadvantages of uncertain environment, for example, by higher control and/or development of employees and/or suppliers. The result: although performance did not improve, but it did not drop either. We can see examples for any of these reasons in companies. So the result is most likely the combination of all these reasons.
Process and control, the third group of techniques affected by market dynamism, is the only group, which affects operations performance, more precisely its time dimension. Process and control includes such techniques as pull production and process focus. Both practices rely on customer focus, start production when customer order appears, do only the necessary processes and set emphasis on eliminating large batches and waiting times. Time performance change however, does not affect business performance change directly, only through costs.
Eliminated wastes and lower unit prices due to higher productivity finally lead to higher sales, market share, return on investment and/or return on sales. But higher speed or shorter lead times directly do not help significantly to improve business performance. Since few companies are professional in process and control yet, these programs can lead to competitive advantage on the market. This latter phenomenon is supported by several studies. For example, De Toni and Meneghetti (2000) show that pull production help time-based competition, while Jayaram et al. (1999) found that time-related action programmes (such as JIT techniques) affect time-based performance positively.
Our expectation was that dynamically changing markets affect product development, but it was not the case. Rather, product development practices were affected by competition. The fierce competition forces companies to implement their ideas into practice as fast as possible, so competition pushes product development efforts. In turbulent times there is no place to
start large and/or basic product development projects. This situation is similar to arms race.
The arms race urges countries to develop new products and technologies. But these new things are not implemented in practice; they are on the shelves waiting. When things speed up, the question is how rapidly the developed products can be produced. Process and control, human resource and supply chain practices help in this implementation process. It should be noted that previous researches gave contradictory results about the relationship between the role of market competitiveness and product success (Brown – Eisenhardt, 1995), so this link needs further investigation.
Similarly to market dynamics the direct effect of competition on business performance improvement is strongly significant, while the indirect is less so. More fierce competition leads to business performance drop, which is common sense, since companies usually fight for the same customers. Blue ocean strategy, which basically suggests to redefine the industry instead of a competition based strategy (Kim – Mauborgne, 2004) can help to create new markets, but that is out of the scope of manufacturing. What manufacturing can do is to support new products by taking part in new product development or implementing new technologies and processes, which actually happens on the basis of our results.
Besides product development, which was analysed before, competition has significant impact on the use of quality and technology practices. In other words, companies try to differentiate their products by increasing the level of quality and by investing in technology.
Implemented quality programs lead to direct improvement in quality performance, which directly affects business performance and indirectly affects it through time and cost performance improvement. So higher quality products generate higher market share and better returns. Previous literature also supports the relationship between competition and quality, where higher competition usually goes with higher quality level (Banker et al., 1998; Das et al., 2000).
The situation is entirely different for technology. Investment in automation and ICT/ERP systems has negative returns on quality and cost performance. Unfortunately we do not know if these are the short-term or long-term impacts of the use of technology. Initial steps in technology investment may lead to confusion and performance drop at the beginning due to implementation difficulties and learning curves. On the long run, however, it may turn out to be profitable. The literature is also inconclusive concerning the relationship between the use of advanced manufacturing technologies and firm performance (see e.g. Vokurka et al., 2000 and Swamidass – Kotha, 1998), though the adoption of stand-alone AMTs in itself does not trigger improvements in performance (Cagliano – Spina, 2000).
We found several relationships among operational performance constructs. Quality is the base, time follows and finally flexibility and cost sit on the top. We did not find significant relationship between flexibility and cost at p = 0.05 level (however, the relationship is significant at p = 0.10 level). Nonetheless, this phenomenon may worth further investigation as the relationship between these two dimensions is much weaker than the others. These results support previous empirical researches. Ferdows and de Meyer (1990) found hierarchical relationship between the dimensions of quality and time in their sample. More recent articles also dealt empirically with the sand cone concept. The results of Kathuria (2000) indicate that all four competitive capabilities could be simultaneously emphasized and improved. Grössler and Grübner (2006) examined the sand cone concept with structural equation modelling. They concluded that the existing relationship (if it really exists) between flexibility and cost is feeble compared to the other links of the sand cone concept. That finding is consistent with our results.
What are the implications of these results? First, the impact of market conditions on business performance is mostly direct; the contribution of various operations practices to
business performance is minor. So the investment into operations practices should not be the main weapon to improve the business performance in case of market change.
Second, the small impact we found goes through cost performance. That seems to be the final judgement for the operations function, which is not the best news for operations managers, because it keeps them under continuous cost pressure.
Third, even if cost is the most influential operations performance dimension, none of the operations practice groups affect it directly (and positively). That makes the task of increasing business performance more difficult, as operations managers cannot simply focus on cost reduction. Rather, they have to find other ways, such as in case of lean management which keeps quality and lead times in focus, but indirectly results in cost reduction, as well.
Fourth, market dynamism has significant impact on practices which manage relations and communication between workers (HR), between the companies and their partners (SCM), as well as contact them more to customers and shorten processes to reduce reaction times (process and control). Each of these practices can help to react to dynamic changes.
Competition, on the other hand, affects technology and product related practices, which can give higher support to product based differentiation strategies in order to obtain new customers from competitors. Altogether, however, none of the practices have too much impact on business performance.
Market impulses are extremely important signals for businesses. These signals mainly come through sales demand, and proper sales forecasting can indicate this beforehand. In order to be prepared information flow must be proper and quick between markets and manufacturing units. Furthermore, manufacturing must find the way how to adjust their abilities and capabilities to the volatile needs, and the cost of being flexible should be evaluated company by company. Some can increase their cost competitiveness by adjusting and finetuning their HRM processes where the manufacturing process do not require increased skills among the workers or knowledge management is demonstrated on a very high level.
Some will operate with optimising their supply chain, where beneficial trade-offs can be established in the chain. Process and control tools actively contribute to companies’
operational performance.
Knowledge, competence, and related intangibles have emerged as the key drivers of competitive advantage in developed nations. This is not just because of the importance of knowledge itself, but because of the rapid expansion of goods and factor markets leaving intangible assets as the main basis of competitive differentiation in many sectors (Teece, 1998). Learning about coherence of operational and business processes is also a part of gaining knowledge and having the possibility to continuous learning.
Companies spend high amount on market intelligence and often these information is not transformed to operational knowledge. Lack of this knowledge can lead manufacturing units to misjudge their weaknesses, and not focus on those processes which are crucial for business improvements, creating gaps on their continuous improvement circles resulting in later occurring difficulties.
No matter which operational practices are used, business performance is always determined by the external environment as well, as this article describes. Understanding the coherence between the operational practices, operational performance improvement and business performance improvement is a great ability and capability.
The observations included in this article provide a great tool for manufacturing companies to apply in their Balanced Scorecard (Kaplan – Norton, 1996). To know, what is the position of a certain company, and to know where it should be is a basic requirement for the strategy creation. Balance Scorecard helps the future orientation of the companies, so they will be able
to define the knowledge necessary for their operational improvement. If the company is able to choose a strategic target directly effecting its competitiveness, knowledge can be directly linked to business performance.
The systematically and thoroughly considered and implemented knowledge management systems in the fluctuating environment are the tools to strengthen the competitiveness, which is elementary for the business improvement. Companies must find the methods which support their effective and quick learning about this subject, and also understand the coherence between market circumstances and inter company processes.
The observations found in this article can be effectively applied in the companies’
Scorecard where companies are aware of their market circumstances, such as marked dynamism and competition, and this will establish a solid foundation for their achievable strategic targets.
7. Conclusions
The aim of this article was to investigate the impact of market dynamism and competition on the use of operations practices and the resulting operations and business performance improvement. We used the international IMSS-IV databank for this purpose. We created constructs for practices and performance improvements by using explorative factor analysis and then examined the relationships between the constructs with the path analysis method to uncover the significant links.
External market factors have much higher direct impact on business performance, through demand and sales changes, than their indirect effect through manufacturing practices.
Although the changes in market growth and the intensifying competition lead to the implementation of new manufacturing practices, these steps almost hardly impact business performance. Nevertheless, external market factors lead to important changes in the use of operations programs. Market dynamism affects relation and process related practices, while competition affects differentiation supportive practices.
The main limitation of our study is industrial and country related, as we examined only some specific industries (ISIC 28-35) and some countries. Other industries, for example, processing industries due to the different products, manufacturing technologies and working practices, might have other practices which affect operations and business performance improvement differently and other countries, like Japan, for example, might use different partices and get different results due to their specific culture. Another limitation is that we used only two external environmental factors in our research, both of them are market-related. The model may be improved by adding other contingency factors (e.g. government regulations, complexity). It may worth examining the role of external factors deeper and also the inspection of other environmental factors should be considered for a broader application of the results. A further limitation stems from the timing of data. All the data refer to one point in time. Thus long term impact of market factors on the use of manufacturing practices, and also the performance impact of implemented practices is not possible to identify. Finally, the empirical data gave us the opportunity to analyze the results in a reactive manner, assuming (not proving) cause and effect relationships: environment is the independent factor which has an impact on the selection and use of manufacturing factors, which results in some kind of performance. It does not mean, however, that manufacturing cannot provide competitive edge and behave proactively, we can see some of these examples, such as Toyota, Amazon, IKEA, etc. (Slack et al., 2010).
For further research structural equation modelling (SEM) can also be considered in order to validate the whole model that can be seen on Figure 3. Preliminary path analysis was useful to identify the relevant relationships and with SEM we can assess the match of observed data
and these expected patterns (Shah – Goldstein, 2006). Furthermore, the intra-practices context can be analyzed further to map the underlying synergy between practices and their effect on performance dimensions (e.g. see.Waldeck – Leffakis, 2007 for the HR-automation interface and Hendricks et al., 2007 for the IT-SCM interface).
8. Acknowledgement
This research was supported by the Competitiveness Research Centre, by the Hungarian Scientific Research Fund (OTKA T 76233) and the János Bolyai Research Fellowship Program and by TÁMOP-4.2.1/B-09/1/KMR-2010-0005.
9. References
1. Azaranga, M.R. – Gonzalez, G. – Reavill, L. (1998): An Empirical Investigation of the Relationship between Quality Improvement Techniques and Performance – A Mexican Case, Journal of Quality Management, Vol. 3, No.2, pp. 265-292.
2. Banker, R. D. – Khosla, I. – Sinha, K. K. (1998): Quality and Competition, Management Science, Vol. 44, No. 9, pp. 1179-1192.
3. Bourgeois, III, L. J. (1980): Strategy and Environment: A Conceptual Integration, Academy of Management Review, Vol. 5, No. 1, pp. 25-39.
4. Brown, S. L. – Eisenhardt, K. M. (1995): Product Development: Past Research, Present Findings, and Future Directions, The Academy of Management Review, Vol. 20, No. 2, pp. 343-378.
5. Cagliano, R. – Spina, G. (2000): Advanced manufacturing technologies and strategically flexible production, Journal of Operations Management, Vol. 18, pp. 169-190.
6. Chase, R.B. – Jacobs, F.R. – Aquilano, N.J. (2006): Operations Management for Competitive Advantage with Global Cases. McGraw-Hill/Irwin, NY, USA
7. Das, A. – Handfield, R. B. – Calantone, R. J. – Ghosh, S. (2000): A Contingent View of Quality Management – The Impact of International Competition on Quality, Decision Sciences, Vol. 31, No. 3, pp. 649-690.
8. Davies, A. J. – Kochbar, A. K. (2002), “Manufacturing best practice and performance studies: a critique”, International Journal of Operations & Production Management, Vol. 22. No. 3, 2002, pp. 289-305
9. De Toni, A. – Meneghetti, A. (2000): Traditional and innovative paths towards time-based competition, International Journal of Production Economics, Vol. 66, pp. 255-268.
10. Ferdows, K. – de Meyer, A. (1990), “Lasting Improvements in Manufacturing Performance: In Search of a New Theory”, Journal of Operations Management, Vol. 9. No. 2, 1990, pp. 168-184 11. Flynn, B.B. – Saladin, B. (2001): Further evidence on the validity of the theoretical models
underlying the Baldrige criteria, Journal of Operations Management, Vol. 19, pp. 617-652.
12. Grössler, A. – Grübner, A. (2006): An empirical model of the relationships between manufacturing capabilities, International Journal of Operations & Production Management, Vol.
26, No. 5, pp. 458-485
13. Hendricks, K. B. – Singhal, V. R. – Stratman, J. K. (2007): The impact of enterprise systems on corporate performance: A study of ERP, SCM, and CRM systems implementations, Journal of Operations Management, Vol. 25. 2007, pp. 65-82
14. Hill, T. – Hill, A. (2009): Manufacturing strategy: Text and Cases, 3nd revised edition, Palgrave MacMillan, London
15. Jayaram, J. – Vickery, S. K. – Droge, C. (1999): An empirical study of time-based competition in the North American automotive supplier industry, International Journal of Operations and Production Management, Vol. 19, No. 10, pp. 1010-1033.
16. Kaplan, R. S. – Norton, D. P. (1996): The Balanced Scorecard, Harvard Business Press, Boston
17. Kathuria, R. (2000): Competitive priorities and managerial performance: a taxonomy of small manufacturers, Journal of Operations Management, Vol. 18, pp. 627-641
18. Kim, W. C. – Mauborgne, R. (2004): Blue ocean strategy, Harvard Business Review, October, pp.
69-80
19. Laugen, B. T. – Acur, N. – Boer, H. (2006), Manufacturing action programmes and performance.
Proceedings of the EuroMA 2006 Conference, Glasgow, pp. 301-310 20. Porter, M.E. (1980): Competitive Strategy, Free Press, New York, 1980
21. Richard, O. C. – Murthi, B. P. S. – Ismail, K. (2007): The impact of racial diversity on intermediate and long-term performance: The Moderating Role of Environmental Context.
Strategic Management Journal, Vol. 28, pp. 1213-1233
22. Rungtusanatham, M. – Forza, C. – Filippini, R. – Anderson, J. C. (1998): A replication study of a theory of quality management underlying the Deming management method: insights from an Italian context, Journal of Operations Management, Vol. 17, pp. 77-95.
23. Schroeder, R. G. – Bates, K. A. – Junttila, M. A. (2002): A resource-based view of manufacturing strategy and the relationship to manufacturing performance, Strategic Management Journal, Vol.
23, No. 2, pp. 105-117
24. Shah, R. – Goldstein, S.M. (2006): Use of structural equation modeling in operations management research: Looking back and forward, Journal of Operations Management, Vol. 24, pp. 148-169.
25. Sharfman, M. P. – Dean, Jr., J. W. (1991): Conceptualizing and Measuring the Organizational Environment: A Multidimensional Approach, Journal of Management, Vol. 17, No. 4, pp. 681- 700.
26. Skinner, W. (1969), “Manufacturing – Missing Link in Corporate Strategy”, Harvard Business Review, May/June 1969, pp. 136-145
27. Slack, N. – Chambers, S. – Johnston, R. (2010): Operations Management, Sixth Edition, Pearson, Harlow
28. Sousa, R. – Voss, C. A. (2002), “Quality management re-visited: a reflective review and agenda for future research”, Journal of Operations Management, Vol. 20, 2002, pp. 91-109.
29. Sousa, R. – Voss, C. A. (2008): Contingency research in operations management practices.
Journal of Operations Management, Vol. 26, No. 6, pp. 697-713.
30. Swamidass, P. M. – Kotha, S. (1998): Explaining manufacturing technology use, firm size and performance using a multidimensional view of technology, Journal of Operations Management, Vol. 17, pp. 23-37.
31. Teece, T. J. (1998): Research directions for knowledge management, California Management Review, Vol. 4, No. 3, 289-292
32. Vokurka, R. J. – O’Leary-Kelly, S. W. (2000): A review of empirical research on manufacturing flexibility, Journal of Operations Management, Vol. 18, pp. 485-501.
33. Voss, C. A. (2005a), “Alternative paradigms for manufacturing strategy”, International Journal of Operations & Production Management, Vol. 25. No. 12, 2005, pp. 1211-1222, first published in Vol. 15, No. 4, 1995, pp. 5-16.
34. Voss, C. A. (2005b), “Paradigms of manufacturing strategy re-visited”, International Journal of Operations & Production Management, Vol. 25. No. 12, 2005, pp. 1223-1227
35. Waldeck, N. E. – Leffakis, Z. M. (2007): HR perceptions and the provision of workforce training in an AMT enviroment: An empirical study, Omega, Vol. 35, pp. 161-172.
36. Ward, P. – Duray, R. (2000): Manufacturing strategy in context: environment, competitive strategy and manufacturing strategy, Journal of Operations Management, Vol 18, pp. 123-138 37. Waters, D. (2002): Operations management. Producing Goods and Services. Pearson Education
Limited, UK