The challenge of researching dyadic
phenomena – the comparison of dyadic data analysis and traditional statistical methods*
Andrea Gelei Professor
Corvinus University of Budapest
E-mail: andrea.gelei@uni- corvinus.hu
András Sugár
Associate Professor, Head of Department
Corvinus University of Budapest
E-mail: andras.sugar@uni- corvinus.hu
The study of business relationships poses a number of challenges. This article focuses specifically on the methodological issues arising from the dyadic nature of relations. As a consequence of the dyadic nature, it is important that throughout the analyses the phenomena can be measured as embedded in the given relation and in this way, they can be studied without losing their unique context. A common criticism of using question- naire surveys in examining business relations is that in research, the so-called single-ended operationalising or measure is dominant, and the data thus obtained is ana- lysed by traditional mathematical-statistical methods.
According to critical opinions in the literature, this methodological practice cannot lead to reliable results.
The present article uses the database of a question- naire survey to investigate whether the former stand- point is well founded. A specific research hypothesis is tested on the data obtained from paired query. In this process, the suggested methods for dyadic data analy- sis are used besides analyses carried out using various measures from traditional statistics. Dyadic data analy- sis provides extra value primarily in its perspective;
regarding the results in the present study, it has not proved to be a major breakthrough.
KEYWORDS: Paired query.
Dyadic data analysis.
Methodological comparison.
DOI: 10.20311/stat2017.K21.en078
* The project (No. K 115542) is supported by the Hungarian Scientific Research Fund (OTKA).
C
oncerning the closely linked functioning of corporate networks that operate as a dependency system, the conscious management of business relations is appreciated from the perspective of competitiveness and so does its research. The investigation of such relations is particularly important because the traditional, so-called transac- tional interpretation of cooperation between companies has become untenable. It is obvious that in these cooperative processes the parties often mutually influence each other, adapt to each other, and as a result, a new connection is created that is covered by the term business partnership. In short, business partnership is interpreted as a link between interconnected, interacting and interdependent actors. Past events be- tween the actors, their perceptions of each other and their future expectations togeth- er influence the decisions of the partners and the future progress of the relationship itself. Therefore, the specific content of each relationship is unique. This is the so- called interactional approach that abandons the transaction-based approach (Ford et al. [2008]), where the relationship which can be characterised by mutual adaptation and dependence is the basic unit of analysis.The study of business relationships poses a number of theoretical and methodologi- cal challenges. This article focuses specifically on the methodological issues arising from the so-called dyadic (i.e. two-ended) nature of relations. The essence of the dyad- ic nature is that during their cooperation and unique connections, relational features are created between partners. The measurement and analysis of these can only be per- formed in the context of the specific relationship, in the specific dyad. Therefore, it is important that throughout the analyses the various corporate phenomena are measured as embedded in the given relation, keeping the unique context of the relations. Many researchers have stressed the importance of this dyadic approach (Brennan–Turnbull–
Wilson [2003]). As it will be shown in the examination of trust as a special relational feature, quantitative analyses are still characterised mainly by the so-called single- ended approach. It is also true in the international context that researchers are often not intent on dyadic operationalisation or the measurement of dyadic variables. Where the measurement is made at the level of connection, typically, conventional statistical methods are used; the methodology for dealing with dyadic contexts, the application of the so-called dyadic data analysis (Ickes–Duck [2000]) is still not widespread. In a former article by the authors (Gelei–Dobos–Sugár [2014]), the essence of this new mathematical-statistical approach, its basic techniques and methods were presented and logical arguments have been listed to support the view that its application in the study of dyadic phenomena should lead to results which are more reliable. The purpose of the present article is to test the theoretical argumentation empirically, and to investigate
whether traditional statistical measures and the so-called dyadic data analysis method lead to similar or different results. The analyses are carried out on the database of an empirical study focusing on trustworthiness in corporate relations.
First, the methodological techniques that are most widespread in and indeed pre- dominantly used for questionnaire-based research studies are briefly reviewed. This is followed by the description of the study whose database is used for the analyses in this article. Throughout this description only those parts of the study are summarised that are relevant from the perspective of this paper. Next, the specific research hy- pothesis is presented, and then the sample design and some important details of the dyadic data analysis performed are described with a brief summary of the results.
Subsequently, the central part of this article explains which traditional statistical methods can be used to test the database obtained by dyadic operationalisation. The study is concluded by summarising and evaluating the results reached using the dif- ferent methodologies and by formulating directions for future research.
1. The current research methodological profile in the light of dyadic phenomena appearing in corporate relations – Focusing on trust
A fundamental challenge facing by research on corporate relations is dyadic opera- tionalisation and measurement, and the ability to manage the resulting unique relational context in the course of the analysis. For example, many studies have stressed that mutuality (or its absence) which can be perceived in connection with the analysed relational features (such as trust) is of key importance regarding the relationship and the future progress of cooperating parties (Noordewier–John–Nevin [1994], Dyer–
Singh [1998], Fawcett–Jones–Fawcett [2012]). Successful business relations suggest long-term planning by the partners and regarding many critical relational features, the presence of trust as well (Ivens [2004], Holm–Eriksson–Johanson [1999], Cox [2004]).
The necessity of analysing the dyadic context is illustrated well by the question of mutuality. For its study, dyadic operationalisation and measurement are – in theory – indispensable, together with an additional analysis which ensures that the effects pro- duced by the specific relational contexts are captured.
The subsequent section provides a brief summary of the currently widespread methodological techniques used by Gelei–Dobos [2016a], and as a reflection of these, the so-called research methodological profile. The authors in their article summarise the research results of twenty studies published after 2000 in international journals from the field of trust. After having processed these publications, it can be stated that
the techniques used for operationalisation, measurement and analysis are describable along three distinctive features. These are as follows:
1. The specificity of the corporate relations included in the analysis;
2. The operationalisation used and the related sampling procedure;
3. The applied mathematical-statistical methodology.
1.1. The specificity of the corporate relations included in the analysis
The topic of the study in many articles was trust appearing in corporate relations, however, the analyses themselves did not focus on specific relationships but asked general questions about the level of trust in the business relations of the respondents.
This method of data collection is the so-called general relational analysis. Other articles have studied trustworthiness in specific business relationships; therefore, this data collection method is called specific relational analysis.
1.2. The operationalisation and sampling processes applied
Despite the differences between individual and organisational perception and be- haviour (Anderson–Narus [1990]), it is widely accepted that interfirm trust is ulti- mately built on and can be traced back to trust between individuals (Håkansson–
Snehota [1995]). For this reason, a common methodological procedure for assessing interfirm trust assumes that key actors in a relationship are data suppliers, and inter- firm trust is likewise captured through their observations (Deutsch [1973], Zucker [1986], Bachmann [2001]).
Throughout the queries posing questions to these respondents of great importance, it is also a key issue how researchers operationalise the studied dyadic variable.
Henneberg–Ashnai–Naudé [2009] distinguish between five types of operationalisa- tion: 1. simple monadic operationalisation; 2. monadic operationalisation based on another respondent’s perceptions; 3. internal dyad; 4. quasi-dyadic operationalisation;
5. dyadic operationalisation.
These five types of operationalisation were also identifiable in the twenty articles on the field of trust, used for the purposes of this paper. In several articles, the actual sampling process involved only one side of the relationships, and data were collected from the key respondent of one of the parties in a pair. According to the terminology in Henneberg–Ashnai–Naudé’s study [2009], this is the so-called simple monadic opera- tionalisation or the type based on the perception of another participant. Following the terminology by Brennan–Turnbull–Wilson [2003], this will be called single-ended
sampling. In other articles, operationalisation occurred as a quasi-dyadic process, that is, only one side of the relationship was measured; however, the respondent provided data not only about his/her own (and at the same time, his/her firm’s) observations but also indicated their views on their partner’s observations about their own (the partner’s) firm. This technique of data collection is called quasi-dyadic sampling in the research methodological profile. The analysed articles also included a few where throughout the sampling procedure respondents were contacted and data were collected from both sides of relationships. These were the ones involved real dyadic sampling procedures.
They differed, however, in the number of respondents contacted by the researchers from one or the other side of the given relationship. Based on the number of partici- pants, two kinds of sampling procedures can be distinguished (Svensson [2006]):
1. one-to-one actor sampling (one respondent from both sides) and 2. multiple- participant sampling (more than one respondent from both sides).
1.3. The statistical-mathematical methodology applied in the analysis
All the studied publications used the traditional methods of statistics in the anal- yses, independently from the type of operationalisation and sampling. However, studying dyadic phenomena using traditional mathematical-statistical methods may be problematic even if quasi- or real dyadic sampling is ensured. According to the literature, the processing of these two-ended samples using traditional statistical methods may lead to a number of error types in the analytical process (Gonzalez–
Griffin [2000], Gelei–Dobos–Sugár [2014]): 1. error of assumed independence;
2. data omission error; 3. error between levels; and 4. error of the levels of analysis.1 In order to avoid the above errors, the use of dyadic data analysis is suggest- ed (Gonzalez–Griffin [2000], Kenny–Kashy–Cook [2006], Burk–Steglich–Snijders
1 To explain the error of analytical levels, let us bring an example from classical paired samples. For paired entry, statistics textbooks usually give the example of married couples where, compared with the independent sample case (when random husbands and wives are chosen, independently from each other), related husbands and wives (from the same marriage) are asked. The following question will be used to measure the level of trust:
“Assuming that you have arranged to meet your partner somewhere, how much would you be willing to wait if your partner was late?” The average of the waiting time shows the combined level of trust of the couples (how long they are willing to wait for each other on average). The 2N data characterises the waiting time inde- pendently from each other, as a proxy of the perceived trust.
Let us assume that in another question we enquire about how strong the economic-social cooperation is be- tween members of a married couple, for example, along variables that reflect to what extent their private in- come is shared. The study seeks to answer how much their trust in each other affects the ratio of shared finances.
Using the averages of the couples as dyad-level data, the relationship between the “mutual level of trust” and the ratio of income that is shared is quantified. The latter has sense: it shows the percentage of the total income of the couple that is shared. Regarding the participants as separate individuals, 2N tells us how much the level of trust towards each other affects the amount of money shared. However, it is not revealed how much this relationship is symmetrical or asymmetrical, or who the dominant actor is.
[2007]). In dyadic sampling procedures, the pair of data that represents both sides of the relationship is available. This, in theory, makes it possible for this data pair to form the unit of analysis. In a statistical sense, in such cases the observations are defined by the answers given for the same variable (such as, for example, the per- ceived level of trust) by two individuals (or companies) in a given relationship. Dy- adic data analysis rests upon the analysis of these; in addition, it provides a possible technique for the elimination of the analytical method that can be regarded traditional.
The Hungarian review of dyadic data analysis can be found in an article by Gelei–
Dobos–Sugár [2014].
In the previous sections, we have reviewed the techniques of operationalisation, measurement and analysis in the studied international publications. Based on these, Table 1 summarises the present methodological profile.
Table 1
Research profile of the state-of-the-art methodology in trust-related and survey-based empirical research papers
Article
Methodological characteristics
Level of concreteness Sampling technique Type of statistics
General relational analysis Concrete relationship analysis Concrete situation Single-end sampling Quasi two-sided sampling Real two-sided sampling
Classical statistics Dyadic data analysis One-to-one re- spondent sampling Multiple- respondent sam- pling Pairwise sampling
Zineldin–Jonsson [2000] x – x x
Handfield–Bechtel [2002] x – x x
Brashear et al. [2003] x – x x
Dyer–Chu [2003] x – x x
Farrelly–Quester [2003] x – x x
Izquierdo–Cillán [2004 ] x – x x
Kwon–Suh [2004] x – x x
Ryssel–Ritter–Gemünden [2004] x – x x
Gounaris [2003] x – x x
Leung et al. [2005] x – x x
Svensson [2005] x – x x
Gao–Sirgy–Monroe [2005] x – x x
(Continued on the next page)
(Continuation)
Article
Methodological characteristics
Level of concreteness Sampling technique Type of statistics
General relational analysis Concrete relationship analysis Concrete situation Single-end sampling Quasi two-sided sampling Real two-sided sampling
Classical statistics Dyadic data analysis One-to-one re- spondent sampling Multiple- respondent sam- pling Pairwise sampling
Barnes–Naudé–Michell [2005] x – x x
Ulaga–Eggert [2006] x – x x
Svensson [2006] x – x x x
Zhao–Cavusgil [2006] x – x x
Caceres–Paparoidamis [2007] x – x x
Eriksson–Laan [2007] x – x x
Kingshott–Pecotich [2007] x – x x
Liu–Luo–Liu [2009] x – x x
Nielsen–Nielsen [2009] x – x x
Panayides–Lun [2009] x – x x
Yeung et al. [2009] x – x x
Wagner–Eggert–Lindemann [2010] x – x x
Davis et al. [2011] x – x x
Jiang–Henneberg–Naudé [2012] x – x x
Source: Gelei–Dobos [2016] p. 672.
2. Dyadic data analysis or the traditional statistical set of methods? – A comparative analysis
Based on the review of the methodological techniques of publications dealing with issues of trust in business relations, it can be concluded that Brennan–Turnbull–
Wilson’s criticism [2003] is still valid. In research studies, being single-ended is still a dominant feature; therefore, the reliability of results reached in this way is ques- tionable. Is it actually true that real two-ended operationalisation and measurement
together with dyadic data analysis lead to completely different results compared with the presently dominant research practice? The present study aims to answer this question.
We suggest that the use of single- but quasi-two-ended sampling obviously dis- torts research results, as the reliability of the data is questionable. A sample from single-ended surveys unquestionably lacks concrete relational context. Quasi-dyadic sampling assigns the two values received from the query to a specific relationship (“What do I believe about the trustworthiness of my partner?” and “What do I think he/she holds true about me in this respect?”). Nevertheless, as both are given by one (and the same) representative of a relationship, sampling is an obvious source of error that needs to be avoided. For this reason, in what follows only those cases will be discussed where actual dyadic operationalisation and measurement are ensured, and the comparison of the results reached by traditional mathematical-statistical methods with those of dyadic data analysis will be in focus. First, our study that uses paired queries and dyadic data analysis is presented in short, then the same database is used to perform calculations applying the relevant traditional mathematical- statistical methods.
2.1. The study used as the basis of comparison and the results reached by dyadic data analysis
This article will not cover the economic theoretical background of the study; it can be found in Gelei’s [2014] and Gelei–Dobos’s [2016] article. Still, it is important that the hypothesis of our study was the following: When the level of trustworthiness between the partners is mutually strong in a given business relationship, then it is true for that business relationship that high-risk actions occur (and are carried out). A questionnaire has been designed, and using paired query, respondents were asked to indicate on a –3 to 3 scale how much they considered their specific partner trustwor- thy. Then the questionnaire asked whether the respondent would be willing to share pieces of information of varied sensitivity (therefore, representing varied risk levels) with a certain specific partner. These packages of information were the following:
– Intelligence (operational information) related to specific coopera- tive action (e.g. order quantity or delivery deadline);
– Intelligence involving information that influences the relationship with another cooperating partner (e.g. data on capacity and inventory);
– Sensitive financial information (e.g. costs, profit content);
– Information on future strategic plans, innovation (e.g. new sales entities/routes or products).
Eighty-nine pairs, that is, 178 respondents were asked in the data collection pro- cess. This data collection was followed by requesting feedback concerning the sensi- tivity of the four information packages and the conceived risk level of sharing them.
There was a consensus among the professionals present that sharing sensitive finan- cial data involved the highest risk. This means that our hypothesis is confirmed if a causal link is demonstrated between the high risk situation (i.e. sharing sensitive financial information) and a mutually high level of trustworthiness combined with the appearance of willingness to act (the actual sharing of information).
The analysis examined how much trustworthiness (reliability) influences the ap- pearance of risk-taking in specific business relationships. For this reason, the sample obtained by paired query was analysed by dyadic regression analysis (Kenny–Kashy–
Cook [2006]). Two such models are available in the set of methods for dyadic data analysis: the so-called ICC (intraclass correlation coefficient) model and the APIM (actor-partner interdependence model).
The ICC model only maps the interaction between pairs. The mathematical form of the model is:
0 1 2
Y β β X β X,
where X and X are independent variables obtained through double data entry, while Y is a dependent variable. β0, β1 and β2 are regression coefficients. These regres- sion coefficients are defined as follows:
1 2
1
y xy xy xx
x xx
s r r r
β
s r
and
2 2
1
y xy xy xx
x xx
s r r r
β
s r
,
where sx and sy are standard deviations of variables X and Y, while rxx is the within- group correlation of variable X, rxy is the correlation between variables X and Y, the so-called internal correlation of the respondent. Finally, rxy is the correlation be- tween variables X and Y, the so-called cross-correlation between individuals that form a pair. These relationships make it clear that the ICC model actually provides regression relationships by identifying internal correlations within the group (pairs).
In the regression context, β1·X predicts how variable X of one of the actors of a pair predicts the value of variable Y for the same actor. On the other hand, β2·X
illustrates how the partner’s variable X (that is X) predicts the value of variable Y of the actor.
Therefore, this regression relationship shows the direction of the relationship and beyond that, the strength of the relationship, as it captures the linear effect of variable
X on variable Y. Obviously, the opposite logical relationship (i.e. the effect of varia- ble Y on variable X) can be captured with the same exact method depending on what is studied in the relationship between the two variables.
The APIM differs only slightly from the ICC model. It maps not only the interac- tion of the pairs, but it also involves the mutual interaction between the pairs. The mathematical form of the model is:
0 1 2 3
Y β β X β X β X X ,
where β0, β1 and β2 are defined in the same way as it is done in the ICC model.
The only difference is that mutual interaction is built into the model by the inclusion of the β3·X ·X formula, where β3 is a regression coefficient. The X ·Xproduct is a new variable in this case and expresses the mutual, common effect of the two ac- tors of the pair for variable Y of the actor.
The parameters are estimated in this version of the model in a manner similar to what has been shown earlier. Those who are interested in the details may find the full derivations of the formulae in Kenny–Kashy–Cook [2006].
The essential difference between the two models is that the ICC model only in- volves the actor and partner effects, while the APIM also comprises the so-called mutual effect in the analysis. In the light of the hypothesis of the present study, the APIM is more relevant here. The results above support the hypothesis that in the case of the actual risk-involving situation (sharing of sensitive financial information) and only here, the model was significant at the 0.000 level, and the value of R2 was 0.21.
This indicates moderate causal link. Trustworthiness measured in the actual relation- ships, in other words, the mutuality of the level of trust is not a negligible condition of the appearance of trust, that is, of the occurrence of risk-involving actions.
2.2. Testing the research hypothesis using traditional mathematical- statistical methods
The study of dyadic phenomena may be carried out by the traditional methods of statistics using three different approaches of statistical logic. In all of them, the start- ing point is that two logically related items form a pair. These three approaches are the following:
I. One of the types of data treatment is the one-dimensional traditional mathemat- ical-statistical set of methods. In this approach, the basic unit of observation is the response of one of the actors of a pair and not two related data items. Of course, information about which actor of the specific relationship was the respondent may
also appear as an additional variable in these analyses. This is how directionality may become analysable, for example, to see whether the given phenomenon is symmet- rical and mutual or not. What cannot be examined using this approach is what effect this asymmetry may have on other examined variables. Placing the trustworthiness figures of our sample in a cross tabulation table, it becomes obvious that for some pairs the relationship may be asymmetrical.
Throughout the following analyses presented here, again, the responses of the questionnaire survey used earlier will be applied, but they have been submitted to certain transformations. The transformations may serve multiple purposes.
The responses given to the questionnaires are often binary (yes/no types) or measure on an ordinal scale. In the relationship studies, variable Y, according to our assumption, is usually an easily measurable quantitative criterion; transformations are used for its approximation.
A cumulative indicator of trustworthiness was formed for three questions of the questionnaire (how much the current partner is known, how much this individual is trusted, and how much the individual’s firm is trusted – values between –3 and 3 could be given to all of these). The value of the cumulative indicator was formed by the derivation of the weighted average of the three indicators. The weights were counted in a way so that the strength of the relationship between the derived trust- worthiness index and the indicator that measures willingness to share information (involving four situations) would be maximum. (In other words, using an iteration procedure following the canonical logic of correlation, the weight numbers were identified so that they maximise the value of the linear correlation between the linear combination which forms trustworthiness, and the likewise weighted variable that measures willingness to share information.)
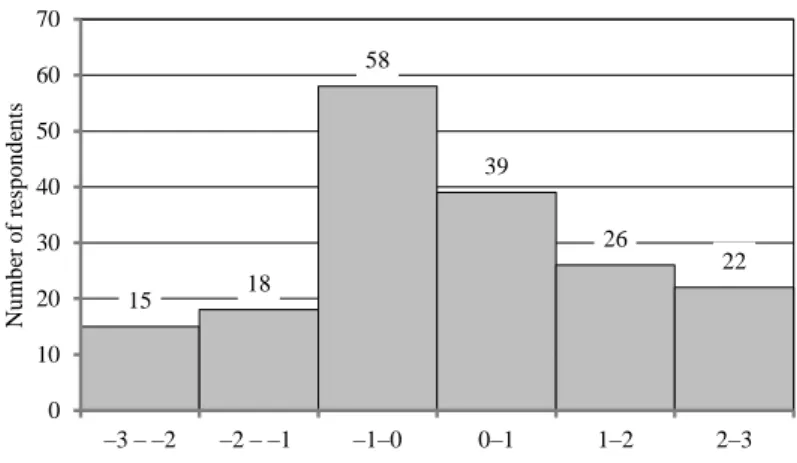
For trustworthiness, the values were 0.2, 0.5 and 0.3, that is, the highest weight was given to the perceived trustworthiness of the partner. The trust index thus formed measures between –3 and 3. Its distribution is shown in Figure 1. (As it has been mentioned earlier, our sample contained answers from 178 individuals [89 pairs].) The figure shows that the formed trust index measures the established level of trust following a relatively symmetrical distribution. In Table 2, some values have been merged for the sake of transparency, and the terms are used as follows:
untrustworthy for values below –1, neutral for values –1 to 1, trustworthy for values above 1. Then the relationship between the trustworthiness of the two members of a dyad was checked. Table 2 shows that the established level of trust is identical only in half of the cases (see the pairs in the diagonal of the table). From the perspective of our hypothesis, it is highly important that the relationship may be asymmetrical, which may be interpreted in a way that there could be a dominant actor in the estab- lishment of a trust relationship. From one perspective, there are sixteen pairs where the trust level of actor B is above A’s, while there are much more (twenty-seven)
pairs, where the trust level of actor A exceeds that of B. (See Table 2.) Thus in the establishment of the level of trust, the dominant partner is probably B. This dimen- sion is very difficult to show with traditional statistical methods.
Figure 1. The distribution of trust index values in the sample
15 18
58
39
26
22
0 10 20 30 40 50 60 70
–3 – –2 –2 – –1 –1–0 0–1 1–2 2–3
Number of respondents
Note. The weighted averages of the trust index range between –3 and 3. The sample includes 178 individuals.
Source: Here and in Figure 2 and Tables 2–3, own calculations.
Table 2
The levels of trustworthiness (in three groups) for each pair
Level of trustworthiness of partner A
Level of trustworthiness of partner B
Low Medium High Total
Low 3 6 1 10
Medium 13 28 9 50
High 1 13 15 29
Total 17 47 25 89
In the research hypothesis formulated here, the symmetrical nature of the rela- tionship is important. We wanted to discover if symmetrical, i.e. mutually high level of trust influences whether high-risk information is shared or not. Single-ended oper- ationalisation and analysis based on theoretical argumentation cannot give an appro- priate answer to this.
II. The other approach regards the pair as the basic unit of observation. Such is the paired sample in conventional statistics where, similarly to the dyadic approach, the related observations together serve as the unit of analysis. The analysis of the
paired sample, however, does not use the double data collection of dyadic data anal- ysis (Gonzalez–Griffin [2000], Gelei–Dobos–Sugár [2014]). Paired sample analyses from our perspective have relatively poor methodological background. They work primarily with ratio and difference analyses, but they cannot or do not intend to achieve causal relationships. At the same time, the paired sample technique is worth highlighting, because within the framework of classical statistics, this is where the logic of dyadic data analysis (i.e. the fact that the responses and data of each pair are related to each other) is most often used. It is a typical case for paired samples when the same population is used to collect the same sample in time or space so that the members of the sample will be the same, only the responses may change or differ from each other.
At this point, a major limitation of traditional inductive statistics should be point- ed out. Inductive statistics assumes the representativeness of the sample. (In an ex- plicit form, this usually appears in a way that data observed can be regarded as the independent sample with identical distribution, or it can be assumed that it approach- es identical distribution because of the small sample and different placements of weight.) In the examination of trust and similar problems, the representativeness of the sample is out of the question. Often, the population is not known by the research- er, the respondents are the ones who just participate in the given study, which means that the analysis is basically descriptive. In this case, inductive statistics makes little sense. In the framework of traditional statistics, the answer to this problem is regres- sion analysis. Regarding the present topic, regression technique may be a tangible solution, because instead of the traditional sample space, another sample space is used, which is interpreted on a random factor, that is, the set of observations applica- ble to the remaining members needs to originate from an independent identical dis- persion and that is why it is possible to use the set of inductive statistical methods.
Dyadic data analysis uses only regression technique, and within that, it focuses on the correlation coefficient, it even bases the calculations of the beta parameters on this. The essence of the dyadic approach is that it regards each relationship unique and intends to put the consequences of the unique context in the centre of analysis.
Hence, this approach does not pose any requirements about generalisation regarding total population either. The field of researching corporate relations from the perspec- tive of representativeness is also interesting as the relationships between (business) people as a population are difficult to conceptualise (rotation) and are difficult to handle throughout the analyses.
Generalisation of paired samples exists, and so does the panel that uses cross- sectional and time series data in conjunction and assumes temporal interrelation. One of the main fields of panel analyses is regression analysis, but the explanation of the parallelism between panel and dyadic data analyses is beyond the scope of this paper, it may be the topic of future research.
III. The third approach is dyadic data analysis which contains an important step compared with the paired sample – the double data collection technique that has been mentioned earlier. This technique doubles the sample, that is, it enters both actors of a pair into the sample twice. In so doing, it expands the double responses to achieve extra information from the database.
Earlier, it has been shown what results were achieved by dyadic data analysis. As the procedure of paired samples is not so useful for the study of cause and effect relationships (and has an inductive statistical background), its use and discussion will not be performed here, and in the rest of this article the set of methods of traditional statistics will be used. The results will be presented along the procedure that repre- sents the first three types of errors. What we would like to see is how much the anal- yses using the traditional set of methods of statistics lead to similar or different re- sults as what were achieved by the APIM of dyadic data analysis. Is it true that the method of dyadic data analysis leads to different (better?) results than the traditional statistical procedures? (We will not discuss the analysis of the fourth source of error, as it needs the combined application of procedures and cannot solve any of the sur- facing problems.)
III. 1. The error of assumed independence. In this case, the 2N data obtained from the responses of N pairs are regarded as sample, and the hypothesis is tested using the regression analysis of traditional statistics.
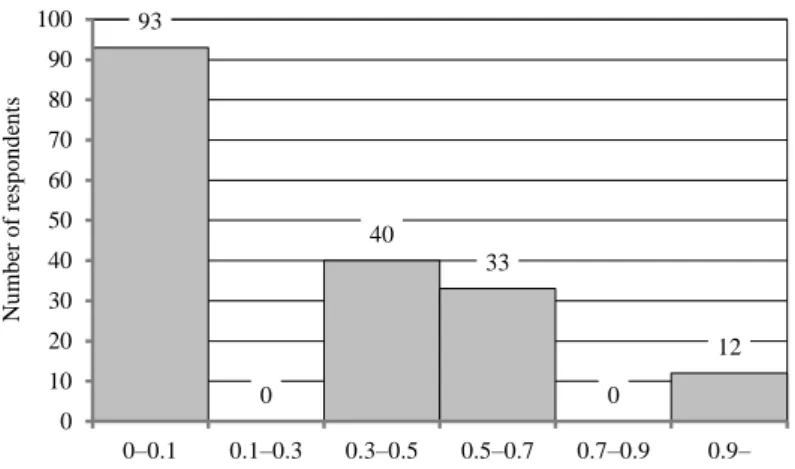
As it has been mentioned before, in regression models significance is dealt with by the random member (the residual). It is assumed for this random member that it is an independent sample of identical distribution and its quantity is small besides its randomness. In case the residual is small, the model is good (significant). Therefore, it is important that the variables in regression are quantitative criteria because if they are not, the residuals cannot be modelled. In this empirical study, the effect (or out- come) is the presence of willingness to act or the lack of it (shares information = 1, does not share information = 0), this way, this variable can sometimes be regarded a quantitative criterion. In such cases, the application of binary models (e.g. logistic regression) is suggested. Another solution may be “expanding” the variable that measures willingness to act. In the questionnaire, respondents were asked to share information concerning four situations (willingness to share information that is 1. operative, 2. related to other firms, 3. financial or 4. strategic). It is possible to measure willingness to share information with the linear combination of responses to these four questions. (Weights, as mentioned before, were created to maximise the value of correlation between trust and sharing of information. Here, the values of weights are 0.05, 0.40, 0.50 and 0.05, respectively, that is, the highest weight was assigned to sharing financial information that is the highest risk action situation).
Figure 2 shows that willingness to share information follows left-skewed distribu- tion, the least willingness is the most likely.
Figure 2. Cumulative measure of the distribution of willingness to share information
93
0
40
33
0
12
0 10 20 30 40 50 60 70 80 90 100
0–0.1 0.1–0.3 0.3–0.5 0.5–0.7 0.7–0.9 0.9–
Number of respondents
Note. The values of the cumulative measure range between 0 and 1. The sample includes 178 individuals.
The relatively weak link between trustworthiness and willingness to act may be explained by the different distribution of the two variables – trustworthiness is rela- tively symmetrical, the latter is left-skewed. There may be a methodological reason, the two types of scale approaches behind this. In one, the responses ranged between –3 and 3, in the other one, it was between 0 and 1, which forces stronger resolutions, and in this way, leads to less symmetrical distribution. The use of the two scales is not arbitrary though, the nature of sharing information is different from the percep- tion of a characteristic. A further direction for future research may be to examine how much a different way of formulating the questions would influence the distribu- tion of answers, and thus the kind of relationship. It may also be assumed that more effort will need to be placed on involving other (control) variables in the analysis so that the explanatory value of the model will be higher, and in this way, the effect of trustworthiness can become more clearly analysable.
First, a simple two-variable regression was counted for 178 data, where the rela- tionship between the level of trust and willingness to share information was meas- ured based on 2N data. With a simple regression equation, the level of trust is signif- icant at p = 0.000 (which explains willingness to share information), and R2 = 0.22.
As mentioned earlier, with the help of a dummy variable of values between 0 and 1 in the basic model (with 2N members), the identity of the respondent can be built into the model. In this case, the significance level of this dummy variable is 0.046 (the other’s is still 0.000), and the value of R2 slightly rises to 0.24. The result shows that the phenomenon is asymmetrical, the coefficient of trustworthiness perceived and indicated by one member of a pair raises the level of willingness to act, but our analysis does not give an answer to the question of which partner it is out of the spe-
cific pairs. The estimated parameters of the two models can be seen in the following (Y is the willingness to share information, B is the level of trust, D is the dummy that signifies a respondent):
1. Y = 0.28 + 0.098B
2. Y = 0.32 + 0.098B – 0.077D.
The analysis was also performed by logistic regression, regarding variable Y
“willingness to share financial information”. Here, what is shown is only an esti- mate, the trust level based on 2N data, and the model containing the dummy varia- ble that showed which one the responding partner is. The estimated parameters of the model (the significance levels of the two variables are 0.000 and 0.043, and the ratio of the so-called proper classification is 68%, which – similarly to the coeffi- cient of determination of the regression model – shows the relatively low explanato- ry power):
Y = 1.953B + 0.509D.
The result of the model that contains the dummy variable is similar to the results of the simple regression model in content. It shows that the likelihood of occurrences of risk-involving actions (sharing sensitive information) rises, the value of the pa- rameter is 1.95, which means that if one regards his/her partner trustworthy, one’s participation in risk-involving action and sharing sensitive financial information with this partner are almost twice as likely. In such dyads, the likelihood of the appear- ance of trust is almost double compared with relationships that can be characterised with low trustworthiness. The direction of the dummy variable is the same as well, that is, if someone is randomly asked in the second place, he/she is less likely to share information that may involve risk than his/her partner given the same level of trustworthiness. As we can see, both traditional and logistic regressions have pro- duced the same results. In addition, the result of APIM regression analysis of dyadic data analysis has basically the same explanatory power, R2 = 0.21 (p = 0.000). The not too high but significant R2 values may indicate that the effect of trustworthiness is significant, however, it is highly probable that the effect is strongly influenced by other phenomena and variables (e.g. how long a respondent has known his/her part- ner). An important outcome for future research is that the separate effects of different influential factors should be examined further, as the indicated trustworthiness may be related to other phenomena (e.g. the length of the relationship), and the effect on trust is reflected in this.
In the case of 2N sample members, path analysis was also performed, but the product of the two parameters (level of trustworthiness and willingness to act in risk-
involving situations) was not significant. It appears that this analysis is not applicable in the present study.
III. 2. The error of data omission. In this case, the values of one of the members of each pair were omitted from the sample, and the study was continued with a sam- ple of N members, again using the traditional mathematic-statistical set of methods.
In our view, this solution is indefensible in terms of content, as the database is de- prived of its paired nature, which makes it impossible to analyse any underlying question from that point on. Statistically, however, this is a possible procedure. Let us mention as an example that the correlation coefficients among the three variables that map trustworthiness from the 2N (one under the other) data are successively 0.59, 0.57 and 0.74 (that is, they measure medium-strength relationships between close- ness of acquaintance and the two dimensions of trust; a closer link exists between the level of trust in the current partner and the level of trust in the firm). At the same time, the correlation coefficients of the two samples of N members (i.e. two separate half-samples) are exactly the same, for one group they are 0.58 (first and second questions), 0.58 (first and third questions) and 0.75 (second and third questions);
while for the other group, the values of correlations are 0.6, 0.55 and 0.74, respec- tively. That is, it seems that the system of relations is the same based on half of the information, even though mutual or asymmetrical types of interaction were com- pletely disregarded.
III. 3. Inter-level error. Here, the averages of the values for two variables of two members in a paired query are counted, and in the rest of the analysis, these dyad level averages are used in the calculations. In this averaging it is of course a question whether this average can actually capture the dyad-level effect. The values achieved in averaging show what the average opinion is of each other within the dyads. This means that the effect within the dyad is captured. It is easily possible that the average value calculated will be 0 on the –3 to 3 scale used. This 0 average may also reflect two opposing phenomena, as two 0s may also lead to a 0 average. The two phenom- ena are obviously different and raise a problem that is not negligible from the per- spective of answering the research hypothesis.
The data obtained by paired query was first analysed along the classical paired sample. This approach builds on t-tests, and the basic assumption behind its applica- tion is that there may be strong positive correlation between the opinions of members in a pair. In the case of classical paired sample analyses, the assumption of non- independence is typically valid and useful, because this way the estimation is much more accurate than it would be with two independent samples. In psychology or in opinion polls, it is right to assume non-independence, but it is not necessarily advisa- ble when researching business relations. In this empirical study, it has occurred that members of a pair indicated opinions that were completely different from each other.
This could not occur in classical analysis using a paired sample.
In the cases examined in this study, the strong positive relationship among the re- sponses within pairs is not true. In our analysis, the values obtained were the follow- ing: r = 0.38 for trustworthiness, while r = 0.29 for sharing information, which re- flects the fact that there is an existing strong positive relation regarding both varia- bles, but it is not too strong. In the next step, t-test was used to analyse the pair-level averages for the variables (level of trustworthiness and the willingness to share sensi- tive financial information). That is, it was checked whether there were significant differences between each pair. The difference between the perceived levels of trust- worthiness was not significant (p = 0.89), but regarding willingness to share financial information it was (p = 0.03). Let us not forget that in the present study it was con- sidered that in theory there may be some relationship between the members of a pair.
The results show that the pairs that have the same level of trustworthiness on average differ regarding the examined information-sharing situation. This phenomenon and its cause cannot be analysed by the traditional paired sample.
To illustrate the error between levels, another calculation was performed, and the result of linear regression was checked for the dyad averages (to see how the meas- ured level of trustworthiness affects willingness to share information). In this case, compared with the simple 2N two-variable regression, the explanatory power de- creases (the determination coefficient is 15%). Averaging weakens the strength of the relationship, because the relationship between the opinions of each pair was not very strong.
3. Summary
In this article, a method of analysing paired queries, dyadic data analysis was compared with traditional methods based on data from a specific study. The current- ly predominant methodological approaches were presented on the example of a dy- adic phenomenon that appears in business relationships, using twenty-six interna- tional publications. This overview has confirmed the criticism formulated by several researchers that our present research methodological techniques do not support the reliable analysis of dyadic phenomena. Often, there is no dyadic operationalisation, the measurement of the studied relational characteristics does not take place. Instead, the data available are analysed using traditional mathematical-statistical methods.
The purpose of this article was the empirical examination of the primarily theoret- ical critical argumentation. It was checked how much traditional statistical methods and the so-called dyadic data analysis lead to similar or different results. The anal- yses were performed on the authors’ own research database on trust in business rela-
tions using paired query, i.e. measuring the examined phenomenon in a specific rela- tional context.
In summary, it can be stated that in the study of relational features, it is important to use paired query and consequently, to embed the phenomenon in context. At the same time, dyadic data analysis provides extra value compared with traditional methods primarily in its perspective; concerning the results, it has not brought a great breakthrough. (See Table 3.) However, it draws attention to important factors that might be overlooked in traditional data analysis. The relationships of the answers to each other, the symmetrical-asymmetrical nature of the studied phenomenon (in this case, trustworthiness) and its possible effect on, for example, willingness to share information are dimensions whose importance is better represented in dyadic data analysis.
Table 3
Summary table of calculations
Model Explanatory power
Dyadic data analysis – APIM R2 = 0.21
Traditional regression analysis (sample of 2N members) R2 = 0.22 Traditional regression analysis (sample of 2N members;
0–1 dummy variable: the identity of the respondent)
R2 = 0.24
Logistical regression (sample of 2N members;
0–1 dummy variable: the identity of the respondent)
The ratio of correct classification is 68%.
Traditional regression analysis (sample of N members) R2 = 0.15
Averaging – t-test of the classical paired sample There have been such calculations, but their basic logic is different (it analyses the level of signifi- cance between averages), for this reason, the results cannot be compared with the other models.
In traditional methodology where query is paired (classical paired sample, differ- ence and product estimation), it is more difficult to carry out cause and effect studies, significance examination is in the focus. From the viewpoint of testing our specific hypothesis, the problem is that using traditional (sampling) methods, queries on rep- resentative samples are the starting point. Nevertheless, in traditional regression models the realisation of a paired sample approach may appear forced.
Our inquiry made it necessary to use the paired query technique. At the same time, from a statistical perspective, the database thus formed did not show better results with the so-called double-entry (i.e. with the suggested transformation) by doubling of recorded pairs of data and with the dyadic data analysis technique that builds on
this. The explanatory power of the various models examined is similar (and is always relatively low).
Further examination of the research methodological problem raised by the so- called contextually embedded dyadic business phenomena may be continued in vari- ous directions, for example:
– The critical review of dyadic data analysis. The study of the vari- ous suggested correlation types and the mathematical-statistical ac- ceptability of regression analysis itself.
– The planning and performance of a study that makes it possible to involve various types of independent variables. In the present empiri- cal study, not only such independent variables were missing, but in many cases, the applied level of measurement was not ideal either. In the subsequent analytical phase, the avoidance of these problems may lead to more reliable results.
References
ANDERSON,E.–NARUS,J.A. [1990]: A model of distributor firm and manufacturer firm working partnerships. Journal of Marketing. Vol. 54. No. 1. pp. 42–58.
http://dx.doi.org/10.2307/1252172
BACHMANN,R. [2001]: Trust, power and control in trans-organizational relations. Organization Studies. Vol. 22. No. 2. pp. 337–365. http://dx.doi.org/10.1177/0170840601222007
BARNES,B.R.–NAUDÉ,P.–MICHELL,P. [2005]: Exploring commitment and dependency in dyadic relationships. Journal of Business-to-Business Marketing. Vol. 12. No. 3. pp. 1–26.
http://dx.doi.org/10.1300/J033v12n03_01
BRASHEAR,TH.G.–BOLES,J.S.–BELLENGER,D.N.–BROOKS, CH. M. [2003]: An empirical test of trust-building processes and outcomes in sales manager-salesperson relationships. Journal of the Academy of Marketing Science. Vol. 31. No. 2. pp. 189–200.
http://dx.doi.org/10.1177/0092070302250902
BRENNAN,R.–TURNBULL,P.W.–WILSON,D.T. [2003]: Dyadic adaptation in business-to-business markets. European Journal of Marketing. Vol. 37. Issues 11–12. pp. 1636–1665.
http://dx.doi.org/10.1108/03090560310495393
BURK,J.W.–STEGLICH,C.E.G.–SNIJDERS,T.A.B. [2007]: Beyond dyadic interdependence:
actor-oriented models for co-evolving social networks and individual behaviors. International Journal of Behavioral Development. Vol. 31. No. 4. pp. 397–404.
http://dx.doi.org/10.1177/0165025407077762
CACERES, R.C. –PAPAROIDAMIS,N. G. [2007]: Service quality, relationship satisfaction, trust, commitment and business‐to‐business loyalty. European Journal of Marketing. Vol. 41. Nos.
7–8. pp. 836–867. https://doi.org/10.1108/03090560710752429
COX,A. [2004]: Business relationship alignment: on the commensurability of value capture and mutuality in buyer and supplier exchange. Supply Chain Management: An International Jour- nal. Vol. 9. Issue 5. pp. 410–420. http://dx.doi.org/10.1108/13598540410560793
DAVIS,M.A.P.–LASSAR,W.–MANOLIS,C.–PRINCE,M.–WINSOR, R. D. [2011]: A model of trust and compliance in franchise relationships. Journal of Business Venturing. Vol. 26. Issue 3.
pp. 321–340. http://dx.doi.org/10.1016/j.jbusvent.2009.09.005
DEUTSCH,M. [1973]: The Resolution of Conflict. Yale University Press. New Haven.
DYER,J.H.–CHU,W. [2003]: The role of trustworthiness in reducing transaction cost and improv- ing performance: empirical evidence from the United States, Japan, and Korea. Organization Science. Vol. 14. No. 1. pp. 57–68. http://dx.doi.org/10.1287/orsc.14.1.57.12806
DYER,J.H.–SINGH,H. [1998]: The relational view: cooperative strategy and sources of interor- ganizational competitive advantage. The Academy of Management Review. Vol. 23. No. 4. pp.
660–679. http://dx.doi.org/10.2307/259056
ERIKSSON,P.E.–LAAN,A. [2007]: Procurement effects on trust and control in client-contractor relationships. Engineering, Construction and Architectural Management. Vol. 14. No. 4. pp.
387–399. http://dx.doi.org/10.1108/09699980710760694
FARRELLY,F.–QUESTER,P.[2003]:The effects of market orientation on trust and commitment: the case of the sponsorship business‐to‐business relationship.European Journal of Marketing.Vol.
37. Nos. 3–4. pp. 530–553.https://doi.org/10.1108/03090560310459078
FAWCETT,S.E.–JONES,S.L.–FAWCETT,A.M. [2012]: Supply chain trust: the catalyst for collab- orative innovation. Business Horizons. Vol. 55. Issue 2. pp. 163–178.
http://dx.doi.org/10.1016/j.bushor.2011.11.004
FORD,D.–GADDE,L-E.–HÅKANSSON,H.–SNEHOTA,I.–WALUSZEWSKI,A. [2008]: Analyzing Business Interaction. Proceedings of the 24th Annual IMP Conference.
http://www.impgroup.org/uploads/papers/6366.pdf
GAO,T.–SIRGY,M.J.–MONROE,M.B. [2005]: Reducing buyer decision-making uncertainty in organizational purchasing: can supplier trust, commitment, and dependence help? Journal of Business Research. Vol. 58. No. 4. pp. 397–405. http://dx.doi.org/10.1016/S0148- 2963(03)00137-1
GELEI,A.–DOBOS,I.–SUGÁR,A. [2014]: Bevezetés a diadikus adatelemzésbe – elmélet és alkal- mazás. Statisztikai Szemle. Vol. 92. No. 5. pp. 417–446.
GELEI, A.–DOBOS, I. [2016]: Mutual trustworthiness as a governance mechanism in business relationships – A dyadic data analysis. Acta Oeconomica. Vol. 66. No. 4. pp. 661–684.
https://doi.org/10.1556/032.2016.66.4.5
GELEI,A. [2014]: Az üzleti kapcsolatok irányítása – fókuszban a bizalom. Köz-gazdaság. Tudomá- nyos Füzetek. Vol. IX. No. 2. pp. 85–99.
GONZALEZ,R.–GRIFFIN,D. [2000]: The statistics of interdependence: treating dyadic data with respect. In: Ickes, W. – Duck, S. (eds.): The Social Psychology of Personal Relationships. John Wiley and Sons. New York. pp. 181–213.
GONZALEZ,R. [2010]: Dyadic Data Analysis. University of Michigan. Michigan.
GOUNARIS,S.P. [2003]: Trust and commitment influences on customer retention: insights from business-to-business services. Journal of Business Research. Vol. 58. Issue 2. pp. 126–140.
http://dx.doi.org/10.1016/S0148-2963(03)00122-X