The final version of this paper was published in International Journal of Production Economics
Vol. 133, No. 1, pp. 154-163 (2011)
http://dx.doi.org/10.1016/j.ijpe.2009.10.031
THE IMPACT OF LEAN PRACTICES ON INVENTORY TURNOVER Krisztina Demeter and Zsolt Matyusz
Corvinus University of Budapest Dep. of Logistics and Supply Chain Management
Fővám tér 8, Budapest H-1093, Hungary E-mails:
krisztina.demeter@uni-corvinus.hu zsolt.matyusz@uni-corvinus.hu
Abstract
Lean manufacturing (LM) is currently enjoying its second heyday. Companies in several industries are implementing lean practices to keep pace with the competition and achieve better results. In this article, we will concentrate on how companies can improve their inventory turnover performance through the use of lean practices. According to our main proposition, firms that widely apply lean practices have higher inventory turnover than those that do not rely on LM. However, there may be significant differences in inventory turnover even among lean manufacturers depending on their contingencies. Therefore, we also investigate how various contingency factors (production systems, order types, product types) influence the inventory turnover of lean manufacturers. We use cluster and correlation analysis to separate manufacturers based on the extent of their leanness and to examine the effect of contingencies. We acquired the data from the International Manufacturing Strategy Survey (IMSS) in ISIC sectors 28-35.
Keywords: lean, manufacturing practices, inventory management
1. Introduction
Every company has to invest in manufacturing management programs, methods and technologies in order to remain competitive. One very popular investment choice nowadays is lean production (LP), which consists of several manufacturing practices, including process focus, pull production, quality development, total productive maintenance, continuous improvement, worker empowerment, supplier development, and so on. The main objective of LP is to satisfy customer needs on the highest possible level through the elimination of waste.
Some sources of waste are overproduction, faulty products, sub-optimized processes, unnecessary waiting, movement or transportation, and excess inventory.
However, if this is true, and several kinds of waste can be reduced, why does every company not implement LP, and why do some fail during the implementation process? In the early literature, researchers blamed various conditions: for example, excessive demand fluctuation, a high level of product variation, or low demand that therefore cannot justify a line production system or cellular manufacturing. A few years later, however, we read about successful lean manufacturing program implementation at companies and industries that were far from satisfying these conditions (e.g., health care, Fillingham, 2007). As a result, the question arises of whether LP can be successful under any circumstances and what results can be achieved if the circumstances are not ideal.
In this paper, we investigate how various contingency factors influence inventory turnover performance, a very important indicator of the success of LP in companies applying lean practices (see e.g., Huson and Nanda, 1995). For this purpose, we formulate the following research questions:
- How do lean practices affect firm inventory levels?
- How do certain contingency factors (production systems, order types and product types) influence corporate inventories within an LP environment?
The structure of the paper is as follows. First, we review the LP literature, including works on inventory performance and contingency issues, to form a basis for our propositions. Then we introduce our methodology and the survey. After our data analysis, the results are discussed and some conclusions are drawn.
2. Literature review Lean production in general
LP originated from the Toyota production system (TPS) and gained ground as a best-practice manufacturing strategy and repository of increasing competitiveness in recent decades (Voss, 2005). The best evidence of this phenomenon is the increase in the number of lean transformations all over the world in the preceding 10-15 years (Bruun and Mefford, 2003).
It is extremely difficult, however, to determine what LP stands for. Unfortunately, definitions are rather vague and confused, with several elements and sub-elements put forth in various papers. Even in standard OM textbooks, one can find only definitions such as “[lean production is] an integrated set of activities designed to achieve high-volume production using minimal inventories of raw materials, work-in-process, and finished goods” (Lewis, 2000; Chase et al., 2006). The first publication using the term (Womack et al, 1990) explained lean production simply as a journey leading to the use of fewer resources.
The confusion around lean production arises from several sources: a) the Toyota production system itself, which has undergone tremendous improvement during its lean journey over the last 40 years (Spear, 2004; Voss, 2007); b) the fact that several companies consider themselves lean, even if they are at very different stages of development; c) the fact that researchers use various definitions for the term, such that there is no common understanding (Hines et al, 2004); and d) the introduction of another book by Womack and Jones (1996) entitled “Lean thinking”, which describes the principles of LP and opens new areas for leanness, thus leading to further lack of clarity. From that book on, it became evident that LP exists at both strategic and operational levels (Hines et al, 2004). At the strategic level, the concept helps one to understand customer value and identify the value stream. At the operational level, it is a bundle of practices and tools that lead to the elimination of waste and force continuous improvement. It is the latter that is relevant to the goals of this paper.
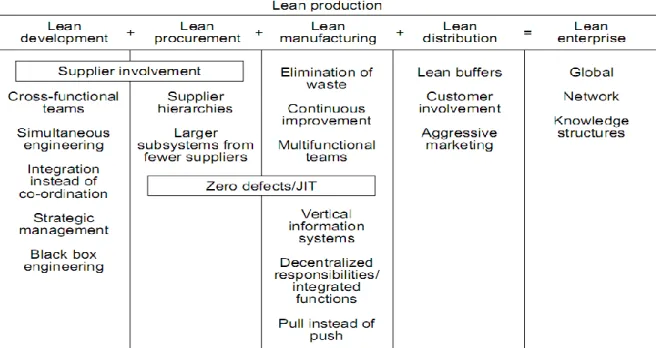
According to Karlsson and Ahlstrom (1996), LP permeates an entire organization (Figure 1).
It consists of lean development, lean procurement, lean manufacturing (LM) and lean distribution. This shows that the proper utilization of LP affects the whole firm. However, LP is not only a set of practices connected to the value-creation process. Rather, LP constitutes the pursuit of excellence based on a mixture of performance, continuous improvement and organizational change (De Toni and Tonchia, 1994).
Empirical evidence supports the idea that LP partially explains high corporate performance.
For example, the British auto components industry increased its stock turn ratio by 177.4%
between 1992 and 1994 (Oliver et al., 1996). Indeed, early implementation was seen in the automotive and electronics industries (Crawford et al., 1988). Nevertheless, LP as a whole seems to be universal, even if there are industrial barriers to the transfer of certain elements.
For example, in the healthcare industry, LP can be applied easily in theory, but the special circumstances that characterize that industry (e.g., the simple fact that one has to work with patients rather than lifeless material) make its proper application more difficult. This indicates that there is no single good solution to achieving higher performance, and that the context of operations is of the utmost importance, but that LP can at least be applied to a certain extent in several industries (Lowe et al., 1997; Shah and Ward, 2003).
Figure 1: Elements of lean production (Karlsson – Ahlstrom, 1996)
We analyzed data from an international manufacturing survey that also contained questions from other corporate functions, but wherein manufacturing was in the focus. On this basis, we concentrated our subsequent efforts only on the LM part of lean production. This decision was also supported by the fact that manufacturing is the function whereby leanness is usually introduced to a company. Therefore, if one is looking for candidates for lean adaptation, one must look at the first area of LP implementation—that is, manufacturing.
Karlsson and Ahlstrom (1996) enumerate the following building blocks of LM: elimination of waste, continuous improvement, multifunctional teams, zero defects/JIT, vertical information systems, decentralized responsibilities/integrated functions, pull versus push (see Figure 1).
As the goals of LM are realized through the implementation of several lean practices, we will investigate them more closely in the section that follows.
Lean practices
There are numerous practices that can be applied under LM. This is one reason why one finds rather different individual practices investigated in the relevant literature, though the focus on LM is the same (e.g., see Sohal and Egglestone, 1994; Oliver et al., 1996; White et al., 1999).
A better approach is to create bundles of practices that show the multi-faceted nature of LM.
There have been several classifications of bundles put forth by previous literature. For example, Lowe et al. (1997) differentiate between three bundles of practices: factory practices (related to the minimization of buffers), human resource management (HRM) practices (concerning the encouragement of high commitment and motivation among the workforce) and work systems (related to teamwork and the development and application of employee knowledge and skills on the shop floor). On the other hand, Sakakibara et al. (1997) describe infrastructure practices (quality management, workforce management, manufacturing strategy, organizational characteristics, product design) and JIT practices (set-up time reduction, schedule flexibility, maintenance, equipment layout, kanban, and JIT supplier relationships). Dal Pont et al. (2008) identify three bundles; namely JIT (with items such as JIT delivery, frequent supplier delivery, kanban pull systems, small lot sizes, and so on), TQM (with items like statistical process control, poka yoke, equipment problem-solving, and
so on) and HRM (with items such as employee encouragement, multiple task training, flat organization structure, and so on).
In the following, we will use the classification developed by Shah and Ward (2003), which lists four different bundles; namely, JIT, total quality management (TQM), total productive maintenance (TPM) and human resource management (HRM). We chose this classification because we believe that it encompasses the various aspects of LM in the most comprehensive way. What are the relationships among these four elements?
TQM, JIT and TPM have similar fundamental goals: continuous improvement and waste reduction. Together, they are a comprehensive set of manufacturing practices directed towards improving performance. Two major forms of waste can be addressed by JIT through the associated practices: work-in-process inventory and unnecessary delays in flow time. TPM helps to maximize equipment effectiveness throughout its entire life, and TQM is aimed at continuously improving and sustaining quality products and processes (Cua et al., 2001).
TQM and TPM are the two pillars that support JIT production systems, but it is often hard to clearly separate their effect on manufacturing performance, which indicates that perhaps TQM and TPM are strongly interrelated (Imai, 1998; McKone et al., 2001).
Sriparavastu and Gupta (1997) investigated the implementation of JIT and TQM principles in US manufacturing firms. They found that the joint application of JIT and TQM increased quality standards and productivity more than either JIT or TQM alone. According to Cua et al.
(2001) simultaneous implementation of TQM, JIT and TPM will result in higher performance than will the implementation of practices from only one of TQM, TPM, and JIT.
The fourth bundle, HRM, shows the work organization practices in LM. JIT changes the previously existing work environment so that the importance of proper human resource management increases. As both JIT and TQM rely on the concept of teams, the involvement of employees is necessary for efficient operations (Forza, 1996). Previous empirical research supported the idea that HR practices contribute most when they are implemented in bundles and integrated with manufacturing policies. Plants that bundled HR practices with manufacturing practices outperformed those that were not doing this. As such, HRM supported both JIT and TQM (Flynn et al., 1995; Macduffie, 1995). See Figure 2 for a visual representation of the practices in question.
Figure 2: The bundles of lean manufacturing
Inventory outcomes of lean manufacturing
Manufacturing performance is related to a combination of practices; hence, several performance measures can be used efficiently. The most typical measures are rejects and scrap, reworking, labor and machine productivity, product quality, inventory levels and turnover, unit manufacturing cost, manufacturing cycle time, delivery speed and reliability (De Toni and Tonchia, 1994; Flynn et al., 1995; Lowe et al., 1997; White et al., 1999; Shah
and Ward, 2003; Vastag and Whybark, 2005).
Of these measures, we can emphasize inventory turnover as a visible and concrete marker of world-class performance and also as an indicator of effort. However, according to Schonberger, (2003) only 34% of 1000 studied world-class manufacturing firms were able to increase inventory turnover for at least 10 years, manufacturing performance is often most heavily weighted by inventory turnover ratio. This interesting fact shows that the change in time of inventory turnover is not that trivial (Sakakibara et al., 1997).
Higher inventory turnover means that the company has to invest less capital in raw materials (RM), work-in-process (WIP) or finished goods (FG). Certainly, reducing the amount of working capital frees up loans or makes additional investments possible. One of the fundamental goals of LM is to eliminate excess inventories as a form of waste. Other sources of waste also affect the level and turnover of inventories. Overproduction, for example, means that the company produces more products than expected, which results in high FG inventories that spend a long time in the warehouse or might never be sold. Faulty products can result in useless materials, waiting for processing leads to more WIP, and unnecessary transportation between working stations or plants also increases inventory. Thus, it seems obvious that eliminating wastes can result in higher inventory turnover, or in other words, a shorter time spent in the form of inventories.
As we mentioned earlier, lean practices used in LM consist of four bundles. Based on those bundles, the effects of TQM and JIT practices on inventory turnover were more exhaustively researched. Companies observed significant improvements in lead time, delivery cycles, productivity and quality levels, rejection rates, and customer satisfaction; there was substantial reduction in stocks of FG and WIP (Sohal and Egglestone, 1994; Flynn et al., 1995; Lowe et al., 1997; Sriparavastu and Gupta, 1997).
Contingency factors and lean practices
The role of contingency factors is becoming progressively more important in operations management. Previous studies examined factors such as size, capacity utilization, process type (volume/variety, degree of customization), product type, unionization, plant age or industry (e.g., see Crawford et al., 1988; Sriparavastu and Gupta, 1997; Cua et al., 2001; Shah and Ward, 2003). Unionization and plant age were found not to be as important as common wisdom would suggest (Shah and Ward, 2003). Size and process type seem to be much more important when dealing with firms in the manufacturing industry. A higher level of manufacturing performance was found in larger firms, with lower levels of utilization and greater process orientation (Cua et al., 2001). In addition, the choice of industry can significantly affect the results of the research. Because of this, the applied methodology should be chosen carefully to avoid bias towards certain industrial sectors and to help researchers grasp the essence of the industries examined (Davies and Kochbar, 2002).
Size is the contingency factor that we investigated thoroughly. The proper distinction between small and large firms varies from article to article, but the most common delineation is 250- 500 employees. Differences in size mean different problems for small and large firms. Small firms lack clout with suppliers; their production schedules are less stable. They require extensive training in order to implement lean practices but often do not have the sufficient financial resources for this task. Their organizational structure is less formalized and contains fewer levels, which influences factors such as intra-firm methods of communication (White et al., 1999).
Differences in size have two consequences. First, large manufacturers are more likely to implement lean practices than are small ones (Lowe et al., 1997; White et al., 1999; Shah and Ward, 2003). Second, though small firms may also implement critical elements of LM, the applied practices will, to some extent, be different than the practices in large firms. One
characteristic distinction is the use of multifunctional workers. Small companies cannot afford to employ different workers for every single task, so workers with multifunctional skills will be more welcome (Inman and Mehra, 1990; White et al., 1999; Shah and Ward, 2003).
We used five contingency factors during our research. The first was presented by the data, as the survey was designed for companies operating in the high-tech industry (ISIR 28-35).
Hence, our findings are valid in this industrial context. The second factor was size, which was used as a fundamental factor during the classification of the firms (see in Point 4 below). The remaining three factors were the production system, type of order and type of product. These contingencies are vital for a manufacturing firm and have also been researched previously to a certain extent. Nevertheless, the relationship between these three factors and inventory turnover has not been addressed.
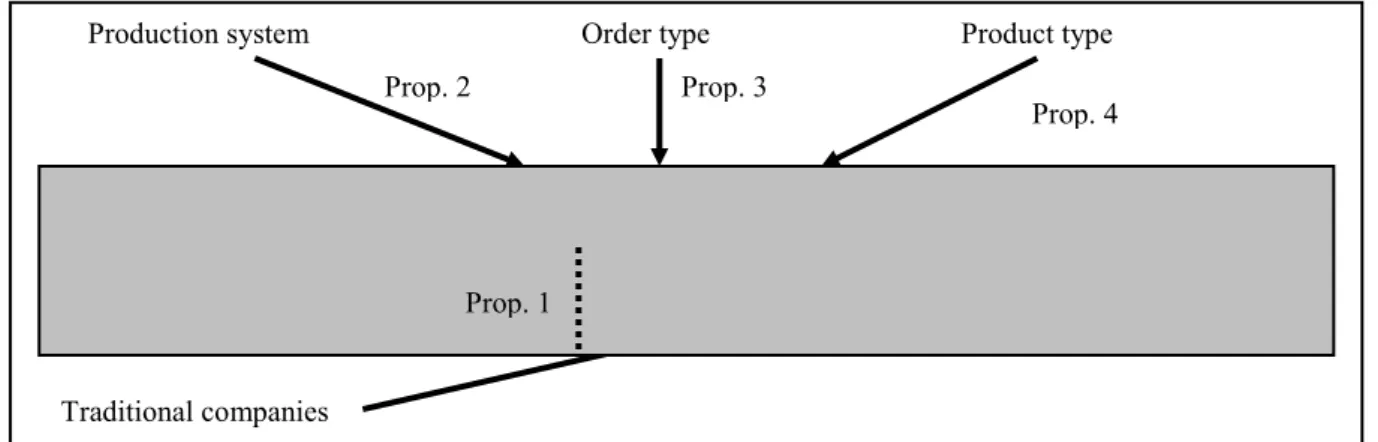
Now we are able to formulate our propositions and research model (Figure 3):
Proposition 1: Companies that use LM practices to a greater extent have lower levels of inventory than do companies that use LM practices less. From now on, we call the companies in the first group lean companies and the companies in the second group traditional companies.
Proposition 2: Inventory turnover is higher in lean companies that use line production systems (cellular layout or dedicated line) to a greater extent.
Proposition 3: Lean companies with make to order (MTO) and assemble to order (ATO) processes are better off in terms of their inventory turnover than are engineering to order (ETO) or make to stock (MTS) companies.
Proposition 4: Producing in batches in lean companies results in higher inventory turnover than does one of a kind or mass production.
Figure 3: The research model
3. The survey
We have used IMSS (the International Manufacturing Strategy Survey) data for our analyses.
IMSS is a global network of researchers with the objective of studying international manufacturing strategies, their implementation, and resulting performance in operations and related areas, such as supply chain management and new product development.
In IMSS, data are collected by national research groups using a standard questionnaire developed by a panel of experts and using the previous editions of the research. The questionnaire is translated, if necessary, into local languages by OM professors. Although there is a suggested method of collecting data (including focusing on better companies;
Lean companies Inventory turnover
Traditional companies
Production system Order type Product type
Prop. 2 Prop. 3
Prop. 4
Prop. 1
searching for companies by mail and/or phone; sending out the questionnaire to one contact person per company, usually a plant or manufacturing manager, in printed form; following up to help and inspire each contact person to fill out the questionnaire), it is up to the national research team to make decisions regarding this procedure.
For further details regarding the survey, see the summary book on IMSS-I (Lindberg et al., 1998) or any of the articles that used data from previous rounds of the survey (e.g., Frohlich and Westbrook, 2001; Acur et al., 2003; Husseini and O’Brian, 2004; Laugen et al., 2005, Cagliano et al., 2006).
The IMSS-IV data bank, the one we use in this paper, extends to 711 valid observations from 23 countries from the period between 2005 February and 2006 March. Altogether, we sent questionnaires to 4251 companies, yielding a response rate of 17% including valid answers only.
Industries are not represented for each country in the sample. Nevertheless, even the smallest industry sample (manufacture of office, accounting and computing machinery, with 16 observations) draws from 8 countries.
The industry and country characteristics of the database can be seen in Tables 1 and 2.
Table 1: Number of observations in various industries in the survey
Manufacture of … Observations
fabricated metal products 270
machinery and equipment 146
office, accounting and computing machinery 16
electrical machinery and apparatus 92
radio, television and communication equipment and apparatus 39 medical, precision and optical instruments, watches and clocks 29
motor vehicles, trailers and semi-trailers 68
other transport equipment 41
Missing 10
Table 2: Geographic distribution of the participating firms
Countries Valid answers Countries Valid answers
Argentina 44 Israel 20
Australia 14 Italy 45
Belgium 32 New Zealand 30
Brazil 16 Netherlands 63
Canada 25 Norway 17
China 38 Portugal 10
Denmark 36 Sweden 82
Estonia 21 Turkey 35
Germany 18 UK 17
Greece 13 USA 36
Hungary 54 Venezuela 30
Ireland 15 Total average 31
4. Methodology
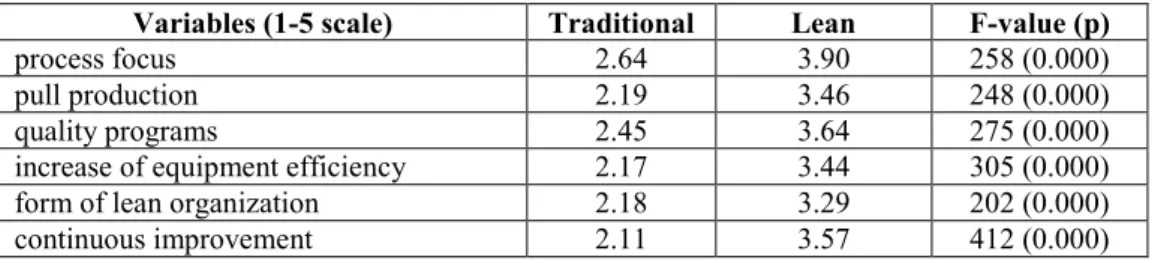
Our main goal was to ascertain find how lean practices affect inventories. In order to investigate this effect, we first had to classify the companies as traditional or lean. For this division, we used the k-means cluster method based on six sets of LM practices: a) process focus, b) pull production, c) quality programs, d) increase in equipment efficiency, e) form of lean organization, and f) continuous improvement. For the exact questions, please refer to Questions 1-3 in the Appendix. It can be seen that these sets of practices cover the four bundles we discussed in the literature review; hence, they can serve as a basis for
differentiating between traditional and lean companies. We expect that the companies in the lean companies cluster use these sets of practices more intensely than do traditional companies, thus earning a higher average score for these sets of practices. Cluster means for the selected items for traditional and lean companies are summarized in Table 3.
Table 3: Cluster means of the manufacturing practices in traditional and lean companies
Variables (1-5 scale) Traditional Lean F-value (p)
process focus 2.64 3.90 258 (0.000)
pull production 2.19 3.46 248 (0.000)
quality programs 2.45 3.64 275 (0.000)
increase of equipment efficiency 2.17 3.44 305 (0.000)
form of lean organization 2.18 3.29 202 (0.000)
continuous improvement 2.11 3.57 412 (0.000)
We call the two groups in question traditional companies and lean companies. The group of traditional companies contained 280 companies, while the lean group contained 330 companies (101 companies did not answer the relevant questions and were omitted).
Based on the literature previously discussed, LM is usually used in large companies. As there are usually significant differences among companies of different sizes in the use of various manufacturing practices (Demeter and Matyusz, 2008), we decided to check the effect of size (based on the number of employees, using the EU standard of 250 employees to create the distinction between small- and medium-sized enterprises (SMEs) and large companies). The results can be seen in Table 4.
Table 4: The relation of company size and leanness
Type/size SME Large Total Traditional 196 84 280
Lean 159 171 330
Total 355 255 610
Although there are many SMEs that can be considered lean according to our criteria, there is a clear tendency to use lean practices more intensively among larger companies. The Chi-test of the size effect (that is, the trend stipulating that it is more possible to find lean companies among large firms) is significant at any level (Chi-value = 29.6, p = 0.000). Thus, in order to see if small companies in the lean group really are lean companies, we collected some measures from the survey that, according to the literature review, count as typical lean measures. Such measures are, for example, the ratio for JIT delivery from suppliers, the ratio for JIT delivery to customers, throughput time efficiency, late delivery, and scrap and rework costs (see Questions 4-6 in the Appendix). Small lean companies should be at least as high- performing in terms of these measures as their traditional competitors. If this does not hold, then our selection criteria for separating the two groups are wrong. We also checked these criteria for large companies. The differences are summarized in Table 5.
Table 5: Performance measures of traditional and lean companies in small and large companies
Small companies Traditional Lean F-test p
Ratio for JIT delivery from suppliers 36.1 42.8 3.2 0.077
Ratio for JIT delivery to customers 47.0 53.1 1.9 0.169
Throughput time efficiency 53.5 49.6 1.0 0.309
Late delivery 10.1 10.9 0.2 0.666
Scrap and rework costs 3.59 3.98 0.3 0.595
Large companies Traditional Lean F-test p
Ratio for JIT delivery from suppliers 26.1 40.5 9.4 0.002
Ratio for JIT delivery to customers 37.1 55.4 11.5 0.001
Throughput time efficiency 38.6 48.7 3.9 0.049
Late delivery 8.46 8.65 0.0 0.918
Scrap and rework costs 3.03 3.26 0.1 0.713
For the most typical lean measures (JIT deliveries, throughput time efficiency) large lean companies perform significantly better (at the p = 0.05 level) than do traditional companies, while in terms of reliability and quality, they are not worse than the others. On the other hand, we did not find any significant difference between small lean and traditional companies in the examined performance measures. Thus, following the literature and our results, we decided that our analysis would only include large companies. This meant that we had 255 companies to compare, of which 84 were traditional and 171 were lean companies.
5. Analysis and results
5.1. LM practices and inventory turnover (Proposition 1)
Our main research question was how LM practices affect inventory turnover. The survey asked about the inventories in terms of number of production days (see Question 7 in the Appendix). Unfortunately, this scaling caused difficulty in calculating inventory turnover in the usual way (365 / inventory days). Several companies indicated that they have inventory that spans zero days, but the real inventory level could be anywhere between zero and one day. We chose not to replace these answers with some arbitrary average number, as a very small change in the number would cause a huge change in inventory turnover (e.g., a 12-hour inventory would mean a yearly inventory turnover of 730, while a 6-hour inventory would mean a turnover of 1460). Therefore, we decided to use inventory day data to characterize inventory turnover. We used correlation analysis for this purpose. The results can be seen in Table 6.
Table 6: LM practices and inventory days
Inventory days Traditional Lean F-test p
Raw material inventory days of production 38.6 24.8 11.58 0.001
Work in process inventory days of production 22.8 15.1 4.37 0.038 Finished product inventory days of production 25.4 13.5 9.67 0.002
On the basis of Table 6, our proposition is supported. Each type of inventory turns faster at large lean companies than at large traditional ones. The greatest differences are on the supply and customer sides of the firm, even though our criteria for separation have been based on the internal manufacturing characteristics of companies (production control, quality, human practices). Nevertheless, the work in process (WIP) inventory based on production days is also lower for lean companies.
5.2. Contingency factors and inventories
Each company is different, however, in the nature of the demand it experiences and in the production system it uses to satisfy its customers, even if they all use lean practices.
Therefore, the important question is how efficient lean practices can be if the conditions are not “ideal” for their use. We examine this question in the following analyses. From now on, we will inspect only large lean companies and try to find the relationship between the various contingency factors (production system, order type, product type) and corporate inventories.
The role of production systems (Proposition 2; see Question 8 in the Appendix)
LM practices usually fit with line production systems; they are not really applicable to job shop environments. Therefore, it is more usual to apply line production (cellular layout or dedicated lines) to LM environments, and inventory turnover is expected to be higher with line production than with job shops. The results can be seen in Table 7.
Table 7: The production system and its relation to inventory days
Job shop Cellular layout Dedicated line
Variable average (%) 18.4 32.0 49.6
Correlations (significance in brackets)
Raw material days of production 0.104 (0.198) -0.021 (0.796) -0.061 (0.448) Work in process days of production 0.228 (0.004) 0.102 (0.207) -0.262 (0.001) Finished goods days of production 0.064 (0.425) 0.117 (0.147) -0.151 (0.061)
The results do not contradict our proposition. The most typical production system in lean companies is the dedicated line, but the other two types also can be identified. The type of production system itself, however, relates significantly only to WIP inventories. The higher the ratio of dedicated lines in companies, the smaller the level of WIP inventories. This is the only type of production, however, that results in a reduced number of WIP inventory days.
Both cellular layout and job shops increase its level, the latter significantly.
The role of order type (Proposition 3; see Question 9 in the Appendix)
One of the objectives of LM is to improve lead times and responsiveness to customer orders.
Thus, lean companies can easily handle make to order (MTO) situations, and we expect to find MTO and assembly to order (ATO) to be the most typical methods of order fulfilment.
Make to stock (MTS) processes should be occurring at a much lower level due to the aim of eliminating waste; this includes finished goods (FG) inventories without customer orders. In addition, engineering to order (ETO) might result in excessive delays in response time.
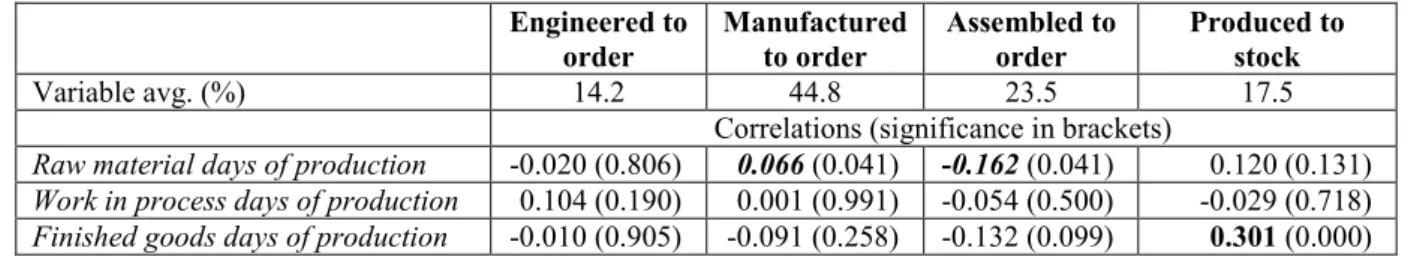
Results can be seen in Table 8.
Table 8: The type of order and its relation to inventory days
Engineered to
order Manufactured
to order Assembled to
order Produced to stock
Variable avg. (%) 14.2 44.8 23.5 17.5
Correlations (significance in brackets)
Raw material days of production -0.020 (0.806) 0.066 (0.041) -0.162 (0.041) 0.120 (0.131) Work in process days of production 0.104 (0.190) 0.001 (0.991) -0.054 (0.500) -0.029 (0.718) Finished goods days of production -0.010 (0.905) -0.091 (0.258) -0.132 (0.099) 0.301 (0.000)
In two-thirds of situations, the products are manufactured or assembled to order. The relationship between order type and inventory is, however, very fuzzy. In the ETO situation, as production is preceded by product development, raw material (RM) is ordered only after the design is accepted by the customer and after production, the FG goes directly to the customer. As a result, the level of RM and FGs can be reduced, which might be the reason for the negative relationship exhibited in Table 8. The specific designs, however, do not make routine work possible in production; the products have to spend more time in the production system than does a mass product on an assembly line. Thus, the higher the ratio of engineered to order products, the higher the amount of work in production process days. Manufactured- to-order products require some RM if they are to be responsive enough to customer orders.
However, as in the case of all other order types where the customer is known, the relationship between FG production days and order type is negative: the higher the ratio of the given order
type (engineered/manufactured/assembled to order) to the total amount of orders, the lower is the level of FG inventories. Production to stock is quite the opposite in this sense. The more standard the product, the lower the level of WIP inventories, although the relationship itself is not significant.
Altogether, there are three significant relationships between inventory days and order type.
MTO is positively related to RM inventory days, but ATO is negatively linked with it. The latter might be true because some preliminary steps have already been done on the products so that they are already in a WIP form, not RM form. This kind of preliminary work is not characteristic in MTO situations. There is a very strong positive relation between the FG inventories and produced to stock situations. The higher the ratio of MTS, the more time FGs spend in inventory.
Looking at the total effect of order type on inventories, one sees that the best alternative seems to be ATO, where all types of inventories spend less time at the company.
The role of product type (Proposition 4 see Question 10 in the Appendix)
Smaller batch size, ideally a batch size of one, is the objective of LM. This does not mean, however, that the goal is one-of-a-kind production. It does mean that companies can produce several kinds of products in smaller or larger batches. The most typical size is a batch, with one-of-a-kind or mass production less often used. The results can be seen in Table 9.
Table 9: The number of products and its relation to inventory days
One of a kind Batch Mass
Variable average (%) 23.4 46.4 30.2
Correlations (significance in brackets)
Raw material days of production 0.079 (0.320) 0.005 (0.949) -0.076 (0.338) Work in process days of production 0.045 (0.573) 0.074 (0.352) -0.116 (0.146) Finished goods days of production -0.153 (0.055) 0.119 (0.137) 0.012 (0.883)
Although the direction of relationship between the type of product and inventory days is the most promising in mass production, there is no significant relationship between the type of product and inventory days.
6. Discussion
LM seems to be a powerful tool for managing inventory turnover. Companies that implement lean practices in manufacturing have significantly better inventory turnover for each type of inventory (RM, WIP and FG) than do traditional companies. Although this result is quite intuitive, not much research supports these facts empirically (Oliver et al., 1996; Schonberger, 2003; Sohal and Egglestone, 1994).
However, even if LM is suggested to be a panacea in several industries and services today, according to our results, its impact can be very different in various contexts (Cua et al, 2001;
Davies and Kochbar, 2002; Shah and Ward, 2003; White et al, 1999). The type of production system has the most significant impact on inventory turnover—in particular, on WIP inventories. The second most significant is the ordering policy applied, which primarily affects inflow and outflow inventories. Finally, product type, or the mass nature of the product (one of a kind, batch or mass) itself does not seem to directly influence inventory turnover.
The latter does not necessarily mean, however, that there is not an indirect relationship between product type and inventory turnover.
If we think about the product-process matrix, then our results suggest that there is a mismatch between products and processes: we found direct relationships between processes and inventories but no relationship between products and inventories.
Classical LM uses a cellular layout in order to maintain the flexibility of production while improving resource utilization (Chase et al, 2006). Nevertheless, the most popular type of production among lean companies in our sample is dedicated line product. If we set aside the literature, this result seems understandable. Line production necessarily requires a smaller WIP inventory, as the product types and, thus, components are fewer and the flow is more continuous. Since we investigated large companies, they might have large enough demand to justify dedicated lines instead of manufacturing cells. Indeed, this seems appropriate if, as indicated by our results, dedicated lines work with the highest WIP inventory turnover as compared to job shops or cellular layout. That is, if we want to reduce WIP inventory, then the best option is to use dedicated lines (higher inventory turnover) and the worst one is to work in job shops (lower inventory turnover). Cellular manufacturing does not have any significant influence on inventory turnover. What are the managerial implications of these results? If we have several products that can be organized in product families and thus in manufacturing cells, then we can avoid the negative consequences of job shops by organizing manufacturing cells for the same portfolio of products. However, if the volume is large enough, then it is worthwhile to go further and build dedicated lines for products. Of course, our logic is valid only from the inventory turnover point of view, as we did not analyze other performance measures.
Another contingency that we investigated is the ordering policy used. As one of the objectives of LM is to reduce lead times and thus produce exactly what the customer wants (pull), the most frequent ordering policy is MTO. However, very few companies have such a short lead time that they start the whole production process only when the customer order takes place.
Thus, many lean companies put the decoupling point closer to the customer and do some preliminary production. The other two policies (ETO and MTS) are less frequent in lean companies (Chase et al, 2006).
While the type of production system influences WIP inventories the most, the ordering policy impacts RM and FGs the most in lean companies. Looking at the behavior of inventory turnover under various ordering policies, one sees that the best policy is ATO, which significantly increases RM inventory turnover and also reduces FG inventories (although the significance level is very weak). This means that ATO systems can work from the lower level of inventories and deliver FG to customers as soon as possible. This result does not necessarily come from the ordering policy itself. ATO policy is usually connected to a standardized product portfolio, where product customization takes place only in the last stages of production, so the number of components is relatively low compared to the type of products produced. Although MTO policy does not seem to be very dissimilar to ATO, its impact on inventory turnover is just the opposite. In MTO environments, companies have to preserve a wide portfolio of RM in order to satisfy incoming customer orders as soon as possible, as in MTO, the delivery time is usually a critical performance indicator. ETO, on the other hand, usually allows longer lead times for companies, and while development processes are taking place, the purchasing processes can be executed. As a result, the level of RM inventory is lower than for MTO. Finally, MTS requires by far the highest level of FG inventories, as these enterprises have to be ready to fulfil any order from stock by definition.
The most important point that we can glean from this analysis is that standardizing products and postponing product proliferation is worthwhile if we want to increase RM inventory turnover.
The third contingency examined is the mass character of products. We expected that, in an LM environment, batch production would be the method most often employed, but that, in the case of large demand, mass production would also be possible. This expectation was valid;
however, the mass character of the products only had one significant impact on inventory turnover. The exception emerged for one-of-a-kind products, which are weakly correlated
with FG inventories. This is quite understandable, as producing items one by one means we know exactly for whom we are producing the given product, so that it is usually delivered to the customer right after it is finished.
Altogether, the results we have can be easily explained and fit the logic of LM. We consider it an important contribution, however, that the contingencies we found seem to have a very clear impact on the various forms of inventories. The production system affects the level of WIP inventories, while the ordering policy used affects the RM and FG inventories. As a result, if companies want to improve their inventory turnover, they have to know which type of inventory they want to address in order to find the right step to take.
7. Conclusions and further research
We can draw several conclusions from this analysis. First, we found a significant relationship between LM practices and inventory turnover. Lean companies keep fewer inventories of any type. In addition, LM practices were mostly applied in environments described in lean theory.
Concerning contingency factors, we found that different types of inventories are sensitive to different contingency factors. WIP is affected strongly by the production system, while RM and FG are affected by the type of order. This link further emphasizes the importance of proper decoupling point placement in the supply chain. Product type, however, does not influence the efficiency of inventory management. It is important to note that if we focus on inventory turnover, cellular manufacturing may not be the best facility layout (though this layout is widely regarded as the one that suits LM best).
One limitation of our paper is the industrial context. The IMSS-IV survey was distributed to companies in the high-tech industry (ISIR 28-35), so our results can be fully applied only within these industries.
In further research, it may worth examining the differences among the individual industries of the ISIR 28-35 industries. In addition, our model could be extended to include other business performance indicators. In this way, we could see whether there is a direct relationship between inventory turnover and business performance or whether this effect is not that strong in itself.
Another possible method of further research would be to verify whether a product-process mismatch does really exist at such companies. As we mentioned in the discussion section, we found a relationship between the processes and inventories we examined, but there was no relationship between the product types and inventories. This may have been caused by some kind of product-process mismatch, in which case this question should be addressed.
Acknowledgement
This research was supported by the Hungarian Scientific Research Fund (OTKA T 76233) and the János Bolyai Research Fellowship Program.
References
Acur, N. – Gertsen, F. – Sun, H. – Frick, J., 2003. The Formalisation of Manufacturing Strategy and Its Influence on the Relationship between Competitive Objectives, Improvement Goals, and Action Plans.
International Journal of Operations and Production Management 23 (10), 1114-1141.
Bruun, P. – Mefford, R. N., 2003. Lean production and the Internet. International Journal of Production Economics (89), 247-260.
Cagliano, R. – Caniato, F. – Spina, G., 2006. The linkage between supply chain integration and manufacturing improvement programmes. International Journal of Operations and Production Management 26 (3), 282-299.
Chase, R. B. – Jacobs, F. R. – Aquilano, N. J., 2006. Operations Management for Competitive Advantage. The McGraw-Hill Company, New York, USA
Crawford, K. M. – Blackstone, J. H. Jr. – Cox, J. F., 1988. A study of JIT implementation and operating problems. International Journal of Production Research 26 (9), 1561-1568.
Cua, K. O. – McKone, K. E. – Schroeder, R. G., 2001. Relationships between implementation of TQM, JIT, and TPM and manufacturing performance. Journal of Operations Management 19, 675-694.
Dal Pont, G – Furlan, A. – Vinelli, A., 2008. Effects on performance of lean bundles. Proceedings on the 15th EurOMA Conference, University of Groningen, The Netherlands, 15-18 June 2008 (available on CD)
Davies, A. J. – Kochbar, A. K., 2002. Manufacturing best practice and performance studies: a critique.
International Journal of Operations and Production Management 22 (3), 289-305.
De Toni, A. – Tonchia, S., 1994. Lean organozation, management by process and performance measurement.
International Journal of Operations and Production Management 16 (2), 221-236.
Demeter, K. – Matyusz, Zs., 2008. The impact of size on manufacturing practices and performance. Proceedings on the 15th International Annual EurOMA Conference, University of Groningen, The Netherlands, 15-18 June 2008 (available on CD)
Fillingham, D., 2007. Can lean save lifes? Leadership in Health Services 20 (4), 231-241.
Flynn, B. B. – Sakakibara, S. – Schroeder, R. G., 1995. Relationship between JIT and TQM: practices and performance. Academy of Management Journal 38 (5), 1325-1360.
Forza, C., 1996. Work organization in lean production and traditional plants. What are the differences?
International Journal of Operations and Production Management 16 (2), 42-62.
Frohlich, M. T. – Westbrook, R., 2001. Arcs of integration: an international study of supply chain strategies.
Journal of Operations Management 19, 185-200.
Hines, P. – Holweg, M. – Rich, N., 2004. Learning to evolve. A review of contemporary lean thinking.
International Journal of Operations and Production Management 24 (10), 994-1011.
Huson, M. – Nanda, D., 1995. The impact of just-in-time manufacturing on firm performance in the US. Journal of Operations Management 12 (3,4), 297-311.
Husseini, S. M. M. – O'Brien, C., 2004. Strategic implications of manufacturing performance comparisions for newly industrialising countries. International Journal of Operations & Production Management 24 (11), 1126- 1148.
Imai, M., 1998. Will America’s corporate theme song be just in time? Journal of Quality Participation 21 (2), 26- 28.
Inman, R. A. – Mehra, S., 1990. The transferability of just-in-time concepts to American small businesses.
Interfaces 20 (2), 30-37.
Karlsson, C. – Ahlstrom, P., 1996. Assessing changes towards lean production. International Journal of Operations and Production Management 16 (2), 24-41.
Laugen, B. T. – Acur, N. – Boer, H. – Frick, J., 2005. Best manufacturing practices. What do the best- performing companies do? International Journal of Operations and Production Management 25 (2), 131-150 . Lewis, M. A., 2000. Lean production and sustainable competitive advantage. International Journal of Operations and Production Management 20 (8), 959-978.
Lindberg, P. – Voss, C. A. – Blackmon, K., 1998. International Manufacturing Strategies. Context, Content and Change. Kluwer Academic Publishers, Dordrecht
Lowe, J. – Delbridge, R. – Oliver, N., 1997. High-Performance Manufacturing: Evidence from the Automotive Components Industry. Organization Studies 18 (5), 783-798.
Macduffie, J. P., 1995. Human Resource Bundles and Manufacturing Performance: Organizational Logic and Flexible Manufacturing Systems in the World Auto Industry. Industrial and Labor Relations Review 48 (2), 197- 221.
McKone, K. E. – Schroeder, R. G. – Cua, K. O., 2001. The impact of total productive maintenance practices on manufacturing performance. Journal of Operations Management 19, 39-58.
Oliver, N. – Delbridge, R. – Lowe, J., 1996. Lean Production Practices: International Comparisons in the Auto Components Industry. British Journal of Management 7, Special Issue, S29-S44
Sakakibara, S. – Flynn, B. B. – Schroeder, R. G. – Morris, W. T., 1997. The Impact of Just-in-Time Manufacturing and Its Infrastructure on Manufacturing Performance. Management Science 43 (9), 1246-1257.
Schonberger, R. J., 2003. The right stuff, revisited. http://www.mbtmag.com/article/CA321989.html (date of download: 15 August 2008)
Shah, R. – Ward, P. T., 2003. LM: context, practice bundles, and performance. Journal of Operations Management 21, 129-149.
Sohal, A. S. – Egglestone, A., 1994. Lean Production: Experience among Australian Organizations. International Journal of Operations and Production Management 14 (11), 35-51.
Spear, S. J., 2004. Learning to lead Toyota. Harvard Business Review 82 (5), 78-86.
Sriparavastu, L. – Gupta, T., 1997. An empirical study of just-in-time and total quality management principles implementation in manufacturing firms in the USA. International Journal of Operations and Production Management 17 (12), 1215-1232.
Vastag, Gy. – Whybark, D. C., 2005. Inventory management: Is there a knock-on effect? International Journal of Production Economics 93-94, 129-138.
Voss, C. A., 1995. Alternative paradigms for manufacturing strategy. International Journal of Operations &
Production Management 15 (4), 5-16.
Voss, C., 2007. The evolution of best practices in operations. Managing Operations in an Expanding Europe - Proceedings on the 14th International Annual EurOMA Conference, Ankara, Turkey.
White, R. E. – Pearson, J. N. – Wilson, J. R., 1999. JIT Manufacturing: A Survey of Implementations in Small and Large U.S. Manufacturers. Management Science 45 (1), 1-15.
Womack, J. P. – Jones, D. T. – Roos, D., 1990. The machine that changed the world. HarperPerennial, NY, USA Womack, J. P. and Jones, D. T., 1996. Lean thinking – Banish waste and create wealth in your corporation.
Simon&Schuster UK Ltd, 2003
Appendix – Original questions from the survey
Q1-Q3. Indicate degree of the following action programmes undertaken over the last three years and planned efforts for the coming three years.
Degree of use last 3 years None High
Q1 group 1 2 3 4 5 Restructuring manufacturing processes and layout to obtain process focus and streamlining (e.g., reorganize plant-within -a-plant; cellular layout, etc.) 1 2 3 4 5 Undertaking actions to implement pull production (e.g., reducing batches,
setup time, using kanban systems, etc.),
Q2 group 1 2 3 4 5 Undertaking programs for quality improvement and control (e.g., TQM programs, 6 projects, quality circles, etc.)
1 2 3 4 5 Undertaking programs for the improvement of your equipment productivity (e.g., Total Productive Maintenance programs)
Q3 group 1 2 3 4 5 Implementing the Lean Organisation Model by e.g., reducing the number of levels and broadening the span of control.
1 2 3 4 5 Implementing Continuous Improvement Programs through systematic initiatives (e.g., kaizen, improvement teams, etc.)
Q4. What proportion of your raw materials and components are delivered to you Just-In-Time? __________ % Q5. What proportion of your end products do you deliver Just-In-Time? __________ %
Q6. What is the current performance level on the following dimensions?
Throughput Time Efficiency (defined as the time the products are worked on as a % of the total manufacturing lead time – i.e., start of first operation to finish of last operation)? _______%
Late deliveries to customers (as percentage of orders delivered)? _______%
Scrap and rework costs (as percentage of sales) _______%
Q7. How many days of production (on average) do you carry in the following inventories:
_______ Raw material/components _______ Work-in-process _______ Finished goods Q8. To what extent are your manufacturing activities organized in the following layout categories: (indicate
percentage of total volume)
Process layout
Job shop _____ %
Cellular layout* _____ %
Dedicated lines _____ %
100 %
(*) Note: A “cell” is a grouping of equipment dedicated to support the production of families of parts sharing similar process operations.
Q9. What proportion of your customer orders are (NB: the percentages should add up to 100 %):
Customer orders
Designed/engineered to order _____ %
Manufactured to order _____ %
Assembled to order _____ %
Produced to stock _____ %
100 %
Q10. To what extent do you use one of the following process types (percentage of total volume)?: (NB:
percentages should add up to 100 %) Process type
One of a kind production _____ %
Batch production _____ %
Mass production _____ %
100 %