1
Improvement of waste-fed bioelectrochemical system performance by
1
selected electro-active microbes: Process evaluation and a kinetic study
2
3
László Koók, Nicolett Kanyó, Fruzsina Dévényi, Péter Bakonyi*, Tamás
4
Rózsenberszki, Katalin Bélafi-Bakó, Nándor Nemestóthy
5
6
Research Institute on Bioengineering, Membrane Technology and Energetics,
7
University of Pannonia, Egyetem u. 10, 8200 Veszprém, Hungary
8
9 10
*Corresponding Author: Péter Bakonyi
11
Tel: +36 88 624385
12
Fax: +36 88 624292
13
E-mail: bakonyip@almos.uni-pannon.hu
14 15
2
Abstract
16
In this work, bioaugmentation strategy was tested to enhance electricity
17
production efficiency from municipal waste liquor feedstock in microbial fuel
18
cells (MFC). During the experiments, MFCs inoculated with a mixed anaerobic
19
consortium were enriched by several pure, electro-active bacterial cultures
20
(such as Propionibacterium freudenreichii, Cupriavidus basilensis and
21
Lactococcus lactis) and behaviours were assessed kinetically. It turned out
22
that energy yield could be enhanced mainly at high substrate loadings.
23
Furthermore, energy production and COD removal rate showed an optimum
24
and could be characterized by a saturation range within the applied COD
25
loadings, which could be elucidated applying the Monod-model for describing
26
intracellular losses. Polarization measurements showed the positive effect of
27
bioaugmentation also on extracellular losses. The data indicated a successful
28
augmentation process for enhancing MFC efficiency, which was utmost in
29
case of augmentation strain of Propionibacterium freudenreichii.
30 31
Keywords: bioaugmentation, microbial fuel cell, Propionibacterium
32
freudenreichii, Cupriavidus basilensis, Lactococcus lactis
33 34
3
1. Introduction
35 36
Microbial fuel cell (MFC) technology can be considered as a rapidly
37
developing alternative for generating electricity using electro-active
38
microorganisms from the chemical energy stored in organic substrates [1 – 3].
39
As various research works demonstrated, besides easy-degradable materials,
40
waste streams may also be utilized in MFCs as feedstock for electricity
41
production [4, 5] e. g. synthetic human blackwater [6], industrial wastewaters
42
[7 – 9], landfill leachate [10] or municipal solid waste [11]. Although in practice
43
MFCs are typically operated with a mixed consortium in the anode chamber, a
44
considerable number of pure cultures have been also tested including different
45
Gram-negative/Gram-positive bacteria, yeasts and algae [12, 13]. In general,
46
such single-strain MFCs are suitable for fundamental research and have
47
limitations for real-field applications due to strict sterility requirements.
48
Nevertheless, they can be viewed as potential candidates for the
49
augmentation of mixed culture MFCs.
50
Bioaugmentation is a well-known strategy for process enhancement (i.e.
51
aiming at the efficient removal of specific components) and relies on the
52
addition of selected microbial species to an initial – mostly natural – microbial
53
consortia/environment [14, 15]. The target compounds to be converted vary
54
widely and can include oil-based contaminations, polycyclic aromatic
55
hydrocarbons (PAHs), phenol, etc. according to the scientific literature [16 –
56
18]. Moreover, microbial augmentation can be advantageous not only in terms
57
of specific substrate degradation but also to improve biofuel (e. g. biogas or
58
biohydrogen) formation as well as integrated applications designed by
59
coupling fermentation and bioelectrochemical treatment [19, 20]. The
60
bioaugmentation in microbiologically-assisted electrochemical systems has
61
been demonstrated with success (i.e. to utilize corn stover [21] or synthetic
62
wastewater [22]) by exploiting specific syntrophic processes and hierarchical
63
structures present in such systems in order to boost electricity generation [23].
64
So far, electro-kinetic analysis of MFCs augmented with Shewanella haliotis
65
4
[22] showed the positive effect of this technique on the grounds of power
66
output and substrate biodegradation. The observed benefits could be mainly
67
attributed to lower activation losses and enhanced shuttling between redox
68
intermediates [22]. In another paper applying electro-active Pseudomonas
69
aeruginosa and non-electro-active Escherichia coli strains for bioaugmentation
70
in MFCs, it could be concluded that the bioelectrochemical cells had taken
71
advantage of synergistic species interactions in the mixed consortia, leading to
72
lower polarization resistance and increased power generation capacity [24].
73
In this work, bioaugmentation of MFCs was carried out by employing
74
pure isolates of electro-active bacteria, namely Propionibacterium
75
freudenreichii, Cupriavidus basilensis and Lactococcus lactis, which to our
76
knowledge, have not been used for this this purpose. P. freudenreichii is a
77
Gram-positive obligate anaerobic bacteria belonging to the phylum
78
Actinobacteria and known as an endogenous mediator-producing strain.
79
Actually, 1,4-dihydroxy-2-naphthoic acid (DHNA) and 2-amino-3-dicarboxy-
80
1,4-naphthoquinone (ACNQ) are reported as electron shuttle molecules,
81
secreted by P. freudenreichii [25, 26] which allow its application in mediator-
82
less MFC systems [27]. C. basilensis is a flagellated Gram-negative,
83
facultative aerobic -proteobacteria [28] and able to the utilize substances e.g.
84
phenol or aliphatic alcohols as substrates [29, 30]. The members of this genus
85
are described to be capable of producing endogenous mediators for
86
extracellular electron transfer [30, 31]. Since C. basilensis is metal-resistant
87
and able to degrade a wide range of materials, its use seems to be promising
88
in wastewater treatment as well as in bioelectrochemical technologies. L.
89
lactis, a member of phylum Firmicutes, is a Gram-positive, facultative
90
anaerobic bacterium with a potential as a biocatalyst in microbial
91
electrochemical cells because of its self-secreted electron accepting and
92
shuttling agent, ACNQ [32, 33]. Furthermore, its important trait is the capability
93
of pursuing electrochemically-modified metabolic pathway besides homolactic
94
fermentation, which leads to the formation of acetate (as by-product) to be
95
5
consumed by other i.e. exoelectrogenic microorganisms present in an
96
augmented bioelectrochemical reactor [33].
97
To our best knowledge, no comparative study has been done yet with
98
these microbes to investigate bioaugmentation process in MFCs that involves
99
a kinetic approach for the assessment of system behaviour in the course of
100
waste utilization. Therefore, the results demonstrated may have novelty and
101
added-value to support the better understanding of bioaugmentation in MFCs
102
and expand the perspectives of such bioelectrochemical cells.
103 104
2. Materials and methods
105 106
2.1. Seed source and substrates
107 108
For MFC inoculation, seed source was collected from beet pulp utilizing
109
biogas fermentation unit of Hungarian sugar factory, located at Kaposvár, with
110
an initial microbial community structure demonstrated in our recent work [34].
111
The anaerobic sludge was pretreated (starved) in a laboratory-scale reactor
112
before use for one week at 37 °C. Its main characteristics were the followings:
113
COD content: 12 g L-1, pH = 7.8, Total solids: 6.7 %. As for substrate, pressed
114
fraction of municipal solid waste (LPW) was used. Characteristics of LPW can
115
be found in previous publications [11, 35 – 37]. The most important
116
parameters of the substrate and the flow diagram of its preparation process
117
can be seen in Fig. 1.
118 119
6
2.2. Preparation of pure cultures of selected electro-active microbes for
120
bioaugmentation
121 122
The pure cultures of selected microbes were purchased from the
123
German Collection of Microorganisms and Cell Cultures (DSMZ). The broth
124
media compositions were the followings: Lactococcus lactis (DSMZ-20481)
125
broth – casein peptone (pancreatic digest) 17 g L-1, K2HPO4 2.5 g L-1, glucose
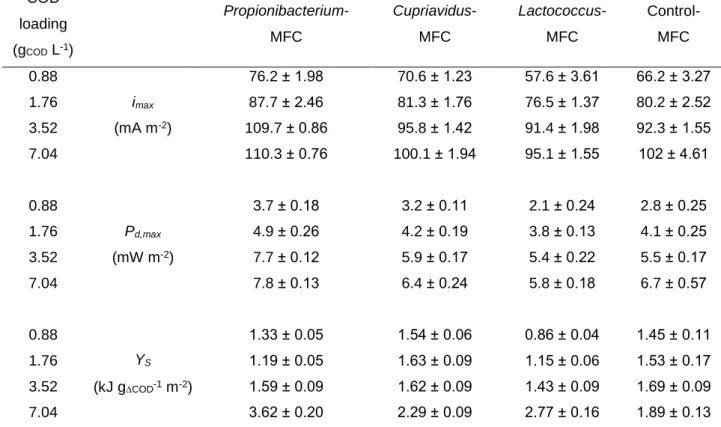
126
2.5 g L-1, NaCl 2.5 g L-1, soy peptone (papaic digest) 3 g L-1, yeast extract 3 g
127
L-1, agar 20 g L-1 (pH = 7); Cupriavidus basilensis (DSMZ-11853) broth –
128
peptone 5 g L-1, meat extract 3 g L-1, agar 20 g L-1 (pH = 7); Propionibacterium
129
freudenreichii (DSMZ-20271) broth – casein peptone (tryptic digest) 10 g L-1,
130
yeast extract 5 g L-1, Na-lactate 10 g L-1, agar 20 g L-1 (pH = 7).
131
The cultures were incubated on agar plates – and in stab agar in case of
132
P. freudenreichii – for two days at 37 °C. Thereafter, colonies were harvested
133
and transferred to liquid media (50 mL, without agar) and incubated for two
134
more days under the same conditions. Before use in MFCs, the cell
135
concentration of liquid cultures was determined by Bürker’s chamber.
136 137
2.3. MFC design and setup
138 139
The design of dual-chamber microbial fuel cells was adopted from our
140
previous work [38]. In this MFC construction, anode and cathode
141
compartments (with 60 mL total volume) were equipped with carbon cloth
142
(Zoltek Corp., USA) and Pt-C (0.3 mg cm2 Pt content, FuelCellsEtc, USA)
143
electrodes (64 cm2 apparent surface area), respectively. The anode and
144
cathode were connected by Ti wire (Sigma-Aldrich, USA) to the external
145
circuit, containing a 100 Ω resistor. The chambers were separated by Nafion
146
115 proton exchange membrane (Sigma-Aldrich, USA) with diameter of 4.5
147
cm. Before use, the membrane was activated as described elsewhere [38]. In
148
order to maintain aerobic conditions, air was continuously supplemented to the
149
cathode compartment.
150
7
The anode side of MFCs was filled with 50 mL of mesophilic sludge (pH
151
adjusted to 7) and 5 mL of individual, pure strain liquid culture. Based on cell
152
counting and prior to loading, the liquid cultures were diluted to provide equal
153
cell concentration for each bioaugmented reactors. Thus, initial cell
154
concentration of 3.23 x 10⁷ ± 2.6 x 10⁶ cells mL-1 could be reached and
155
maintained in the liquid (5 mL) samples employed for bioaugmentation,
156
irrespective of the strain. The anode chamber was then purged with high purity
157
nitrogen gas to remove dissolved oxygen and ensure anaerobic conditions. In
158
the cathode chamber, 50 mM phosphate buffer (pH = 7) was used as
159
electrolyte. The MFC reactors were running at 37 °C. In addition to the
160
bioaugmented reactors, control MFCs started-up only with (55 mL) inoculum
161
(50 mL sleed sludge + 5 mL phosphate buffer) was established, as well.
162
Substrate (LPW, Section 2.1.) additions (0.5, 1, 2 and 4 mL, depending on the
163
aimed COD loading) were carried out by using batch operational mode, after
164
the adaptation phase has been successfully performed (Section 3.1.). During
165
each injection of LPW, the appropriate amount of anolyte was drawn
166
(exchange of volumes) to ensure a consistent working volume. Once the
167
observed voltage dropped close to the initial (Fig. 2), a new feeding cycle
168
could be commenced [34].
169 170
2.4. Analysis and calculations
171 172
Cell voltage (U) was measured and monitored through a 100 Ω external
173
resistor by a data acquisition system (National Instruments, USA) in Labview
174
environment. According to Ohm’s law, current (I) (and electric power, P) were
175
computed. Cell polarization measurements were carried out by varying the
176
resistors in the external circuit of MFCs between 3.3 kΩ – 10 Ω. From the
177
linear region of voltage vs. polarization current density (imax,P) plots, the overall
178
internal cell resistance (Ri) – as the slope of the fitted trendline – could be
179
derived.
180
The energy yield was calculated according to Eq. 1:
181
8 182
𝑌𝑆 = 𝐸
𝑚∆𝐶𝑂𝐷 𝐴 (1)
183
184
where A is the apparent anode surface area (m2), E is the cumulated energy
185
(kJ) derived from the integration of P – t curves, mCOD is the quantity of COD
186
removed (gram) during a given cycle. The COD content of particular samples
187
was analyzed in accordance with our previous paper [39] by relying on the
188
standard methods of APHA.
189
The rates of (i) Energy production and (ii) COD removal were computed
190
according to Eqs. 2 and 3, respectively, considering the operation time of
191
given batch cycles ():
192 193
𝜈𝐸 = 𝐸
𝐴 𝜏 (2)
194
195
𝜈𝑆 =𝑚∆𝐶𝑂𝐷
𝑉 𝜏 (3)
196
197
The effect of substrate concentration on current generation – and thus,
198
intracellular losses – was evaluated by adopting the principles of Monod model
199
[40]. In this model the relation of the two variables (substrate concentration
200
and current density) can be described by Eq. 4.
201 202
𝑖 = 𝑖𝑚𝑎𝑥 [𝑆]
𝐾𝑆,𝑎𝑝𝑝+[𝑆] (4)
203
204
where i denotes the current density (relative to the apparent anode surface
205
area), KS,app is the apparent half-saturation substrate concentration (half-
206
saturation constant) and [S] is the substrate (LPW) concentration. To estimate
207
the kinetic parameters (imax and KS,app) the linearized (double-reciprocal) form
208
of Eq. 4 was applied, as represented in Eq. 5.
209 210
9
1
𝑖 = 𝐾𝑆,𝑎𝑝𝑝
𝑖𝑚𝑎𝑥[𝑆]+ 1
𝑖𝑚𝑎𝑥 (5)
211
212
In the model (Eqs. 4 and 5), [S] is given in the unit of e- eq L-1, considering 8 g
213
COD as equivalent of 1 mol e- [40].
214
The determination of mean values and standard deviations/errors for
215
parameters such as imax, Pd,max, YS, S, E, etc. appearing throughout this work
216
(i.e. Table 1) was carried out as detailed in the Supplementary file (Fig. 1S).
217 218
3. Results and Discussion
219 220
3.1. Evaluation of bioaugmentation efficiency in MFC – peak current and
221
power densities, energy yield
222 223
In the first part of operation – considered as the acclimation period – 5
224
mM acetate was added in the MFCs as adapting substrate in consecutive
225
cycles until comparable current density profiles in particular reactors were
226
reached over time (after three weeks) [41]. Afterwards, feeding of stabilized
227
MFCs was commenced with LPW and the measurements were dedicated to
228
examine the impact of bioaugmentation. The MFCs were operated with
229
different amounts of LPW in the range of 0.5 – 4 mL (equivalent to 0.88 – 7.04
230
gCOD L-1). The most important parameters of each system tested are
231
summarized in Table 1 (average output values and standard deviations for the
232
individual feeding processes) and the current density profiles can be seen in
233
Fig. 2.
234
In terms of highest attainable current and power densities (noticed at the
235
highest LPW supplementation, 7.04 gCOD L-1), the MFCs could be ranked in the
236
following order: Propionibacterium-MFC (76.2 – 110.3 mA m-2 / 3.7 – 7.8 mW
237
m-2, respectively), Cupriavidus-MFC (70.6 – 100.1 mA m-2 / 3.2 – 6.4 mW m-2),
238
Control-MFC (66.2 – 102 mA m-2 / 2.8 – 6.7 mW m-2) and Lactococcus-MFC
239
(57.6 – 95.1 mA m-2 / 2.1 – 5.8 mW m-2). Interestingly, in the light of already
240
published literature relevant to the latest strain, L. lactis, though Freguia et al.
241
10
[33] achieved proper operation of MFCs using its monoculture to generate
242
current from glucose, no electrogenic activity in MFCs was found by
243
Rosenbaum et al. [42] with L. lactis alone on the same substrate. Interestingly,
244
however, co-cultures of Shewanella oneidensis and L. lactis were able to
245
produce current (64 – 215 mA m-2) from this substance [42]. Hence, it can be
246
implied that the behaviour of L. lactis is dependent on factors such as the
247
composition of underlying community structure (i.e. the number and features of
248
other bacteria to live and cooperate with), which is likely true for C. basilensis
249
and P. freudenreichii as well. To assess such aspects (i.e. how the
250
microbiological background of the sludge inoculum influences the integration
251
of particular cultures into the community) the population dynamics should be
252
tracked via molecular biological tools, which should be the subject of a follow-
253
up study.
254
Ys, as expressed in Eq. 1, is an appropriate response variable to make
255
comparison between the systems from the point of view of cumulative energy
256
recovery efficiency. According to the results, an LPW (substrate)
257
concentration-dependent variation of Ys was found in all cases, where at low
258
COD loadings (0.88 and 1.76 gCOD L-1) only the Cupriavidus-MFC could
259
surpass the Control-MFC. In case of Propioni-, Cupriavidus- and Control-
260
MFCs, nearly equal energy yields (1.59, 1.62 and 1.69 kJ gCOD-1 m-2,
261
respectively) could be observed at middle COD loading of 3.52 gCOD L-1.
262
Nevertheless, by further increasing the COD loading to the highest value of
263
7.04 gCOD L-1, energy yields were significantly improved in all bioaugmented
264
MFCs in comparison with the Control-MFC. As a matter of fact, increment of
265
Ys relative to the control reactor was 91 %, 47 % and 21 % for Propioni-,
266
Lactococcus- and Cupriavidus-MFCs, respectively (Table 1).
267
Overall, from the process evaluation considering peak current and
268
power densities as well as energy yield, it would appear that the obligate
269
anaerobic P. freudenreichii was the most promising among the strains for
270
augmentation under the experimental circumstances provided.
271 272
11
3.2. On energy production and COD removal rates
273 274
Trends of Coulombic efficiency (CE) (derived in accordance with Logan
275
et al. [3] considering the amount of COD removed) as a function of COD
276
loading can be observed in Fig. 3, which implies that bioaugmentation had an
277
advantageous effect on CE at every operating point. The difference between
278
CEs was less pronounced at the lowest COD loading where CE obtained to be
279
about 1.3 – 1.8 %. Nevertheless, by increasing the COD loading, the
280
increment in CE values of the augmented MFCs became more and more
281
emphasized compared to the control and by reaching the highest loading (7.04
282
gCOD L-1), the Propionibacterium-, Cupriavidus- and Lactococcus-MFC
283
exceeded the CE of Control-MFC by 129, 35 and 50 % (with corresponding
284
CEs of 3.88 ± 0.21 %, 2.28 ± 0.1 % and 2.52 ± 0.14 % versus 1.69 ± 0.12 %),
285
respectively. CEs in the same order of magnitude had been obtained in our
286
previous work, demonstrating a sequential anaerobic treatment process
287
(biohydrogen fermentation – biogas generation – microbial fuel cell) for the
288
enhancement of overall energy recovery from LPW as feedstock [37].
289
To assess the MFC efficiency, not only the total achievable energy
290
yields (product) and COD (substrate) removals are to be considered but
291
corresponding rates as well since the process should be accomplished within
292
a reasonable time. Consequently, an evaluation based on reaction rate-like
293
variables defined in Eqs. 2 and 3 is of importance.
294
As it is depicted in Fig. 4, similar relationship could be established
295
between energy production rate (E) and COD loadings for all MFCs until 3.52
296
gCOD L-1 concentration. However, at the highest COD dose (7.04 gCOD L-1), E in
297
the bioaugmented cells was declined and hence, a peak E value could be
298
noted within the COD range investigated. The phenomena that decreased E
299
was observed in case of bioaugmented cells at 7.04 gCOD L-1 (than at 3.52 gCOD
300
L-1) is attributed to the nonlinear increase of operation times for batch cycles. It
301
is also to notice in Fig. 4 that there was a considerable difference of E
302
between the systems at 3.52 gCOD L-1 concentration, leading to a 47 % faster
303
12
energy recovery rate by the most efficient Propionibacterium-MFC compared
304
to the control (non-bioaugmented) reactor (482 and 327 J m-2 d-1,
305
respectively). However, at highest COD addition (7.04 gCOD L-1), more or less
306
similar E was found for all MFCs This suggests the existence of substrate
307
(COD) saturation range where although more organic matter is available, the
308
reaction rate is not further enhanced in a proportional way due to fully
309
exploited capacity of exoelectrogens present in MFCs. A basically similar
310
discussion can be mead concerning the data related to COD (substrate)
311
removal rates (S), as illustrated in Fig. 5. The fact that tendencies in E and S
312
are analogous can be explained by concurrent product (energy) formation and
313
substrate (COD in LPW feedstock) consumption. In essence, at 3.52 gCOD L-1,
314
the maximum S was attained with the Propionibacterium-MFC, being 31 %
315
higher than for the Control-MFC (5.52 and 4.2 g L-1 d-1, respectively). The S
316
values (between 1 – 5.52 g L-1 d-1, depending on the actual COD loading) are
317
comparable to the relevant literature, where for example Raghavulu et al. [22]
318
demonstrated S of 0.41 g L-1 d-1 by using S. haliotis as augmentation species.
319
In another publication, S of 0.59 g L-1 d-1 could be reached with P. aeruginosa-
320
augmented MFCs, which was 11 % greater than the non-augmented system
321
demonstrating S = 0.53 g L-1 d-1 [24]. Moreover, phenol-utilizing (pure culture)
322
C. basilensis-MFC could be characterized by roughly one order of magnitude
323
lower COD removal rate (S ≈ 0.05 g L-1 d-1) [32].
324
It is noteworthy that E and S are representative for a whole batch cycle,
325
during which, however, various stages of both product formation and substrate
326
removal can be distinguished. These, in particular, include consecutive phases
327
of (i) increasing, (ii) maximal (steady-state) and (iii) decreasing current
328
production and simultaneous COD elimination rates. Among them, the main
329
point of interest is the steady-state with maximal (i) current production and (ii)
330
substrate utilization rates, where various intra- and extracellular
331
mechanism/factors play a role [40]. Thus, in the next sections, the MFC data
332
collected under steady-state conditions will be processed. Firstly (Section
333
13
3.3.), a kinetic approach will be applied to get an insight to intracellular losses
334
related to reaction rate and bioconversion capacity of exoelectrogens [40].
335
Secondly (Section 3.4.), polarization results will be presented to evaluate
336
extracellular losses [40].
337 338
14
3.3. Monod model for substrate utilization kinetics – intracellular losses
339 340
The current generation and its kinetics are determined by two main
341
factors at intracellular level (where the electrons are conveyed from the
342
electron donor molecule to the outer membrane proteins or secreted shuttle
343
molecules) [40]. Firstly, substrate degradation takes place and reduced
344
intracellular charge carrier molecules (NADH) are formed [43]. Afterwards,
345
processes with the involvement of electron transport chain govern the
346
electrons to the starting point of extracellular electron transfer. The former step
347
can be described by the Monod model (Eq. 4), which correlates the current
348
density with substrate concentration [43]. Therefore, plotting maximal (steady-
349
state) current densities vs. substrate concentration allows studying related
350
(intracellular) energy losses. It is to note that experimental results obtained at
351
0.44 gCOD L-1 were added to make the analysis via the Monod model more
352
reliable. The double-reciprocal interpretation (Eq. 5) of Monod model is
353
depicted in Fig. 6. Based on the slope of trendlines fitted for the bioaugmented
354
and non-bioagumented (control) MFCs, kinetic parameters (imax and KS,app)
355
could be delivered. As it can be drawn from Table 2, comparable imax values
356
were found for all systems (109.9-120.5 mA m-2). This, together with Fig. 7
357
confirms the implications made in Section 3.3. regarding the existence of a
358
substrate saturation range where the highest COD loading (7.04 gCOD L-1,
359
which is 882 e- meq L-1 according to Eq. 5) belongs to. As for KS,app listed in
360
Table 2, the MFC augmented with P. freudenreichii demonstrated the lowest
361
value with 67.7 e- meq L-1, followed by C. basilensis-MFC (73.5 e- meq L-1),
362
Control-MFC (91 e- meq L-1) and Lactococcus-MFC (99.4 e- meq L-1). In
363
essence, obtaining a lower KS,app is advantageous from a reaction rate point of
364
view. Thus, the energy production rate (E) achieved in Propionibacterium-
365
MFC (compared to the other reactors) can be likely associated with the low
366
KS,app value, helping to maintain relatively higher electricity generation even at
367
lower substrate (COD) concentrations in accordance with the Monod model
368
(zero-order kinetics). Overall, bioaugmentation with the aid of selected pure
369
15
bacterial cultures such as P. freudenreichii and C. basilensis could effectively
370
decrease the limiting substrate concentration in MFCs. Once high (close to
371
maximal) E is kept at lower [S], the intracellular losses ascribed to the only
372
partly exploited capacity of active exoelectrogens (causing limitation of
373
reaction rate) in MFC can be reduced [40].
374
In fact, KS,app and imax values obtained in this work are somewhat lower
375
compared to other MFC research studies using components such as acetate,
376
ethanol or propionate, probably due to the complex structure of LPW
377
feedstock. For instance, KS,app = 19 e- meq L-1 (imax = 2200 mA m-2) was
378
observed in case of acetate-utilizing MFC [45]. In another work, KS,app = 0.18 -
379
58 e- meq L-1 was documented for ethanol substrate [46]. In microbial
380
electrolysis cell (MEC) mode, Torres et al. [47] reported half-saturation
381
constants of 22, 5.3 and 3.8 e- meq L-1 for acetate, ethanol and propionate,
382
respectively, while maximal current densities varied between approximately
383
1.8 – 9 A m-2.
384 385
3.4. Cell polarization characteristics – extracellular losses
386 387
Basically, polarization techniques can be applied to describe the system
388
from extracellular processes (and related potential or energy losses) [3].
389
These, on the anode side, cover (i) the transfer of electrons to the conductive
390
biofilm matrix and/or soluble shuttle molecules in the bulk phase and (ii) the
391
charge transport (conductive or diffusive) to the anode surface, where the
392
electrode reaction takes place. By varying the external resistance in the MFC
393
electrical circuit and measuring the cell voltage subsequently, polarization and
394
power density curves (U vs. i and Pd vs. i, respectively) can be registered (Fig.
395
8). Based on these data, the actual internal resistance (Ri) of an MFC is
396
estimated [3]. Considering the polarization chart (taken in steady-state at 7.04
397
gCOD L-1 LPW concentration), (i) activation polarization, (ii) ohmic and (iii)
398
concentration polarization regions could be identified in each MFC. The open
399
circuit voltages (OCV) were comparable, spanning 425 – 442 mV. As for Ri in
400
16
the bioaugmented MFCs, values belonging to Lactococcus-,
401
Propionibacterium- and Cupriavidus-MFC were noted such as 347 Ω, 341 Ω
402
and 348 Ω (with R2 > 0.98). In the Control-MFC, the corresponding value was
403
higher (383 Ω).
404
The comparable voltages occurring at low current densities (Fig. 8) can
405
be explained by the restricted passage of electrons through the circuit, caused
406
by high external resistor [44]. Therefore, from these similar values, a
407
resistance value can be assumed above which the global reaction rate in MFC
408
(ending with proton reduction at the cathode by electrons captured and
409
delivered from the anode) will be independent of the microbial reduction rate of
410
charge-carrying redox components. By lowering the external resistance,
411
continuous voltage drop and simultaneously increasing current density can be
412
observed, where more oxidized-form electron carriers are present and
413
implicitly, the marked role of electro-active microbial metabolism becomes
414
apparent. Moreover, i in various MFCs can be properly distinguished at lower
415
(external) resistances, as indicated by Fig. 8. In general, the bioaugmented
416
MFCs generated higher maximal polarization current density (imax,P) than the
417
Control-MFC did. Expressed in numbers, imax,P of 110, 116 and 127 mA m-2
418
could be reached in Lactococcus-, Cupriavidus- and Propionibacterium-MFCs,
419
respectively, where the latest case demonstrates 21 % increment relative to
420
the non-augmented system (105 mA m-2).
421
The significantly positive effect of bioaugmentation on MFC performance
422
could be recognized on grounds of maximal power densities (Pd,max, Fig. 8) to
423
be ordered as follows: 6.6 mW m-2 (Control-MFC), 7.9 mW m-2 (Cupriavidus-
424
MFC), 8.2 mW m-2 (Lactococcus-MFC), 9.8 mW m-2 (Propionibacterium-MFC).
425
Thus, in this aspect too, the enrichment of microbial consortia by P.
426
freudenreichii was the most advantageous strategy to improve
427
bioelectrochemical system efficiency. The findings presented are in agreement
428
with the literature, where Raghavulu et al. [22] attained OCV of 378 mV using
429
S. haliotis for bioaugmentation with Ri, imax,P and Pd,max of 300 Ω, 320 mA m-2
430
and 29.6 mW m-2, respectively. In addition, bioaugmentation of MFCs with P.
431
17
aeruginosa resulted in relatively high OCV (418 mV) and maximal power
432
density (69.9 mW m-2) with polarization current density of ~ 450 mA m-2 [24].
433
The results of Reiche et al. [28] for P. freudenreichii-driven MFC are also
434
comparable to ours with Propionibacterium-MFC, realizing OCV of 485 mV
435
and Pd,max of 14.9 mW m-2 [28]. In MFCs operated with monoculture of C.
436
basilensis as exoelectrogenic biocatalyst, Friman et al. [32] could observe
437
OCV of about 250 mV and Pd,max of 10 mW m-2, which coincide well with our
438
values in Cupriavidus-MFC (OCV = 425 mV and Pd,max = 7.9 mW m-2).
439
In this work, the selected electro-active bacteria were known as
440
producers of electron shuttle molecules (Section 1.) and therefore, a process
441
via such soluble compounds can be supposed. This argument seems to be
442
supported by the current density values documented in this investigation (imax,P
443
in the order of 102 mA m-2), implying the more likely occurrence of mediated
444
(diffusion controlled) electron transport rather than a direct contact mechanism
445
[40].
446 447
4. Conclusions
448 449
In this study, bioaugmentation process and its effect on microbial fuel
450
cell performance were investigated by several electro-active bacterial cultures.
451
Considering the electric outputs (i.e. current and power density) and energy
452
yield, the bioaugmented MFCs were more efficient at higher COD loadings
453
than the control. The analysis of energy production and COD removal rates
454
revealed an optimum COD loading. Besides, substrate saturation and the
455
existence of zero-order kinetics region at the highest substrate concentration
456
were confirmed by applying Monod model. KS,app values could be significantly
457
decreased in case of Propinobacterium- and Cupriavidus-MFC compared to
458
the control. Polarization measurements indicated the positive impact of
459
bioaugmentation on extracellular losses and enhanced electron shuttle
460
mechanism could be presumed. In conclusion, microbial augmentation can be
461
considered as a promising strategy to improve microbial fuel cells. After
462
18
examination of systems behavior from various points of views,
463
Propionibacterium freudenreichii was found as the most advantageous strain
464
among those tested for bioaugmentation in the experiments.
465 466
Acknowledgements
467 468
Péter Bakonyi acknowledges the support received from National
469
Research, Development and Innovation Office (Hungary) under grant number
470
PD 115640. The János Bolyai Research Scholarship of the Hungarian
471
Academy of Sciences is duly acknowledged for the support. The “GINOP-
472
2.3.2-15 – Excellence of strategic R+D workshops (Development of modular,
473
mobile water treatment systems and waste water treatment technologies
474
based on University of Pannonia to enhance growing dynamic export of
475
Hungary (2016-2020))” is thanked for supporting this work. László Koók was
476
supported by the ÚNKP-17-3 ‘‘New National Excellence Program of the
477
Ministry of Human Capacities”.
478 479
References
480 481
[1] Allen, R. M., Bennetto, H. P., 1993. Microbial fuel-cells. Appl. Biochem.
482
Biotechnol. 39, 27-40.
483
[2] Rabaey, K., Verstraete, W., 2005). Microbial fuel cells: novel
484
biotechnology for energy generation. Trends Biotechnol. 23, 291-298.
485
[3] Logan, B.E., Hamelers, B., Rozendal, R., Schröder, U., Keller, J.,
486
Freguia, S., et al., 2006. Microbial fuel cells: methodology and
487
technology. Environ. Sci. Technol. 40, 5181-5192.
488
[4] Pant, D., Van Bogaert, G., Diels, L., Vanbroekhoven, K., 2010. A review
489
of the substrates used in microbial fuel cells (MFCs) for sustainable
490
energy production. Bioresour. Technol. 101, 1533-1543.
491
[5] Pandey, P., Shinde, V.N., Deopurkar, R.L., Kale, S.P., Patil, S.A., Pant,
492
D., 2016. Recent advances in the use of different substrates in microbial
493
19
fuel cells toward wastewater treatment and simultaneous energy
494
recovery. Appl. Energy 168, 706-723.
495
[6] Vogl, A., Bischof, F., Wichern, M., 2016. Single chamber microbial fuel
496
cells for high strength wastewater and blackwater treatment—A
497
comparison of idealized wastewater, synthetic human blackwater, and
498
diluted pig manure. Biochem. Eng. J. 115, 64-71.
499
[7] Dong, Y., Qu, Y., He, W., Du, Y., Liu, J., Han, X., Feng, Y., 2015. A 90-
500
liter stackable baffled microbial fuel cell for brewery wastewater
501
treatment based on energy self-sufficient mode. Bioresour.
502
Technol. 195, 66-72.
503
[8] Fang, Z., Song, H. L., Cang, N., Li, X. N., 2015. Electricity production
504
from Azo dye wastewater using a microbial fuel cell coupled constructed
505
wetland operating under different operating conditions. Biosens.
506
Bioelectron. 68, 135-141.
507
[9] Abbasi, U., Jin, W., Pervez, A., Bhatti, Z. A., Tariq, M., Shaheen, S., et
508
al., 2016. Anaerobic microbial fuel cell treating combined industrial
509
wastewater: Correlation of electricity generation with
510
pollutants. Bioresour. Technol. 200, 1-7.
511
[10] Hassan, M., Pous, N., Xie, B., Colprim, J., Balaguer, M. D., Puig, S.,
512
2017. Influence of iron species on integrated microbial fuel cell and
513
electro-Fenton process treating landfill leachate. Chem. Eng. J. 328, 57-
514
65.
515
[11] Koók, L., Rózsenberszki, T., Nemestóthy, N., Bélafi-Bakó, K., Bakonyi,
516
P., 2016. Bioelectrochemical treatment of municipal waste liquor in
517
microbial fuel cells for energy valorization. J. Clean. Prod. 112, 4406-
518
4412.
519
[12] Logan, B.E., 2009. Exoelectrogenic bacteria that power microbial fuel
520
cells. Nat. Rev. Microbiol. 7, 375-381.
521
[13] Strik, D.P.B.T.B., Terlouw, H., Hamelers, H.V.M, Buisman, C.J.N, 2008.
522
Renewable sustainable biocatalyzed electricity production in a
523
20
photosynthetic algal microbial fuel cell (PAMFC). Appl. Microbiol.
524
Biotechnol. 81, 659-668.
525
[14] Tyagi, M., da Fonseca, M. M. R., de Carvalho, C. C., 2011.
526
Bioaugmentation and biostimulation strategies to improve the
527
effectiveness of bioremediation processes. Biodegradation, 22, 231-241.
528
[15] Mrozik, A., Piotrowska-Seget, Z., 2010. Bioaugmentation as a strategy
529
for cleaning up of soils contaminated with aromatic
530
compounds. Microbiol. Res. 165, 363-375.
531
[16] Tahhan, R. A., Ammari, T. G., Goussous, S. J., Al-Shdaifat, H. I., 2011.
532
Enhancing the biodegradation of total petroleum hydrocarbons in oily
533
sludge by a modified bioaugmentation strategy. Int. Biodeterior.
534
Biodegradation. 65, 130-134.
535
[17] Sayara, T., Borràs, E., Caminal, G., Sarrà, M., Sánchez, A., 2011.
536
Bioremediation of PAHs-contaminated soil through composting:
537
influence of bioaugmentation and biostimulation on contaminant
538
biodegradation. Int. Biodeterior. Biodegradation. 65, 859-865.
539
[18] Mrozik, A., Miga, S., & Piotrowska‐Seget, Z., 2011. Enhancement of
540
phenol degradation by soil bioaugmentation with Pseudomonas sp.
541
JS150. J. Appl. Microbiol. 111, 1357-1370.
542
[19] Westerholm, M., Levén, L., Schnürer, A., 2012. Bioaugmentation of
543
syntrophic acetate-oxidizing culture in biogas reactors exposed to
544
increasing levels of ammonia. Appl. Environ. Microbiol. 78, 7619-7625.
545
[20] Kumar, G., Bakonyi, P., Kobayashi, T., Xu, K. Q., Sivagurunathan, P.,
546
Kim, S. H., et al., 2016. Enhancement of biofuel production via microbial
547
augmentation: the case of dark fermentative hydrogen. Renew. Sust.
548
Energ. Rev. 57, 879-891.
549
[21] Wang, X., Feng, Y., Wang, H., Qu, Y., Yu, Y., Ren, N., et al., 2009.
550
Bioaugmentation for electricity generation from corn stover biomass
551
using microbial fuel cells. Environ. Sci. Technol. 43, 6088-6093.
552
[22] Raghavulu, S. V., Babu, P. S., Goud, R. K., Subhash, G. V., Srikanth,
553
S., Mohan, S. V., 2012. Bioaugmentation of an electrochemically active
554
21
strain to enhance the electron discharge of mixed culture: process
555
evaluation through electro-kinetic analysis. RSC Adv. 2, 677-688.
556
[23] Kiely, P. D., Regan, J. M., Logan, B. E., 2011. The electric picnic:
557
synergistic requirements for exoelectrogenic microbial
558
communities. Curr. Opin. Biotechnol. 22, 378-385.
559
[24] Raghavulu, S. V., Modestra, J. A., Amulya, K., Reddy, C. N., Mohan, S.
560
V., 2013. Relative effect of bioaugmentation with electrochemically
561
active and non-active bacteria on bioelectrogenesis in microbial fuel
562
cell. Bioresour. Technol. 146, 696-703.
563
[25] Wang, Y. F., Masuda, M., Tsujimura, S., Kano, K., 2008.
564
Electrochemical regulation of the end‐product profile in
565
Propionibacterium freudenreichii ET‐3 with an endogenous
566
mediator. Biotechnol. Bioeng. 101, 579-586.
567
[26] Mori, H., Sato, Y., Taketomo, N., Kamiyama, T., Yoshiyama, Y., Meguro,
568
S., et al., 1997. Isolation and structural identification of bifidogenic
569
growth stimulator produced by Propionibacterium freudenreichii. J. Dairy
570
Sci. 80, 1959-1964.
571
[27] Reiche, A., Sivell, J. L., Kirkwood, K. M., 2016. Electricity generation by
572
Propionibacterium freudenreichii in a mediatorless microbial fuel
573
cell. Biotechnol. Letters. 38, 51-55.
574
[28] Ledrich, M. L., Stemmler, S., Laval-Gilly, P., Foucaud, L., Falla, J., 2005.
575
Precipitation of silver-thiosulfate complex and immobilization of silver by
576
Cupriavidus metallidurans CH34. Biometals 18, 643-650.
577
[29] Monchy, S., Benotmane, M. A., Janssen, P., Vallaeys, T., Taghavi, S.,
578
van der Lelie, D., Mergeay, M., 2007. Plasmids pMOL28 and pMOL30 of
579
Cupriavidus metallidurans are specialized in the maximal viable
580
response to heavy metals. J. Bacteriol. 189, 7417-7425.
581
[30] Friman, H., Schechter, A., Nitzan, Y., Cahan, R., 2013. Phenol
582
degradation in bio-electrochemical cells. Int. Biodeterior. Biodegrad. 84,
583
155-160.
584
22
[31] Friman, H., Schechter, A., Ioffe, Y., Nitzan, Y., Cahan, R., 2013. Current
585
production in a microbial fuel cell using a pure culture of Cupriavidus
586
basilensis growing in acetate or phenol as a carbon source. Microb.
587
Biotechnol. 6, 425-434.
588
[32] Yamazaki, S. I., Kaneko, T., Taketomo, N., Kano, K., Ikeda, T., 2002.
589
Glucose metabolism of lactic acid bacteria changed by quinone-
590
mediated extracellular electron transfer. Biosci. Biotechnol. Biochem. 66,
591
2100-2106.
592
[33] Freguia, S., Masuda, M., Tsujimura, S., Kano, K., 2009. Lactococcus
593
lactis catalyses electricity generation at microbial fuel cell anodes via
594
excretion of a soluble quinone. Bioelectrochemistry 76, 14-18.
595
[34] Bakonyi, P., Koók, L., Keller, E., Bélafi-Bakó, K., Rózsenberszki, T.,
596
Saratale, G.D., et al., 2018. Development of bioelectrochemical systems
597
using various biogas fermenter effluents as inocula and municipal waste
598
liquor as adapting substrate. Bioresour. Technol. 259, 75-82.
599
[35] Rózsenberszki, T., Koók, L., Hutvágner, D., Nemestóthy, N., Bélafi-
600
Bakó, K., Bakonyi, P., et al., 2015. Comparison of anaerobic
601
degradation processes for bioenergy generation from liquid fraction of
602
pressed solid waste. Waste Biomass Valor. 6, 465-473.
603
[36] Zhen, G., Kobayashi, T., Lu, X., Kumar, G., Hu, Y., Bakonyi, P., et al.,
604
2016. Recovery of biohydrogen in a single-chamber microbial
605
electrohydrogenesis cell using liquid fraction of pressed municipal solid
606
waste (LPW) as substrate. Int. J. Hydrogen Energy 41, 17896-17906.
607
[37] Rózsenberszki, T., Koók, L., Bakonyi, P., Nemestóthy, N., Logroño, W.,
608
Pérez, M., et al., 2017. Municipal waste liquor treatment via
609
bioelectrochemical and fermentation (H2 + CH4) processes: Assessment
610
of various technological sequences. Chemosphere 171, 692-701.
611
[38] Koók, L., Nemestóthy, N., Bakonyi, P., Zhen, G., Kumar, G., Lu, X., et
612
al., 2017. Performance evaluation of microbial electrochemical systems
613
operated with Nafion and supported ionic liquid
614
membranes. Chemosphere 175, 350-355.
615
23
[39] Bakonyi, P., Borza, B., Orlovits, K., Simon, V., Nemestóthy, N.,
616
Bélafi-Bakó, K., 2014. Fermentative hydrogen production by
617
conventionally and unconventionally heat pretreated seed cultures: A
618
comparative assessment. Int. J. Hydrogen Energy 39, 5589-5596.
619
[40] Torres, C. I., Marcus, A. K., Lee, H. S., Parameswaran, P., Krajmalnik-
620
Brown, R., Rittmann, B. E., 2009. A kinetic perspective on extracellular
621
electron transfer by anode-respiring bacteria. FEMS Microbiol.
622
Reviews 34, 3-17.
623
[41] Carmona-Martínez, A.A., Trably, E., Milferstedt, K., Lacroix, R.,
624
Etcheverry, L., Bernet, N., 2015. Long-term continuous operation of H2
625
in microbial electrolysis cell (MEC) treating saline wastewater. Water
626
Res. 81, 149-156.
627
[42] Rosenbaum, M. A., Bar, H. Y., Beg, Q. K., Segrè, D., Booth, J., Cotta,
628
M. A., Angenent, L. T., 2011. Shewanella oneidensis in a lactate-fed
629
pure-culture and a glucose-fed co-culture with Lactococcus lactis with an
630
electrode as electron acceptor. Bioresour. Technol. 102, 2623-2628.
631
[43] Bae, W., Rittmann, B. E., 1996. Responses of intracellular cofactors to
632
single and dual substrate limitations. Biotechnol. Bioeng. 49, 690-699.
633
[44] Mohanakrishna, G., Mohan, S. V., Sarma, P. N., 2010. Bio-
634
electrochemical treatment of distillery wastewater in microbial fuel cell
635
facilitating decolorization and desalination along with power
636
generation. J. Hazard. Mater. 177, 487-494.
637
[45] Liu, H., Cheng, S., Logan, B. E., 2005. Production of electricity from
638
acetate or butyrate using a single-chamber microbial fuel cell. Env. Sci.
639
Technol. 39, 658-662.
640
[46] Kim, J. R., Jung, S. H., Regan, J. M., Logan, B. E., 2007. Electricity
641
generation and microbial community analysis of alcohol powered
642
microbial fuel cells. Bioresour. Technol. 98, 2568-2577.
643
[47] Torres, C. I., Marcus, A. K., Rittmann, B. E., 2007. Kinetics of
644
consumption of fermentation products by anode-respiring bacteria. Appl.
645
Microbiol. Biotechnol. 77, 689-697.
646 647
24
Table 1 – Stationary electric outputs and energy yield at different COD
648
loadings for bioaugmented and control MFCs.
649
COD loading (gCOD L-1)
Propionibacterium- MFC
Cupriavidus- MFC
Lactococcus- MFC
Control- MFC 0.88
imax
(mA m-2)
76.2 ± 1.98 70.6 ± 1.23 57.6 ± 3.61 66.2 ± 3.27
1.76 87.7 ± 2.46 81.3 ± 1.76 76.5 ± 1.37 80.2 ± 2.52
3.52 109.7 ± 0.86 95.8 ± 1.42 91.4 ± 1.98 92.3 ± 1.55
7.04 110.3 ± 0.76 100.1 ± 1.94 95.1 ± 1.55 102 ± 4.61
0.88
Pd,max
(mW m-2)
3.7 ± 0.18 3.2 ± 0.11 2.1 ± 0.24 2.8 ± 0.25
1.76 4.9 ± 0.26 4.2 ± 0.19 3.8 ± 0.13 4.1 ± 0.25
3.52 7.7 ± 0.12 5.9 ± 0.17 5.4 ± 0.22 5.5 ± 0.17
7.04 7.8 ± 0.13 6.4 ± 0.24 5.8 ± 0.18 6.7 ± 0.57
0.88
YS
(kJ gCOD-1 m-2)
1.33 ± 0.05 1.54 ± 0.06 0.86 ± 0.04 1.45 ± 0.11
1.76 1.19 ± 0.05 1.63 ± 0.09 1.15 ± 0.06 1.53 ± 0.17
3.52 1.59 ± 0.09 1.62 ± 0.09 1.43 ± 0.09 1.69 ± 0.09
7.04 3.62 ± 0.20 2.29 ± 0.09 2.77 ± 0.16 1.89 ± 0.13
650
25
Table 2 – Kinetic parameters and R-squared value of the fitted Monod
651
model.
652
MFC type imax (mA m-2) KS,app (e- meq L-1) R2 (-)
Propionibacterium-MFC 120.5 67.7 0.988
Cupriavidus-MFC 111.1 73.5 0.999
Lactococcus-MFC 109.9 99.4 0.990
Control-MFC 112.4 91.0 0.988
653