In recent years there has been a growing concern about the emission trade balance of countries.
It is due to the fact that countries with an open economy are active players in the international trade, though trade is not only a major factor in forging a country’s economic structure anymore, but it does contribute to the movement of embodied emissions beyond the country borders. This issue is especially relevant from the carbon accounting policy’s point of view, as it is known that the production-based principle is in effect now in the Kyoto agreement.
The study aims at revealing the interdependence of countries on international trade and its environmental impacts, and how the carbon accounting method plays a crucial role in evaluating a country’s environmental performance and its role in the climate mitigation processes. The input-output models are used in the methodology, as they provide an appropriate framework for this kind of environmental accounting; the analysis shows an international comparison of four European countries (Germany, the United Kingdom, the Netherlands, and Hungary) with extended trading activities and carbon emissions.
Moving from the production-based approach in the climate policy, to the consumption- perspective principle and allocation [15], it would also help increasing the efficiency of emission reduction targets and the evaluation of the sustainability dimension and its impacts of international trade. The results of the study have shown that there is an importance of distinction between the two emission allocation approaches, both from global and local level point of view.
The research is part of the “Sustainable Consumption, Production and Communication”
Project financed by the Norwegian Fund.
Keywords: International Trade, Carbon Footprint, Input-Output tables, Consumption-based Accounting, Carbon - dioxide embodied in trade
I. INTRODUCTION
The UNFCCC and the Kyoto Protocol call for a stabilization of the greenhouse gases concentrations in the atmosphere at 1990 levels in order to curb the harmful effects of climate change. The so called Annex I Parties are required to reduce their emissions of greenhouse gases to the percentages set by the Kyoto Protocol. Not only ambitious targets should be set for the global climate agreement, but there are further challenges which need to be addressed concerning the climate accounting methods and climate agreements. The relation of the international trade and carbon leakage can be a central issue, as it is commonly known that approximately 20% of the world’s emissions are embodied in international trade. The national emission inventories are based on the production-based emission allocation approach. Regarding the transparency and fairness of the emission accounting processes, a country should be responsible for the emissions of consumption, as the final demand is dependant on emissions generated elsewhere.
CARBON EMISSIONS LOCKED - IN TRADE
Zsófia Mózner Vetőné
Corvinus University of Budapest, Institute of Environmental Sciences Department of Environmental Economics and Technology
Fővám tér 8., Budapest, Hungary Email: zsofia.mozner@uni-corvinus.hu
On a global scale many of the imported emissions come from other (developing) countries while it represents only a minor share of the import value.
Responding to the climate change there can be two main strategies: mitigation and offsetting. The reduction of emissions can be distorted as the basis of the allocation is not fair, while offsetting can lead to rebound effects and could create externalities. That is why, the question of the emission trade balance and the consumption-based emission accounting, has become lately quite relevant recently.
This study aims at revealing the interdependence of countries on international trade and their environmental impacts, and how the carbon accounting method plays a crucial role in evaluating a country’s environmental performance.
II. THEORETICALBACKGROUND:THE THEORY OF THE ECOLOGICAL UNEQUAL EXCHANGE AND THE CARBON FOOTPRINT
The theoretical background of the study can be related to the theory of ecological unequal exchange (EUE). It has to be noted that for long, the ecological aspect of trade flows were not in the limelight of research. Originally the unequal flows of purchasing power (Prebisch, Singer), and labour time (Emmanuel) between one part of the world at the expense of the peripheries, were examined. Concerning the climate change negotiations, the ecological content needs to be captured as well, as according to the Kyoto agreement only domestically produced carbon emissions and greenhouse gases (GHGs) are accounted for, while the imported GHGs because of final demand, are not included in the national emission quotas and targets. Examining the allocation responsibility and the fairness of allocation, it is evident that the net GHG exporters can be overtaxed while net GHG importers can be undertaxed according to the present accounting system. Considering ecological unequal exchange, it is vital to examine the justice of climate accounting methods. At a macro level, it is true that if we look at the North-South trade flows, the North benefits from the ecological unequal exchange, as the embodied emissions and ecological resources are greater than its exports, so the environmental load generated because of the final demand in the Northern countries should be allocated to them [1]. The study of Peters [15] gives a detailed analysis and comparison on the theory of production and consumption-based responsibility.
Kenneth [9] argues that the indicators of carbon footprint and the embedded CO2 can be used convincingly to measure the EUE and the environmental loads of trade.
First, it has to be defined what is meant by carbon footprint, as this indicator is used in the study. In the relevant literature there has been a dispute recently on the definition of the carbon footprint, as the term has been used widely, with a wide interpretation.
The methodological root of the carbon footprint goes back to the concept of
“the energy cost of living” developed in the 1970s, and to the net energy analysis [7]. The term itself as a footprint is rooted in the language of the ecological footprinting [18] and when used in Ecological Footprint studies, this term is synonymous with demand on carbon uptake land [5].
According to [20] it is not clear what should be included in the calculation of the carbon footprint, only CO2 or other greenhouse gases (like methane) as well.
Finkbeiner [6] examines the central questions concerning the clarity of the definition, and argues that carbon footprinting needs to be changed, the definition should be clarified.
Concerning the carbon footprint, an important question is whether it should reflect and include only the direct emissions or the indirect as well, the life-cycle impacts of goods and services used. A major question is the measurement unit of this indicator. There can be two options: it can either be measured in CO2
equivalents, in this case measuring only the amount of carbon emissions in tonnes, or it can be measured in area units - in global hectares as well, thus showing its impact of global warming potential and the area based unit of land appropriation.
According to Global Footprint Network, during the calculation of the carbon footprint, the CO2 emission data are translated into the area, measured in global hectares, which account for absorbing the carbon emissions. So, it is actually the fossil fuel footprint or CO2 land. The carbon footprint is the area of annual forestry required to sequester the CO2 emissions [13]. The CO2 land is defined by the Global Footprint Network as “The demand on biocapacity required to sequester (through photosynthesis) the carbon dioxide emissions from fossil fuel combustion, it includes the biocapacity, typically that of unharvested forests, needed to absorb the fraction of fossil CO2 that is not absorbed by the ocean”
[5].
Wiedmann [20] proposes the following definition: “The carbon footprint is a measure of the exclusive total amount of carbon - dioxide emissions that is directly and indirectly caused by an activity or it is accumulated over the life stages of a product”. So the direct (on-site, internal) and indirect (off-site, external, embodied, upstream, downstream) emissions are both taken into account. It is important for the concept of carbon footprint to be all- encompassing and to include all possible causes that give rise to carbon emissions, and it is equally essential to make clear what this includes. CO2 is measured in mass units (kg, t, etc.) as the conversion to area units could increase the uncertainties. In this study the carbon footprint is applied after the definition of Wiedmann.
III. METHODOLOGY:CARBON FOOTPRINTING COMBINED BY INPUT-OUTPUT TABLES
In the analysis the carbon footprinting combined by the input-output analysis has been applied in order to quantify and evaluate the carbon emissions embodied in international trade from the consumption-based accounting approach. Wackernagel et al. [19] propose the application of input-output analysis to allocate footprint into detailed consumption categories, as the input- output approach is able to track the transformation of goods through an economy.
The input–output analysis was developed by Leontief [10] in the form of an industry-by-industry matrix. It has been extended by Cumberland [2] later, where the economic and environmental interactions were incorporated into the input- output tables [12]. An additional sector was integrated in it by Leontief [11], in order to simulate the removal of pollutants in the input-output structure. A few years later, Victor [17] came up with a combined ecological–economic input- output model, and introduced economic components in monetary terms while ecological ones were expressed in physical terms. The input-output tables were in the form of a commodity-by-industry table combined with economic and environmental commodities.
In the study, the symmetric, industry by industry input-output tables from the OECD’s STAN Database for Structural Analysis [14] were used for the year 2005, as it was as the most recent data which was available for the analysed countries. The carbon-dioxide emission values were from the database of the Global Footprint Network [4], which were used in the environmentally extended input-output matrix, also for year 2005. In the database of the Global Footprint Network emission data were given on product level, so the first step of the calculation was aggregating the product level emissions to sectoral level. The emissions for domestic production and the emission embodied in imported products and services were available in the database.
The carbon footprint values of the analysed counties were calculated using the consumption-based accounting approach, where the emissions of both from domestic production for domestic demand and emissions because of imported products were used in the calculation. The aim was to decompose and quantify the carbon footprint of domestic final demand due to domestic production (CFd), and imported products (CFm).
The carbon footprint describes the carbon-dioxide emissions by sectors owing to the final demand of a sector (1):
(1)
In the equation F stands for a row vector, each element representing the carbon footprint value (domestic and imported environmental load together) per unit of industry output. (I-A)-1 represents the direct and indirect requirement matrix calculated from the symmetric input-output (industry by industry) tables.
This is the so-called Leontief inverse matrix, showing the input requirements in case of one additional unit of output. Finally, ycom is the vector of the domestic consumption’s final demand. The vector of the domestic final demand needs to be diagonalised in order to obtain the consumer’s environmental load. The result is a matrix which shows the individual carbon footprint values of the industrial sectors in the analysed category.
The carbon footprint has been quantified and decomposed into the two parts.
I. The Carbon Footprint of domestically produced products and services (CFd), which has been emitted because of the domestic consumer demand. Emissions due to exported products are not included.
(2)
Where Ad is the matrix of domestic industry requirements of domestically produced products, calculated from the IO table, and yd is the vector of final demand of domestic consumption.
II. The Carbon Footprint of imported goods and services, which can be further divided according to the origin of the footprint.
(3)
The carbon footprint of direct imports show the environmental load of imported products immediately and directly used for final domestic demand.
In the calculation of the imported footprint, the Leontief inverse is used and it is assumed that each commodity imported is produced by using proportionally the same kind of inputs (materials, intermediates, labour and energy) as used in the domestic production sector.
As a result of the calculations, the carbon emissions were gained on sectoral level in the four analysed countries, and further indicators were calculated in order to illustrate the emissions embodied in imports.
IV. RESULTS AND DISCUSSION
In this study four European countries were compared concerning their CO2
emissions embodied in international trade. The countries were chosen based on their high carbon-dioxide emissions and on their international trading volumes.
The carbon footprint of Germany, United Kingdom, the Netherlands have been analysed primarily, but Hungary was also included in the analysis.
The aim of the study is quantify to what extent the analysed countries’ final demand can be responsible for the emission generated outside of their country borders. Furthermore a sectoral analysis was carried out in order to define which sectors can boast with the highest carbon footprints and carbon intensities concerning the imported products.
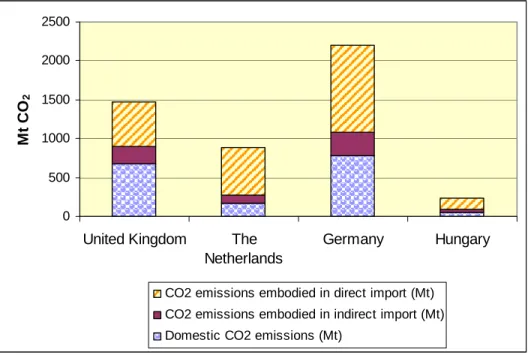
Figure 1. shows the result of the decomposition of the carbon footprint. It can be seen that the emissions embodied in import play a significant role in each country. It is the Netherlands where the embodied emissions are relatively the highest, the emissions embodied in direct imports are 69,3% of the total emissions. This is followed by Hungary and Germany, where though the carbon- dioxide emissions are far lower in Hungary than in the other three countries, it has to be noted, that because of the consumption-based emission accounting method, the national emissions are significantly different compared to the present accounting system. It is the United Kingdom, where the emissions embodied in direct and indirect imports are the lowest in this comparison, still they give 54,3% of the total emissions. As the internationally traded goods are mainly finished goods, that is why the direct carbon footprint is greater in all countries and in each country in almost all the industry sectors.
0 500 1000 1500 2000 2500
United Kingdom The Netherlands
Germany Hungary Mt CO2
CO2 emissions embodied in direct import (Mt) CO2 emissions embodied in indirect import (Mt) Domestic CO2 emissions (Mt)
FIGURE 1: CO2 EMISSIONS OF PRODUCTION AND EMBODIED IMPORTS
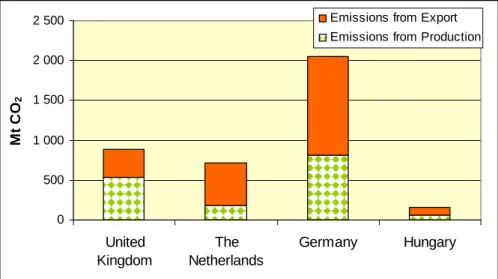
The consumption-based accounting approach should be compared to the present, production-based accounting method in order to illustrate the differences in the results and to underpin the theory of ecological unequal change. Figure 2. shows the CO2 emissions generated because of domestic production and exports. It can
be seen clearly, the emissions of production-based approach are smaller than the emissions which are allocated according to the consumption-based responsibility. It can be concluded, that the adoption of the approach based on a country’ final demand would lead to the adoption of carbon efficiency measures at all levels, as a country would need not only to have its production chains at the least carbon intensive as possible, but would also have to look for the most efficient carbon trading partners. There would be a fairer result and more compliance with policies.
0 500 1 000 1 500 2 000 2 500
United Kingdom
The Netherlands
Germany Hungary Mt CO2
Emissions from Export Emissions from Production
FIGURE 2: CO2 EMISSIONS OF DOMESTIC PRODUCTION EXPORTS
From the climate accounting point of view, not only the emissions embodied in international trade are important, but the sectoral level needs to be examined as well. According to the ecological unequal exchange theory, those sectors are especially harmful to the environment where, the relative share of carbon- dioxide emissions embodied in imports are greater than the imported values share to the total import value of the country, so where the intensity (the tonne of CO2 embodied in imports per currency spent on imports) of embodied emissions is high.
The industries in each country were ranked according to their carbon intensity and total emissions, so in the following section the industry sectors having the highest import intensity can be found for the analysed countries.
In the Netherlands the sectors which are quite carbon intensive concerning the imports can be seen in Table 1. The sectors of Chemicals; Basic Metals and Mining and quarrying have also one of the highest total carbon emission values.
TABLE 1: CO2 EMISSIONS AND INTENSITY OF IMPORTS IN THE NETHERLANDS
Interestingly, in Germany, the first three carbon intensive sectors, which also have high carbon emission values in absolute terms as well, are the same as in the Netherlands. Furthermore, it is the textile industry which requires a high amount of raw materials, after the industries providing metals and minerals, which generate emissions in the exporting countries.
TABLE 2: CO2 EMISSIONS AND INTENSITY OF IMPORTS IN GERMANY
Rank Industry sector
Total carbon-
dioxide emissions (Mt CO2)
Import/Total Import value
Imported Carbon Footprint/
Total Imported
CF 1 C24 Chemicals and chemical
products 236,87 10,0% 13,0%
2 C27 Basic metals 174,82 6,1% 12,1%
3 C10T14 Mining and quarrying 145,45 7,8% 9,4%
4 C23 Coke, refined petroleum
products and nuclear fuel 120,29 3,6% 7,4%
5 C17T19 Textiles, textile
products, leather and footwear 128,50 5,0% 6,4%
As for the United Kingdom (Table 3.), which on an aggregate basis, had the lowest share of embodied emission, the sectors are more varied concerning the emissions embodied in imports.
Rank Industry sector
Total carbon-
dioxide emissions (Mt CO2)
Import/Total Import value
Imported Carbon Footprint/
Total Imported
CF 1 C24 Chemicals and chemical
products 160,90 10,8% 21,2%
2 C27 Basic metals 69,87 3,4% 9,8%
3 C10T14 Mining and quarrying 49,65 8,3% 7,0%
4 C15T16 Food products,
beverages and tobacco 65,86 5,5% 6,4%
5 C23 Coke, refined petroleum
products and nuclear fuel 38,59 3,7% 5,1%
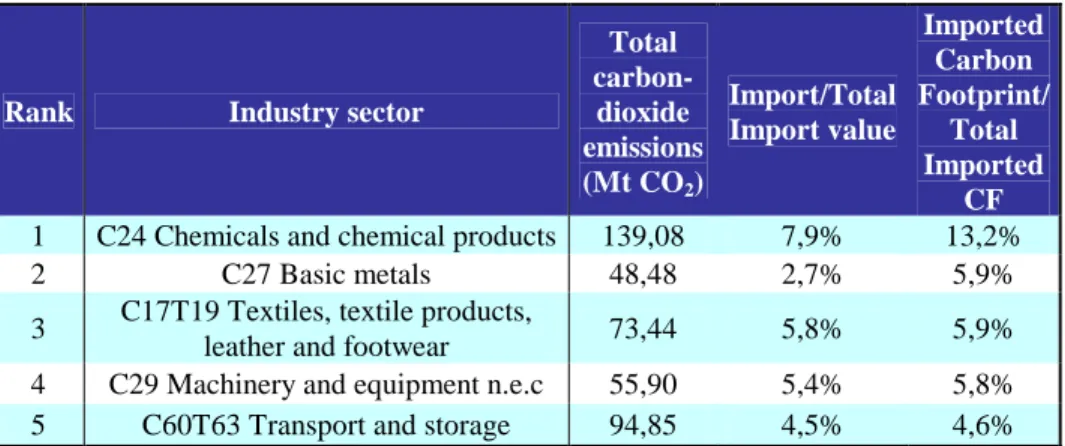
The Chemicals and chemical product, the Motor vehicles industry and the Food processing industry can be given responsibility for the high amounts of imported emissions and they contribute to the total carbon-dioxide emissions in a great extent as well.
TABLE 3: CO2 EMISSIONS AND INTENSITY OF IMPORTS IN THE UK
Rank Industry sector
Total carbon-
dioxide emissions (Mt CO2)
Import/Total Import value
Imported Carbon Footprint/
Total Imported
CF 1 C24 Chemicals and chemical products 139,08 7,9% 13,2%
2 C27 Basic metals 48,48 2,7% 5,9%
3 C17T19 Textiles, textile products,
leather and footwear 73,44 5,8% 5,9%
4 C29 Machinery and equipment n.e.c 55,90 5,4% 5,8%
5 C60T63 Transport and storage 94,85 4,5% 4,6%
The Chemicals and chemical products seem to have a high share of carbon- dioxide emissions in Hungary as well, and this sector is also responsible for a high amount of emission embodied in imports. Basic metals and machinery are those products which contribute to the carbon-dioxide emissions significantly through the import activities of the country.
TABLE 4: CO2 EMISSIONS AND INTENSITY OF IMPORTS IN HUNGARY
Rank Industry sector
Total carbon-
dioxide emissions (Mt CO2)
Import/Total Import value
Imported Carbon Footprint/
Total Imported
CF 1 C24 Chemicals and chemical
products 26,59 7,5% 12,1%
2 C27 Basic metals 16,09 4,0% 8,8%
3 C29 Machinery and equipment n.e.c 12,29 6,1% 6,6%
4 C28 Fabricated metal products
except machinery and equipment 7,48 3,5% 4,1%
5 C15T16 Food products, beverages
and tobacco 11,67 3,1% 3,9%
The carbon emissions per industry unit of output, the so-called physical coefficients have also been analysed, showing that the industries of electricity, gas and water supply; basic metals, mining and quarrying and chemicals can boast with the highest coefficients, but the rank of the industries varies in the analysed countries.
V. CONCLUSION
Results have shown that the analysed countries generate a high amount of carbon emissions abroad because of the final demand. It is the Netherlands which generates the highest amount of CO2 emissions abroad. A sectoral analysis has been carried out as well for each country, concerning the carbon emissions of production, indirect and direct import activities.
In this study we could see that the production - based approach can be viewed as an asymmetry concerning the internalization of external costs in climate accounting. By quantifying the CO2 embodied in overall consumption, and consumptions of the specific industry sectors, it can highlight for policy makers the extent to which the country is dependant on other countries ecological resources, where their footprint directly falls and their responsibility for consumption. What is more, the trade management of a country might contribute to the reduction of its emissions and footprint. Facing climate change and the future scarcity of resources all nations will have to look for alternatives to reduce their emissions, and the allocation method can also help motivating the countries to do so.
VI. REFERENCES
[1] Andrew, R. et al. 2009. Approximation and Regional Aggregation in Multi-Regional Input-Output Analysis for National Carbon Footprint Accounting, Economic Systems Research, 21(3), 311-335 [2] Cumberland, J.H., 1966. A regional inter-industry model for the analysis of development objectives.
Papers in Regional Science Association 17, 64–94.
[3] Dobos, I. – Csutora M. 2010. The calculation of dynamic ecological footprint on the basis of the dynamic input-output model. Working paper, Corvinus University of Budapest
[4] GFN. 2008. National Footprint Accounts: Hungary. 2008 Edition for Year 2005., Global Footprint Network, Oakland, CA, USA
[5] GFN. 2010. Global Footprint Glossary, Global Footprint Networks, Oakland, CA, USA http://www.footprintnetwork.org/en/index.php/GFN/page/glossary/#carbonuptakeland Accessed: 2011.
01. 03.
[6] Finkbeiner M., 2009. Carbon footprinting - opportunities and threats, International Journal of Life Cycle Assessment, 14(2), 91–94
[7] Herendeen, R. A. – Tanaka, J. 1976. Energy cost of living. Energy, 1(2): 165–178.
[8] Kocsis, T. 2010. Hajózni muszáj! A GDP, az ökológiai lábnyom és a szubjektív jóllét stratégiai összefüggései (Navigare necesse est. The connections between GDP, ecological footprint and subjective welfare), Közgazdasági szemle 62(6): 536-554.
[9] Kenneth, H. 2010. Ecological Unequal Exchange: A comparative analysis, in: The State of the Art in Ecological Footprint Theory and Applications, Editor: Simone Bastianoni, Footprint Forum 2010, Colle Val d’Elsa, pp. 59-60.
[10] Leontief W.W., 1936. Quantitative input and output relations in the economic system of the United States. The review of economic statistics, 18(3), 105-125.
[11] Leontief, W.W., 1970. Environmental repercussions and the economic structure: an input–output approach. Review of Economics and Statistics LII (3), 261–271
[12] Lixon B., Thomassin P. J., Hamaide B., 2008. Industrial output restriction and the Kyoto protocol: An input–output approach with application to Canada. Ecological Economics 68(1-2): 249-258
[13] Monfreda et al. 2004. Establishing national natural capital accounts based on detailed ecological footprint and biological capacity assessments. Land Use Policy 21(3): 231-246.
[14] OECD Stan Database. Available at: http://stats.oecd.org/Index.aspx?DataSetCode=STAN Accessed at:
2010. 12. 01.
[15] Peters, G. P. 2008. From production-based to consumption-based national emission inventories.
Ecological Economics 65(1): 13-23.
[16] Prónay, S. – Málovics, G. 2008. Lokalitás és fenntartható fogyasztás [Locality and sustainable consumption], in: Lengyel, I. – Lukovics, M. (eds.) (2008). Kérdőjelek a régiók gazdasági fejlődésében.
Szeged: JATEPress, pp. 184-203
[17] Victor, A. P., 1972. Pollution : economy and environment, pp. 247, Georges Allen & Unwin Ltd.
(Eds.), Great Britain
[18] Wackernagel, M. and W. Rees. 1996. Our Ecological Footprint: Reducing Human Impact on the Earth.
Gabriola Island, BC: New Society Publishers.
[19] Wackernagel, M. et al. 2006. Allocating ecological footprints to final consumption categories with input-output analysis. Ecological Economics 56(1): 28-48.
[20] Wiedmann, T., Minx J. 2008. A definition of ‘Carbon Footprint’ In: Ecological Economics Research Trends (Editor: Carolyn C. Pertsova), Nova Science Publishers, Inc., Hauppauge, NY, USA. Chapter 1, pp.1-11.