Quantum Structure Classification by Kohonen Self-Organizing Map and by Fuzzy C-Means
Algorithm
Antal Ürmös*, Márk Farkas**, László T. Kóczy***, Ákos Nemcsics****
*Doctoral School of Applied Informatics, Óbuda University, Budapest, Hungary,
** Nexogen Ltd., Budapest, Hungary
*** Department of Automation, Széchenyi István University, Győr, Hungary
**** Institute of Microelectronics and Technology, Óbuda University, Budapest, Hungary E-mails: urmos.antal@phd.uni-obuda.hu, farkasmark@gmail.com,
koczy@sze.hu, nemcsics.akos@kvk.uni-obuda.hu
Abstract—Nowadays the nanostructures, formed on the way of self assembly are intensively investigated both in the basic and the applied sciences. In our paper, we investigate the structures on III-V compund semiconductor based materials, which are grown by epitaxial process. This process is analized by the beta version of Quantum Structure Analyzer 1.0, which is developed in C# langague, in the Microsoft© Visual Studio 2008 development environment. This software operates with the help of the Kohonen Self-Organizing Maps (SOM) algorithm and with the help of the Fuzzy C-Means algorithm. In present work, in the preface we give a short introduction of Molecular Beam Epitaxy (MBE), after this we introduce the algorithms, applied in this software. Finally, we demonstrate the results of the program.
I. INTRODUCTION
Nowadays the nanostructures, formed on the way of self assembly are intensively investigated, both in the basic and the applied sciences. The reason of this, that the self assembled structures grown by different epitaxial processes, are revolutionize the operation of the present electronic devices, and the future of the computing. These advantages are traceable to multiple reasons, for example the direct band transition of the semiconductor material or higher charge carrier mobility. Due to the mentioned novel properties of these materials, we can design such electronic devices, which we can not made from silicon (for instance blue LED) or we can produce with worse parameters (for example solar cells) [1]. These nanostructures (quantum dot, quantum well, quantum ring, double quantum ring, nano hole etc.) primarily can be made by Molecular Beam Epitaxy (MBE), on III-V based compund semiconductor substrate (for example GaAs, InP).
The characteristcs and the operation of this devices depends on the type, shape, size and the distribution of different nanostructures, formed on the surface. Because of this it is important to know during the growth, that in
the case of given technological parameters (for example arsenic pressure, temperature of the sample, gallium flux etc.), the nanostructures how can form and what kind of properties do they have. It is well known that there are two branches in the development of the solar cells. The first is the cheap thin fim solar cells (its efficiency is 3 4%) and the polycrystalline silicon-based solar cells (its efficiency is 5 15%), for everyday use [2] [3] [4]. The another research branch is the development high efficiency, inter alia space applications. This includes the tandem, the GaAs heterostructure based (its efficiency is around 28 30%) solar cells, or other compound semiconductor based solar cells which contains quantum wells (its efficiency is over 40%), or quantum dots (its efficiency is over 60%) [3]
[4].
Primarily these nanostructures are grown by molecular beam epitaxy (MBE). The solid phase layer growth essentially based on a principle, that we evaporate a monocrystalline thin film to a monocrystalline substrate (Fig. 1).
Figure 1. The structure of the MBE instrument (a.) and the process of the layer growth (b.) (source: [5]).
We produce the molecular beam by the heating of the Knudsen-cells, which contains high purity gallium and
arsenic. The evaporated atoms in the molecular beam do not interact with each other, until they arrived to the substrate. We can reach this large mean free path in ultra high vacuum (UHV), in 10 pressure. The following layers are also grown epitaxially and the substrate works as a seed crystal. So the evaporated layer crystallizes and its orientation will be the same as the substrate. The result of this process, that various nanostructures (quantum dots (QD), quantum rings (QR), double quantum rings (DQR), quantum wells (MQW), nano holes) are formed. The properties of these nanostructures (for example horizontal expansion, height, width, spatial distribution etc.) can be examined by atomic force microscopy (AFM).
There are numerous advantages of this technology [6]
compared to the other epitaxial processes. For example the low deposition temperature does not help in the diffusion between the layers and in the formation of error locations. Moreover controlled, low growth speed can be ensure (0.1-1 atomic series in each second) and the composition is well controllable by the opening and closing of the shutters, above the moleculat sources (Knudsen Cells).
The formation of nanostructures, during the growth, is analized by the beta version of Quantum Structure Analyzer 1.0, which is developed in C# langague, in the Microsoft© Visual Studio 2008 development environment. This software operates with the help of the Kohonen Self-Organizing Maps (SOM) the algorithm and with the help of the Fuzzy C-Means algorithm [7].
II. THEDESCRIPTIONOFTHEAPPLIEDALGORITHMS A. Kohonen Self-Organizing Maps
Neurobiological studies are shown, that the different sensory stimuli (for example hearing, sight etc.) can be orderly mapped to the operation of the appropriate area of the cerebral cortex. This is called topographic mapping.
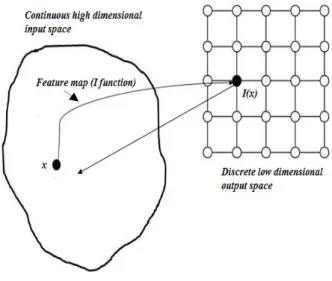
The Self-Organizing Maps (SOM) are an artifical topographic mapping (Fig. 2), inspired by neurobiological studies. In this figure, is an input vector and is the index of the selected neuron, in the output (also known as computational) layer. Its essence is, that we transform the arbitrary dimensional input to a one or two dimensional output space, in a topologically ordered form. The points of the mapping are the neurons, which are tuned selectively to various input patterns (or classes of input patterns). This means, that the given output neuron is activated for the impact of the given input. The activated neuron is also called winner neuron.
First, the theory of Kohonen Self-Organizing Maps (Kohonen SOM) was developed by a finnish scientist Teuvo Kohonen (1934-) in 1981 [8]. This algorithm belongs to the non-supervised neural networks. This
means, that the output assigned to the input is not known.
This mapping is a feedforward structure, with two layers (input and output layer). The each input in input layer are connected to the each output neurons in the output layer.
Figure 2. The topographic mapping.
The process of Kohonen Self-Organizing Mapping is the following:
1. Initialization 2. Competition 3. Cooperation 4. Adaptation
1. Initialization:
Generate random weight for all connections.
2. Competition:
A dimensional input is given x={xi, i=1…D} and the weight of the connections between the input i-th and the -th neuron is wj={wji, j = 1..N, i = 1..D}, where N is the number of the neurons. Define a discriminant function, which will be an Euclidean distance, between the x input vector and the w weight, for each neurons (1):
∑ . (1) The formula expresses, that the neuron will be the winner, which weight vector is closer to the input vector, than the others. In Fig. 3, the we indicated the winner neuron with black color.
3. Cooperation:
The neurobiological investigation are also showed, that a lateral interaction between the stimulated neurons are also appear. This means, that the nearby neurons around the winner neuron are also inclined to be in the stimulated state. This topological neighboring decays exponentially in the function of distance. Generally this decay happens by exponential function.
Figure 3. The winner neuron (black).
Let the σ0 and the τσ is a constant parameter (2):
. (2)
Let Sij is a distance between the i-th és a j-th neurons and I(x) be the index of the winner neuron. In this case (3):
,
, . (3)
This function is maximal at the winner neuron and
limt→∞Tj,I(x) = 0, translation invariant around the winner
neuron. In Fig. 4, the we indicated the winner neuron with black color and the stimulated neighbors with gray color.
Figure 4. The winner neuron (black) and the stimulated neighbouring neurons (gray).
4. Adaptation:
At the self-assembled networks there are an important role of the adaptive, i.e. learning processes, during which the neurons self-organising. Because of the topological neighboring, not only the winner, but the weight of the neighbors also change (of course not in the same scale, than the winner). Let the η0 and the τη is a constant parameter. The formula of the learning rate is the following (4):
. (4)
The formula of the weight changing is the following (5):
, . (5) The topological order is created by the repetition of this
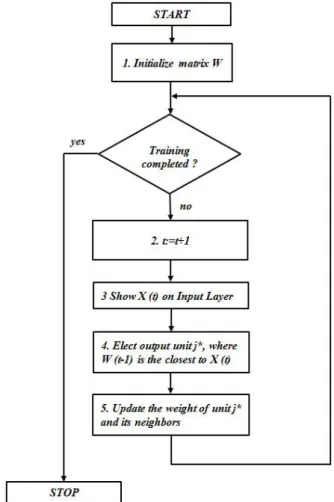
process for multiple times. In the Fig. 5, the flow-chart of the Kohonen SOM algorithm is shown.
Figure 5. The flow-chart of the Kohonen SOM algorithm.
B. The Fuzzy C-Means Algorithm
The segmentation of the images, partitioning them based on their properties to different homogenous regions is an important step in their processing. One solution is for this aim is the clustering. The essence of this process is, that we classify the pixels based on their similarity, for example the color of the pixels [9] or based on the
intensity of the gray scales [10] [11]. In this task there is a significant problem, that the various nanostructures usually not appear in their pure form, but in an arbitrary combination. Because of this, in the classification of nanostructures, there may be happen significant problems, because there is no a sharp border between them. The Fuzzy C-Means (FCM) algorithm compares the colors of each pixels with the color of the center point (centroid) [24]. In contrast to traditional clustering algorithms, the FCM instead of unequivocal decision (the pixel belongs to which cluster) we assign a number between 0 and 1, which tells us, that the pixel how belongs to the all clusters.
Let m is the number of the clusters and n is the number of the clustering points. The outcome of the algorithm is a m * n sized M matrix. The each row of this contains the membership function, which belongs to the given cluster.
The membership values of the cluster constructs a Ruspini-partition (their sum always be 1). Let p is the index of given point, P is the set of points to be clustered, ck the k-th cluster, C is the set of clusters and the µk(p) is the membership function of the given point (6):
: ∑ 1. (6) The center of the clusters is the significant part of the
result, thus in our case a two dimensional vector array (the output of the SOM is always a two dimensional mesh) with m different elements, where each element represent one cluster centroid. It can be calculated by (7), where the centroid of the cluster is actually the average of the each points, belongs the given cluster, weighted by the values of the membership functions. Let p is the index of given point, P is the set of points to be clustered, ck the k-th cluster, C is the set of clusters and the µk(p) is the membership function of the given point, and λ is a constant:
: ∑∑ . (7)
Do define a norm, on the space of cluster points. In our case the points of the clusters is the output of the Kohonen SOM, where equally useful the Euclidean or the Mahattan distance (this equal to the absolute values of the sum of the coordinates) as well. From many point of view is beneficial, that we use the output of Self- Organizing Mapping as the input of Fuzzy C-Means algorithm. One of the advantages is, for example we can not define a coherent and valid metrics for input space, because the each inputs have another scale (for instance linear or logarithmic). This problem can be solved by SOM.
The membership value of the given cluster is inversely proportional with the distance of the cluster centroid, using the following (8) norm:
: . (8)
To satisfy the (6) condition, the coefficient need to be normalized and fuzzificated with a λ > 1 parameter. So the (8) condition will be the following:
:
∑
. (9)
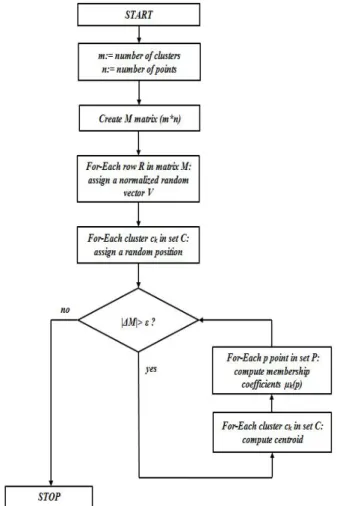
The flow-chart of the clustering algorithm is shown in Fig. 6.
Figure 6. The flow-chart of the Fuzzy C-Means Clustering algorithm.
III. RESULTS
The software (the beta version of Quantum Structure Analyzer 1.0) reads the input data from an Microsoft Excel© worksheet. These data are collected from the literature [12] [13] [14] [15] [16] [17] [18] [19] [20] [21]
[22] [23]. In the Fig. 7, there are the results, due to given settings (Fig. 7.a), after the running of FCM algorithm (Fig. 7.b).
Figure 7. The settings of our program (a.) and its results, after the running of FCM algorithm (b.).
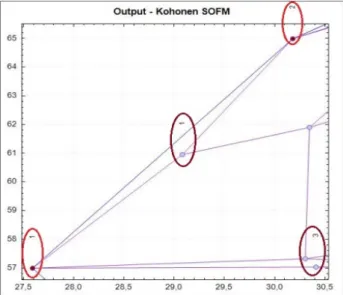
In the Fig. 8, the enlarged part of the Fig.7 is shown. The dark red filled circles (in red circles) are the winner neurons, the light blue filled circles (in claret circles) are the neighbors of winner neurons (they activated by lateral interaction (cooperation)). The thin purple line indicates the two neurons are neighbors, the thin blue line is the border of the convex hull. The numbers, nearby the winner and its neighbor neurons indicates, that which input vector is activated the given neuron.
Figure 8. One part of the result of our software.
In the Fig. 9, there is another enlarged part of the Fig.7.
In this figure, the purple point (signed by „A” in a claret circle) is the center point (centroid) of the given cluster.
The points (neurons), belongs to this cluster, either can be a quantum dot, quantum well, quantum ring, double quantum ring and nano hole as well. For the concrete statement, that which condtions are needed for the formation of given nanostructure, further investigations and more measured data (from AFM image, from RHEED intensity image, or from the literature) are necessary.
Figure 9. The centroid of arbitrary cluster (purple point in a red circle).
CONCLUSION
As we can see from the other part of this article, the Kohonen SOM and the FCM algorithm efficiently useful from the viewpoint of cluster analysis. The dimensional input set can be mapped into two dimension, by the SOM algorithm and we can identify the various nanostructures, by the FCM algorithm. For the concrete statement, that which condtions are needed for the formation of given nanostructure, further investigations and more measured data are necessary.
ACKNOWLEDGMENT
The authors would like to say thank you for Judit Bozsik former student, who helped them in the data collection.
REFERENCES
[1] I. Réti and A. Ürmös, "MBE technology in the colourful LED and solar cell production," Óbuda University, e-Bulletin, vol. 3, no. 1, 2012.
[2] Nemcsics Á., "Vékonyrétegekről, nanostruktúrákról a napelem ürügyén" Fizikai Szemle, pp. 293-299, Szeptember 2006.
[3] Nemcsics Á., A napelem működése, fajtái és alkalmazása.
Budapest: BMF-KVK, 2005.
[4] Nemcsics Á., "Új irányok a napelemes technológiában,"
Elektronikai Technológia, Mikrotechnika, pp. 39-45, 2009.
[5] Nemcsics Ákos, Réti István, Serényi Miklós, Tényi Gusztáv, Hodován Róbert, Gábor József ,Taar István Gergely, Pántos János, Bozsik József, Molnár Sándor, Jankóné Rózsa Mária,
"Beszámoló a BMF-MTI és az MTA-MFA közös laboratóriumában található MBE berendezés üzembe helyezéséről," Elektronikai Technológia, Mikrotechnika, p. 33, 2009.
[6] Réti I., Tényi V. G., Kucsera P., Tóth L., Harmat P., A. Mieville, Csutorás M., Kupás-Deák B., Sándor T., Bozsik J. Nemcsics Á.,
"Molekulasugár-epitaxiás nanostruktúrák előállításának műszaki feltételei," GÉP, vol. LXI., pp. 29-32, Augusztus 2010.
[7] M. Farkas, L. T. Kóczy, Á. Nemcsics, "A hybrid approach on dimension reduction and fuzzy clustering of droplet epitaxial grown quantum structure experiments," , 3rd Symposium on Computational Intelligence, Győr, 2009.
[8] T. Kohonen, Self-Organizing Maps, 3rd ed.: Springer, 2001.
[9] Arif Khan. (2009, August) Computer Vision Applications with C# - Part IV. [Online].
"http://www.codeproject.com/Articles/38888/Computer-Vision- Applications-with-C-Part-IV"
[10] János Pipek , Imre Varga, "Universal classification scheme for the spatial localization properties of one-particle states in finite d-dimensional systems," Phys. Rev. A., vol. 46, pp. 3148–3164, 1992.
[11] B. Varga, A. Ürmös, Sz. Nagy, and I. Mojzes, "Fractal properties of gold, palladium and gold-palladium thin films on InP,"
Vacuum (Elsevier), vol. 84, pp. 247-250, 2010.
[12] A. Stemmann, A. Schramm, H. Welsch, W. Hansen, and A.
Nemcsics Ch. Heyn, "Faceting during GaAs quantum dot self- assembly by droplet epitaxy," Applied Physics Letters, vol. 90, no. 20, pp. 3105-3107, May 2007.
[13] Z. C. Niu, S. S. Huang, Z. D. Fang, B. Q. Sun, and J. B. Xia Z.
Gong, "Formation of GaAs/AlGaAs and InGaAs/GaAs nanorings by droplet molecular-beam epitaxy," Applied Physics Letters, vol. 87, no. 9, pp. 3116-3118, Sept. 2005.
[14] T. Mano, T. Kuroda, T. Tateno, K. Sakoda1, G. Kido, N.
Koguchi, and F. Minami M. Yamagiwa, "Self-assembly of laterally aligned GaAs quantum dot pairs," Applied Physics Letters, vol. 89, no. 11, pp. 3115-3117, Sept. 2006.
[15] T. Kuroda, K. Mitsuishi, T. Noda, K. Sakoda T. Mano, "High- density GaAs/AlGaAs quantum dots formed on GaAs (311)A substrates by droplet epitaxy," Journal of Crystal Growth, vol.
311, no. 7, pp. 1828-1831, March 2009.
[16] A. Tukiainen, A. Aho, M. Pessa A. Schramm, "Comparing morphology studies of GaAs quantum dots grown by droplet epitaxy on GaInP and GaAs," Journal of Crystal Growth, vol.
311, no. 8, pp. 2317-2320, April 2009.
[17] A. Stemmann, A. Schramm, W. Hansen Ch. Heyn, "Droplet epitaxy of GaAs quantum dots on (0 0 1), vicinal (0 0 1), (1 1 0),and (3 1 1)A GaAs," Journal of Crystal Growth, vol. 311, no.
7, pp. 1825-1827, March 2009.
[18] K. Watanabe, T. Tateno, M. Gurioli, P. Werner, M. Wakaki, N.
Koguchi S. Sanguinetti, "Modified droplet epitaxy GaAs/AlGaAs quantum dots grown on a variable thickness wetting layer," Journal of Crystal Growth, vol. 253, no. 1-4, pp.
71-76, June 2003.
[19] N. Koguchi T. Mano, "Nanometer-scale GaAs ring structure grown by droplet epitaxy, Journal of Crystal Growth," Journal of Crystal Growth, vol. 278, no. 1-4, May 2006.
[20] T. and Mano, T. and Ochiai, T. and Sanguinetti, S. and Sakoda, K. and Kido, G. and Koguchi, N. Kuroda, "Optical transitions in quantum ring complexes," Physical Review B, vol. 72, no. 20, pp. 5301-5308, Nov 2005.
[21] Ch. Heyn, A Stemmann, A Schramm, H Welsch, W Hansen A Nemcsics, "The RHEED tracking of the droplet epitaxial grown quantum dot and ring structures," Materials Science and Engineering B-advanced Functional Solid-state Materials, vol.
165, pp. 118-121, Nov. 2009.
[22] Takashi Kuroda ,Stefano Sanguinetti ,Tetsuyuki Ochiai ,Takahiro Tateno ,Jongsu Kim ,Takeshi Noda ,Mitsuo Kawabe ,Kazuaki Sakoda ,Giyuu Kido, and Nobuyuki Koguchi Takaaki Mano, "Self-Assembly of Concentric Quantum Double Rings,"
Nano Letters, vol. 5, no. 3, pp. 425–428, Feb. 2005.
[23] Nobuyuki Koguchi and Keiko Ishige, "Growth of GaAs Epitaxial Microcrystals on an S-Terminated GaAs Substrate by Successive Irradiation of Ga and As Molecular Beams," Jpn. J. Appl. Phys., vol. 32, pp. 2052-2058, 1993.
[24] Christophe Gauge. (2011, Mar.) Computer Vision Applications with C# - Fuzzy C-means Clustering. [Online].
"http://www.codeproject.com/Articles/91675/Computer-Vision- Applications-with-C-Fuzzy-C-means"
![Figure 1. The structure of the MBE instrument (a.) and the process of the layer growth (b.) (source: [5])](https://thumb-eu.123doks.com/thumbv2/9dokorg/1174203.85946/1.892.461.793.848.1057/figure-structure-mbe-instrument-process-layer-growth-source.webp)