Revised manuscript
Final version published in:
Journal of Colloid and Interface Science 2019, 549, 150-161.
doi: 10.1016/j.jcis.2019.04.058
Chemical structure and in vitro cellular uptake of luminescent carbon quantum dots prepared by solvothermal and microwave
assisted techniques
Gergő Gyulai
1*, Fatima Ouanzi
1, Imre Bertóti
2, Miklós Mohai
2, Tamás Kolonits
3, Kata Horváti
4, Szilvia Bősze
41 Laboratory of Interfaces and Nanostructures, Institute of Chemistry, Eötvös Loránd University, Budapest, P.O.Box 32, H-1518 Budapest, Hungary
2 Institute of Materials and Environmental Chemistry, Research Centre of Natural Sciences, Hungarian Academy of Sciences, Budapest, POBox 286, H-1519 Budapest, Hungary
3 Department of Materials Physics, Eötvös Loránd University, Budapest, P.O.Box 32, H-1518, Hungary
4 MTA-ELTE Research Group of Peptide Chemistry, Eötvös Loránd University, Budapest 112, P.O.Box 32, H-1518 Budapest, Hungary
Abstract
Carbon quantum dots (CQDs) are a novel family of fluorescent materials that could be employed as non-toxic alternatives to molecular fluorescent dyes in biological research and also in medicine. Four different preparation approaches, including microwave assisted heating and solvent refluxing, were explored. In addition to the widely used microwave assisted methods, a simple convenient new procedure is presented here for the particle synthesis. A detailed X-ray photoelectron spectroscopic (XPS) analysis was employed to characterize the composition, and more importantly, the chemical structure of the CQD samples and the interrelation of the characteristic surface chemical groups with the fluorescence properties and with surface polarity was unambiguously established. In vitro cellular internalization experiments documented their applicability as fluorescence labels while non-toxic properties were also approved. It was demonstrated that the adequate water-dispersibility of the particles plays a crucial role in their biological application. The synthetized CQD samples turned to be promising for cellular imaging applications both in laser illuminated flow cytometric measurements and in fluorescence microscopy.
* Corresponding author. E-mail: ggyulai@chem.elte.hu, gyulaigor@gmail.com
1. Introduction
A wide range of materials have been developed as fluorescence probes for labeling and diagnostic applications. These include small molecular dyes, fluorescent proteins and semiconductor nanodots. While all of these materials have unique advantages in some fields their applicability is also riddled with pitfalls [1]. In 2004 a new class of fluorescent materials, separated from carbon nanotube fragments was described by Xu et al. [2]. These nanoscaled carbon-based particles exhibited strong fluorescence and narrow size distribution. Since then, more extensive research went into the preparation and characterization of different types of carbon based nanodot systems owing to their advantages to be used as fluorescent probes. These properties include high intensity luminescence and high photostability, low toxicity, biocompatibility, chemical inertness and small size. The nanodots have been found to possess a core-shell type structure. Graphitic clusters doped with oxygen and nitrogen heteroatoms form the core of the particles surrounded by amorphous carbon frames with various surface functional groups [3].
High number of precursors have been discussed as possible sources for the preparation of these luminescent materials. These range from graphite [4], and carbon nanotubes [2,5] to simple organic materials, like sugars [6], citric acid [7], ethylene diamine [8], amino acids [9] as well as more complex organic sources like wood [10], milk [11], petroleum coke [12] and eggs [13].
Numerous methods have been described for the preparation of carbon nanodots [14,15]. These can be classified as top-down or bottom-up strategies. Top-down methods range from high- energy ion beam irradiation of diamonds [16], laser ablation of graphite [17], ball-milling of activated carbon [18] and acidic digestion of graphene oxides [19]. Bottom-up synthesis methods are usually based on the thermal decomposition of organic materials by microwave assisted pyrolysis or hydrothermal conversion [20,21,22,19,23]. This latter method has gathered distinguished attention as it enables the use of a wide variety of precursors from organic compounds to natural products and offers an economic way of synthesis suitable for both small and large scale [24,25,13,26,27].
The fluorescence mechanism of carbon nanodots is still debated. Generally, three alternative or concurrent photoluminescence mechanisms can be assumed. These are the quantum confinement effects related to the conjugated systems of the carbon core, surface states related to the functional groups present on the carbon backbone or the molecular states, originating from
fluorescent molecules bound to the particles [28]. The size of the carbon nanodot structures is usually described as being less than 10 nm, typically of 1–3 nm. Based on the quantum confinement interpretation of the fluorescence properties, the size of the particle directly influences the emissive properties of the material. Therefore, attempts have been made to regulate the particle size of the nanodots. This can involve the separation of particles into size fractions [29] or the usage of templates during preparation [27,30]. In any case for carbon dots the effect of surface states appeared to be more pronounced in the determination of their luminescence properties. The introduction of different heteroatoms into the carbon structures has been shown to greatly influence the properties of the nanodots [23]. Nitrogen doping was found to increase the luminescence of the particles as well as shifting the excitation and emission to longer wavelengths [3]. The introduction of heteroatoms also changes the possible chemical and biological interactions so that the particles are capable facilitating selective metal-ion binding [31], antimicrobial activity [32] or serve as specific analytical sensors [33,34,35].
Carbon quantum dots have also received increasing attention owing to their excellent biocompatibility and low level cytotoxicity, because these particles do not contain toxic heavy metals unlike their other fluorescent counterparts, quantum dots and some organic dyes [36,37].
Recent studies have shown that carbon dots can be used to deliver therapeutics into target cells, both in vivo and in vitro, they have been applied to intracellular drug delivery [38,39,40,41,42,43,44,45]. Mainly in vitro studies to date have tested the effects of carbon dots exposure on different cell types [46]. It is possible that carbon dots toxicity and cellular uptake may vary in different cell types which is important because different mechanisms of uptake and intracellular processing may dictate the mode that the loaded “active moiety” is processed by the cells [47].
In the present work carbon quantum dots (CQD) were prepared by a convenient synthesis using readily available precursors. The effect of solvent and preparation method on the resulting product was studied while the composition and structure of the products was characterized using atomic force microscopy (AFM), X-ray diffraction (XRD), and X-ray photoelectron spectroscopy (XPS). The fluorescence properties were analyzed relating to the composition and chemical structure of the CQD. Non-toxic properties and cellular uptake were also tested with the aim of their application as efficient markers in cellular assays.
2. Experimental 2.1 Materials
Citric acid monohydrate (Sigma-Aldrich, Hungary) and urea (Reanal) used in carbon nanoparticle synthesis were of analytical grade and applied without further purification.
Dimethyl sulfoxide (DMSO) and absolute ethanol were purchased from VWR International and were of analytical grade. Double distilled water was checked by its conductivity (<5 mS) and surface tension (>72.0 mN/m at 25 ± 0.5 °C).
All materials used for in vitro experiments were suitable for cell culture (bioreagent grade and tested) namely: RPMI-1640, fetal bovine serum (FBS), glutamine (Lonza, Basel, Switzerland), trypsin and gentamicin (Sigma-Aldrich, Budapest, Hungary). The HPMI (HEPES buffered RPMI) buffer was prepared and sterile-filtered in our laboratory using components obtained from Sigma-Aldrich, analytical grade (NaCl, KCl, MgCl2, CaCl2, NaHCO3, Na2HPO4), 4-(2- hydroxyethyl)piperazine-1-ethanesulfonic acid (HEPES), glucose (cell culture grade).
2.2 Carbon quantum dot preparation
Carbon nanoparticles were synthesized using citric acid and urea as precursors. Water and dimethyl sulfoxide (DMSO) were employed as solvents and two types of reaction procedures, microwave assisted heating and refluxing the solution over an oil bath, were performed. For the microwave assisted reaction the reactants were dissolved in water or in DMSO. In a typical reaction 5 mmol citric acid was dissolved in 10 mL solvent until a clear solution was achieved then 10 mmol urea was added and dissolved. The reaction mixture was heated in a commercial microwave oven (800 W) for 5 min while the reaction mixture gradually changed its color from transparent to black. In the solvothermal method similar reaction mixtures were refluxed over an oil bath at a temperature of 180 °C for 16 hrs. Due to the boiling points of the solvents, the effective reaction temperature for the aqueous refluxing was 100 °C, while 180 °C for DMSO.
Samples were thoroughly purified after both types of reaction. Sample volumes were restored to 10 mL with water or DMSO then centrifuged at 1000 g to remove the aggregates. Samples prepared in water were precipitated in 100 mL of ethanol. The precipitate was separated by centrifugation at 3500 g. The particles were further washed 4 times by sonication with fresh 50 mL aliquots of ethanol followed by a centrifugation step. Finally, the particles were dispersed in water and lyophilized for storage. Similar purification method was used for particles prepared
in DMSO with the exception that water was used to precipitate the particles. Sample codes with the corresponding synthesis method and solvents are listed in Table 1. Each sample was prepared in at least three parallel synthesis.
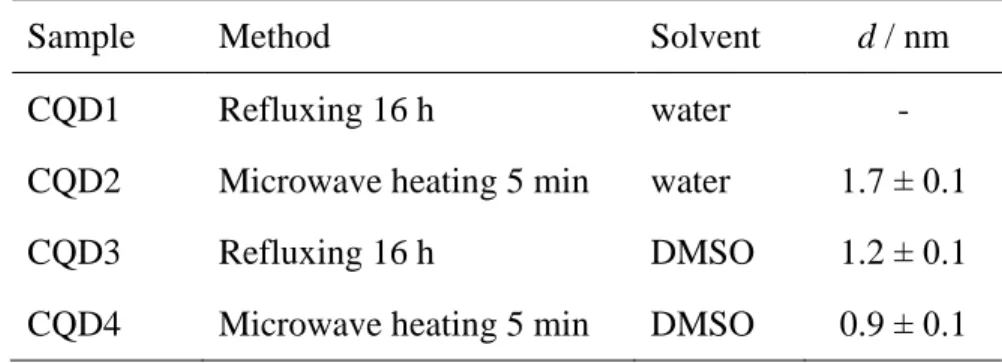
Table 1. Preparation methods and average size of carbon quantum dots determined by atomic force microscopy
Sample Method Solvent d / nm
CQD1 Refluxing 16 h water -
CQD2 Microwave heating 5 min water 1.7 ± 0.1
CQD3 Refluxing 16 h DMSO 1.2 ± 0.1
CQD4 Microwave heating 5 min DMSO 0.9 ± 0.1
2.3 Size and zeta-potential determination
Particle size was evaluated using dynamic light scattering (DLS) and atomic force microscopy (AFM). The DLS system (Brookhaven Instruments, USA) consists of a BI-200SM goniometer and a BI-9000AT digital autocorrelator. As a light source a Coherent Genesis MX488-1000STM laser-diode system operating at 488 nm wavelength and emitting vertically polarized light was used. Measurements were carried out at a detection angle of 90° and a temperature of 25 °C with nanoparticle samples appropriately diluted with doubly distilled water. The recorded autocorrelation functions were analyzed by the second order cumulant expansion and Contin method.
The sample morphology was studied using AFM. Highly diluted aqueous and DMSO dispersions of the particles were deposited on freshly cleaved mica. The samples were dried in vacuum for at least 2 hrs before the measurement [48]. Surface was imaged using a Nanosurf Flex-Axiom atomic force microscope system operating in non-contact mode, using BudgetSensors Tap190Al- G silicon cantilever with a force constant of 48 N/m. Vertical accuracy of the instrument in this mode is around 0.05 nm. Each sample was imaged in 1×1 µm2 areas at 10 randomly selected locations.
The determination of electrophoretic mobility of nanoparticles was carried out by means of Malvern Zetasizer Nano Z apparatus at 25 °C in 2 mM NaCl solution medium to ensure a
constant ionic strength. Results were collected in triplicates. Smoluchowski approximation was used to calculate zeta potential (ζ) from mobility values.
2.4 X-ray diffraction
XRD measurements were performed by a Rigaku Smartlab diffractometer using mixed copper radiation with a wavelength λ(CuKα1,2) = 0.154186 nm. A grazing incidence geometry was used during the measurements by an incidence angle of ω = 0.3° and wide angle scattering between 2Θ = 10°–119° angles.
2.5 X-ray photoelectron spectroscopy
X-ray photoelectron spectra were recorded on a Kratos XSAM 800 spectrometer operating in fixed analyser transmission mode, using Mg K1,2 (1253.6 eV) excitation. The pressure of the analysis chamber was lower than 1·10-7 Pa. Survey spectra were recorded in the kinetic energy range 150–1300 eV with 0.5 eV steps. Photoelectron lines of the main constituent elements, i.e., the O1s, N1s and C1s, were recorded by 0.1 eV steps and 1 s dwell time. Spectra were referenced to the energy of the C1s line of the sp2 type graphitic carbon, set at 284.3 ± 0.1 eV binding energy (B.E.). A Gaussian-Lorenzian peak shape (70/30 ratio) was used for peak decomposition, except for the graphitic C1s, where asymmetric shape was used, derived from oxygen-free highly oriented pyrolytic graphite (HOPG). Quantitative analysis, based on peak area intensities after removal of the Shirley-type background, was performed by the Kratos Vision 2 and by the XPS MultiQuant programs [49], using experimentally determined photo- ionization cross-section data of Evans et al. [50] and asymmetry parameters of Reilman et al.
[51]. In all cases, unless otherwise stated, the conventional infinitely thick layer model was employed, where all components are supposed to be homogeneously distributed within the sampling depth detected by XPS. Chemical shifts, representing different bonding states of the nitrogen and oxygen to the carbon matrix and also of the reacted carbon, were evaluated by applying accurate peak decomposition procedure using the Kratos Vision 2 software.
Measurements were performed, as in general practice, on unique samples thus scatter of data cannot be supplied. The error of the quantitative XPS results, as generally accepted, is ±5 relative %
2.6 Fluorescence properties
For the characterization of the luminescence properties two types of measurements were carried out in a Varian Cary Eclipse fluorescence spectrophotometer. 3D spectra were recorded using appropriately diluted samples (1 mg/L) dispersed in water or DMSO. The measured intensity was normalized using the integral of Raman-scattering spectrum of pure water. The quantum yield of the samples at 350 nm excitation wavelength was determined using quinine sulfate as a standard. UV absorbance at 350 nm (Analytic Jena, Specord 40) and the emission spectrum integral were measured for series of samples and standard concentrations. The gradients of the emission integral vs absorbance plots were determined for the samples and the standard (B, BSt) and the quantum yield (Φ) was calculated as
where ΦSt is the known quantum yield of the standard, while n and nSt are the sample and standard solution refractive indices. Concentrations were kept in a range where the absorbance values at the excitation wavelength were below 0.1.
2.7 Internalization profile of nanodots on MonoMac6 human cells
In vitro cellular uptake measurements were used to study the interaction of CQDs with mammalian cells. Internalization of nanodots was measured on MonoMac6 human monocytic cell line (DSMZ, ACC-124 [52]) by using a BD LSR II flow cytometer (BD Biosciences, San Jose, CA, USA) with 488 nm (Coherent Sapphire, 22 mW) laser. MonoMac6 cells were maintained as an adherent culture in RPMI-1640 media supplemented with 10% heat-inactivated foetal calf serum (FCS) L-glutamine (2 mM) and gentamicin (35 μM) at 37 °C in humidified atmosphere containing 5% CO2. Cells were treated with the nanodots at 0.3 and 0.15 mg/ml final concentrations and were incubated for 1.5 hrs. After washing twice with serum free RPMI medium, supernatants were removed and 100 μL 0.25% trypsin was added to the cells. Two minutes incubation with trypsin was followed by the addition of 0.8 mL 10% FCS/HPMI medium then cells were washed and re-suspended in 0.25 mL HPMI (HPMI: 100 mM NaCl, 5.4 mM KCl, 0.4 mM MgCl2, 0.04 mM CaCl2, 10 mM HEPES, 20 mM glucose, 24 mM NaHCO3 and 5 mM Na2HPO4 at pH=7.4 [53]). The intracellular fluorescence intensity of the cells was measured on channel FITC
LP505 (emission at λ=505 nm; LP 505, BP 530/30, excitation λ= 488 nm) and data were analysed with FACSDiva 5.0 software. All measurements were performed in triplicates and the mean fluorescent intensity and the percentage of FITC positive (nanodot containing) cells was graphically presented. To assess relative viability, percentage of live cells was compared to untreated control cells.
Parallel with flow cytometry measurements, to visualize the uptake and cell morphology after nanodot treatments, microscopic images of MonoMac6 cells were captured. Washed and resuspended cells were plated on a 96-well flat bottom tissue culture plate and images of the adherent cells were captured using an Olympus CKX41 microscope (Hamburg, Germany, equipped with Olympus U-RFLT50 mercury-vapor lamp, WideBlue DM500 BP460-490 BA520 IF filter, excitation wavelength range: 460–490 nm, objective: 20×).
3. Results and discussion
3.1 Synthesis
Carbon nanoparticles were prepared in four different ways (CQD1–4), applying conditions summarized in Table 1. In the refluxing experiments the reaction mixture turned the color to black gradually during the 16 h synthesis. Following purification and lyophilization, the sample prepared in DMSO (CQD3) was isolated as a black powder while the one created in water (CQD1) had a dark green, sticky resin-like appearance. Sample to sample batches were similar in appearance. Therefore, it must be mentioned that because of no particle formation could be detected in case of CQD1, consequently these samples are left out from any further characterization. Using microwave synthesis, the final products after only 5 min reaction were dark brown to black powdery materials after drying (CQD2 and CQD4), and their appearance being similar in case of both water and DMSO solvents.
All samples could be readily re-dispersed in their respective solvents after lyophilization without using any lyoprotectants. A notable difference between the products was their apparent polarity.
CQD1 was only dissolvable in water. This fact combined with the appearance indicates that particle formation is not achieved at such mild reaction conditions. CQD2, prepared in water, was readily dispersible in water and DMSO but appeared to aggregate and sediment in organic solvents like ethanol, acetone, THF and chloroform. This observation suggests that CQD2
particles have highly hydrophilic surface. On the other hand, the particles prepared in DMSO (CQD3, CQD4) could only be re-dispersed easily in DMSO, and precipitated in water, suggesting a less polar surface character.
In the aqueous medium used for biological experiments it is necessary for the CQDs to be dispersed. To achieve this, we developed a method to transfer the CQD3 and CQD4 samples into aqueous medium using controlled precipitation. 10 mg particles were dispersed in 2 mL of DMSO then added drop wise to 10 mL of water under magnetic stirring (500 rpm). The resulting sol was then dialyzed against 3×2 L water using 3500 MWCO regenerated cellulose membrane.
Under these conditions CQD3 formed a stable sol without any signs of aggregation or sedimentation even after 1 month of storage. CQD4, however, precipitated and sedimented on a timescale of minutes. This indicates that there is a significant difference in the polarity between the two samples and CQD4 is the most hydrophobic particle.
3.2 Size, morphology and zeta-potential
Particle size was investigated using AFM in non-contact mode. No distinctive particles could be found in sample CQD1. This, together with the waxy appearance of the sample indicates that reaction conditions were not suitable to reach the particle formation stage. As postulated by Zhu et al. acid and diamine-based carbon nanoparticles form in a two-step process [21]. First a polycondensation step occurs between the carboxylic and amine groups resulting in a polymer type intermedier. During the second carbonization step the polymer loses water at high enough temperature and the particles are formed. Ogi et al. postulates that in the reaction between citric acid and urea first a citric acid amide is formed at lower temperatures. Increasing the temperature results in further condensation between citric acid and citric acid amide molecules leading to ring structure and consequently CQD formation [54].
If a similar particle formation mechanism was assumed, the reaction only proceeded to the polymerization step in the case of CQD1, likely due to the low boiling point of the aqueous solution. Therefore, this system was omitted from further investigations.
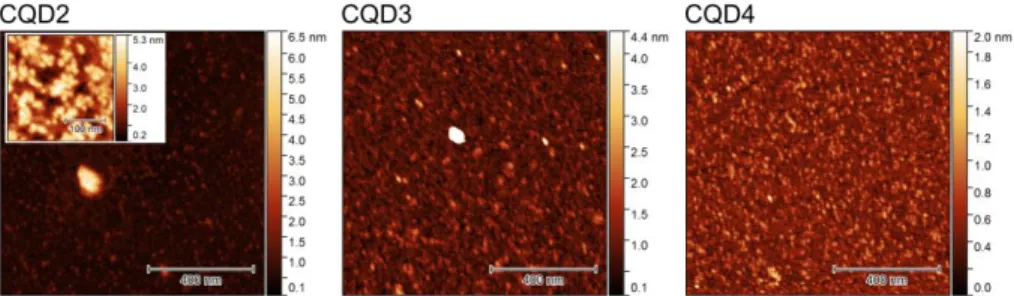
Figure 1. AFM topography images of CQD samples
The AFM images of the three other samples are shown in Fig. 1. Particles appear to be spherical in shape with an average diameter of 1–2 nm and narrow size distribution. DLS measurements also support the small size of the particles as no meaningful size could be determined, indicating that hydrodynamic diameters are below 10 nm. The average diameters determined from AFM height profiles (n > 2000) show that within this small size range, there is a significant difference in the diameters of the CQDs (Table 1). CQD2 particles had an average diameter of (1.7 ± 0.1) nm (confidence level of 95% and taking into account the vertical accuracy of the AFM). Comparably, the average size of CQD3 was slightly smaller, at (1.2 ± 0.1) nm while CQD4 particles had an average diameter of (0.9 ± 0.1) nm. The differences in size can be attributed to the different reaction conditions. In the case of aqueous microwave assisted heating, due to the lower boiling temperature of water particle formation was slower resulting in bigger particles. The high boiling point of DMSO (189 °C) could help to accelerate the particle formation step as the higher temperature favors the carbonization step leading to more compact particles.
Zeta-potential of the water dispersible particles, CQD2 and the stable sol of CQD3 was characterized by electrophoretic mobility measurements. Both particles exhibited a negative potential, (-30.7 ± 0.3) mV for CQD2 and (-14.2 ± 1.4) mV for CQD3. The decrease in zeta potential can be paralleled with the decrease in apparent polarity of the particles. The negative values can be attributed to surface carboxylic groups. According to the particle formation mechanism, these carboxylic groups take part in the ring closure reaction leading to the formation of the aromatic core of the CQDs. Higher temperatures favor this process, leading to decreased carboxylic group content and subsequently reduced zeta potential.
3.3 Composition and chemical structure
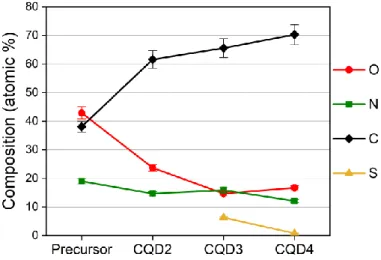
Chemical composition of the CQD samples was determined using XPS. Results of quantitative evaluation of the overall intensities of high resolution O1s, N1s, C1s and S2p XPS spectra are presented in Fig. 2, together with the calculated values for the 2:1 molar ratio of the precursor (urea : citric acid) constituents. As seen, the basic change happened in the course of the reaction is the loss of oxygen and the relative increase of carbon content. The nitrogen content also slightly reduced. Since the precursors contain no sulfur, the presence of sulfur in CQD3 and CQD4 originates from the DMSO solvent used in the preparation.
Figure 2. Chemical composition (atomic %) of the precursor and the prepared CQD samples. Error bars represent 5% relative error.
The chemical environment of the elements presents in the CQD samples can be quantitatively characterized after performing accurate peak fitting procedure of the recorded spectral lines. In the applied experimental conditions, the FWHM (full width at half maximum) of the symmetric C1s, N1s and O1s components of the C−N and C−O bonds are in the range of 1.8–1.9 eV. The energy position of the C1s, N1s and O1s peak components and their assignment to different bonding states are based on the assumed analogy with polymer substances of well-defined structure measured reliably at similar conditions [55]. A large number of examples of such compounds are reported in the literature [56,57,58]. Recently published data on cold plasma
treated carbonaceous materials containing N and O atoms were also incorporated in the bonding assignment [59].
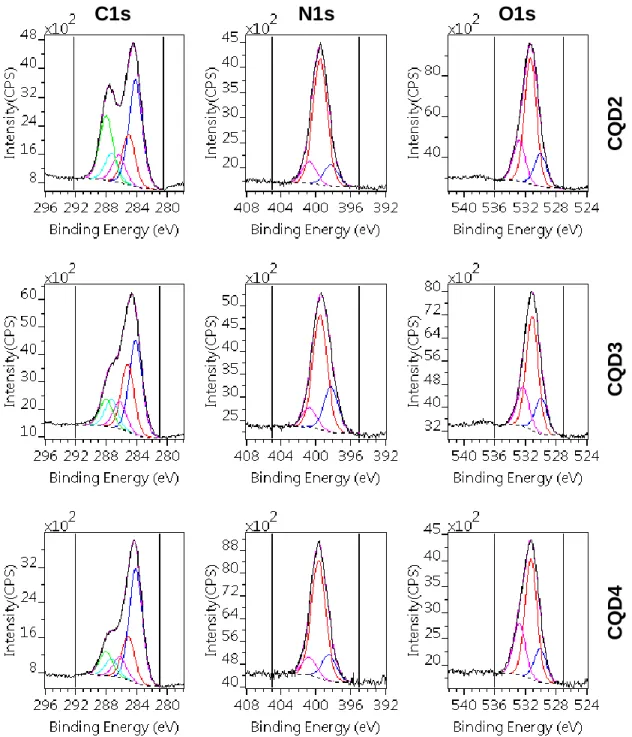
The results of the peak fitting procedures for the three CQD samples are presented in Fig. 3 and Table 2. The energy position and also the widths of the peak components used for fitting all of the recorded CQD peak envelops does not differ more than ±0.1 eV of the values cited in the Table 2.
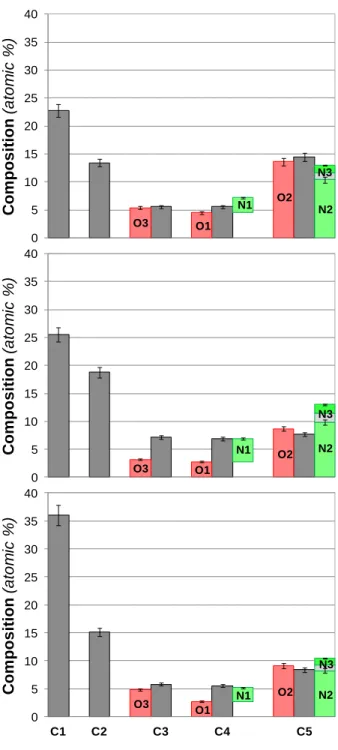
Figure 3. Decomposition of the C1s, N1s and O1s photoelectron spectra of CQD samples to different chemical states. Direction of numbering of components
(C1, C2 ,N1, N2, etc.) is from low to high BE values.
Attempts have been made to describe the reaction mechanism of the carbon quantum dot formation using these or similar precursors [21,60]. In addition to the complete graphitization, C–N–O containing molecular chains or fragments are suggested as intermediate states primarily
C1s N1s O1s
CQD2CQD3CQD4
responsible for the luminescence [61,62]. Considering of the suggested structures, here we propose such molecular fragments (C1–C5 in Table 2) for fitting the C1s lines what may be applied to construct those molecular structures. On the other hand, we thought that these components may represent decomposition residues from the precursors and also the reports intermediate states.
Table 2. Decomposition of the photoelectron spectra: the binding energy (±0.1 eV) and chemical state assignation of various components and the surface composition (atomic %) of the precursors (theoretical values) and the carbon quantum dot samples.
O1 O2 O3 N1 N2 N3 C1 C2 C3 C4 C5 S1 S2
BE (eV) 530.1 531.4 532.5 398.3 399.6 400.8 284.3 285.1 286.4 287.4 288.1 163.9 166.4 Chemical
states
Surface composition (atomic %)
Precursors 4.8 14.3 23.8 19.0 9.5 4.8 23.8
CQD 2 3.2 16.0 4.5 1.9 10.9 1.9 24.3 11.2 5.9 6.1 14.1
CQD 3 2.8 8.8 3.1 4.0 10.2 1.7 25.4 19.9 5.0 7.2 8.1 3.5 2.8 CQD 4 2.7 9.7 4.3 2.2 8.7 1.2 36.5 13.9 6.6 5.6 7.7 0.0 0.8 *Note: the error of the quantitative XPS results is ±5 relative %
The N1–N3 and the O1–O3 components proposed for fitting the N1s and O1s spectra are involved as the corresponding counterparts of the C3–C5 components. The C1 component, apparent at 284.3 eV, represents the graphitic carbon in the samples. The C2 component at 285.1 eV being either C–CH residue or intermediate, ill-defined (amorphous) sp3 type carbon attached to the graphitic core.
Attempts, though not very detailed, were made to characterise the chemical moieties of similar carbon dot products by XPS [62]. Here we proposed and described a novel rigorous approach in order to increase significantly the reliability of the chemical state determination of the prepared CQD samples. The validity of our peak fitting process with overlapping peaks and also the bonding-state assignment of the components for the CQD samples can be questioned unless self- consistency could be established between these procedures. Except of our previous publication
C O
O C O
N C O
O C C
OH
C N
NH
C C
C N O
N C O
C O
C C
CH C
OH C
O C C
N C
C O
O C O
N C O
S C C
SH C
S O
[59] we were unable to trace similar approaches to validate the quantitative evaluation of such individual chemical states. Here we compare the concentration (atomic %) values of our fitted data of the C3–C5 components with those of O1–O3 and of N1–N3 components depicted in Fig. 4. The dark bars represent the carbon atoms in the assigned chemical state. The amounts of the interconnected heteroatoms are given in the sides of the carbon bars. Their sum has to be equal to the carbon component within the expected accuracy of detecting and evaluating the peak area intensities, taking into account the formula of the given chemical fragment. According to the molecular fragments in Table 2 the C3 atom is bound only to O3 atom. C4 is partly linked to O1 and also to N1. C5 is bound to O2, N2 and N3. Here we considered that N3 was bound to two carbon neighbours. The signal from the C1 aromatic/graphitic carbon network is asymmetric, however, its shape is dependent on the perfection of the structure what is not defined yet for the carbon dot of such very small size. This is the reason why we were unable to take it into account in our synthesis procedure. However, we are conscious that this will affect the intensity of the C2 peak and increases also the intensity of the C3 peak bound to O3 type oxygen. The presence of the well-known π–π* satellite transition of the graphitic network what we cannot count here for technical reasons may also affect the shape of the background under the C1s envelope, thus may affect the relative intensity of all components. Due to all these uncertainties of the data evaluation, very exact matching could not be expected. Majority of the data in the Fig. 4 is still found to be in reasonable agreement confirming by this both the assignments of the peaks and also the reasonable accuracy of the performed peak fitting.
Figure 4. Allocation of the various chemical states of oxygen and nitrogen to the amount of corresponding carbon states cited in XPS Table 1 for the CQD samples
(Middle bars represent the amount of C1-C5 states, error bars represent ±5% relative error).
According to the XPS results the following observations could be made for the different CQD samples. Sample CQD2 has the lowest carbon and the highest oxygen content. It is also dominated by carboxylic and amide type oxygen in agreement with the respective carbon type.
0 5 10 15 20 25 30 35 40
Composition(atomic %)
O2 N2 N3
O3 O1
N1
0 5 10 15 20 25 30 35 40
Composition(atomic %)
O2 N2 N3
O3 O1
N1
0 5 10 15 20 25 30 35 40
C1 C2 C3 C4 C5
Composition(atomic %)
O2 N2 N3
O3 O1
N1
The presence of the carboxylic group can be associated with the negative zeta potential of these particles. A significant amount of graphitic carbon is also present in this sample indicating the presence of a separate graphitic core in the particle. In sample CQD3 an increase in the carbon and nitrogen content was observed. The oxygen ratio, on the other hand, decreased. The carboxylic/amide content was also reduced, while the amorphous carbon content (C2) was significantly increased. These changes are reflected in the zeta potential of the particles as well.
The decrease in the carboxylic content between CQD2 and CQD3 can be attributed to the elevated reaction temperature that favors the ring closure procedure via the carboxylic groups.
The N1 type nitrogen also has a maximum in this sample. This fragment can be assigned as a pyridine type nitrogen connected to the particle core [59]. The sample also has a significant sulfur content in the form of thiols, sulfides and sulfoxides, originating from the DMSO solvent, indicating that the solvent participates in the reactions and its sulfur content becomes incorporated into the particles. Sample CQD4 has the highest carbon ratio. This increase can be attributed to the high C1 type aromatic carbon content, indicating the presence of an enlarged graphitic core. The polar group content is concurrently decreased.
XRD results are presented in the units of scattering angle (2Θ), the reduced diffraction vector (q) and the interplanar distances (d):
( )
Samples produced board peaks indicating an amorphous phase (Fig. 5).
Figure 5. XRD patterns of CQD samples
Different positions of reflections indicate different amorphous phases. CQD2 and CQD4 had their peak maximum at 2Θ of (27.1° ± 0.1°) and (26.4° ± 0.1°) corresponding to interplanar distances of (0.329 ± 0.001) and (0.337 ± 0.002) nm. These values are commonly quoted to the interlayer separation between graphitic layers [61] indicating the presence of the graphitic core of the carbon nanodots. On the other hand, for CQD3 the peak maximum can be located at 2Θ of (21.0° ± 0.1°), (0.423 ± 0.002) nm interplanar distance, accompanied by further broadening. The increment of the interplanar distance can happen due to increased nitrogen doping as was found in the case of nitrogen-doped graphene [63]. This is strengthened by the findings of XPS as CQD3 contains double amount of aromatic nitrogen (N1, Table 2) compared to CQD2 and CQD4. The increased interplanar distance can also be attributed to an increased amorphous character of the particles [64] that is confirmed by the more broadened peak shape and also the higher hydrocarbon content determined by XPS (C2, Table 2). The samples have common sharp reflections at 2Θ of 38.2°and 44.4°. The Scherrer equation was used to calculate the crystallite sizes based on these two peaks. For CQD2, CQD3 and CQD4 the 38.2° peak gives 23.8, 24.0 and 24.7 crystallite sizes respectively while the 44.4° peak leads to 25.8, 25.3 and 26.2 nm, respectively. According to DLS and AFM the highly diluted forms of the samples contained no particles in this size range. This means that these peaks might be the result of reflection from secondary particles formed during the drying of highly concentrated sols.
3.4 Fluorescence properties
Samples dispersed in the media they were synthesized in (water and DMSO) under normal illumination gave the appearance of a dark brown solution in the case of CQD2, CQD3 and CQD4, while for CQD1 a dark olive-green color was observed. Under UV light samples showed distinct greenish-blue luminescence except CQD1, where no particles were detected, emitted a deeper blue color (Fig. 6).
Figure 6. Photograph of CQD sample dispersions under UV illumination
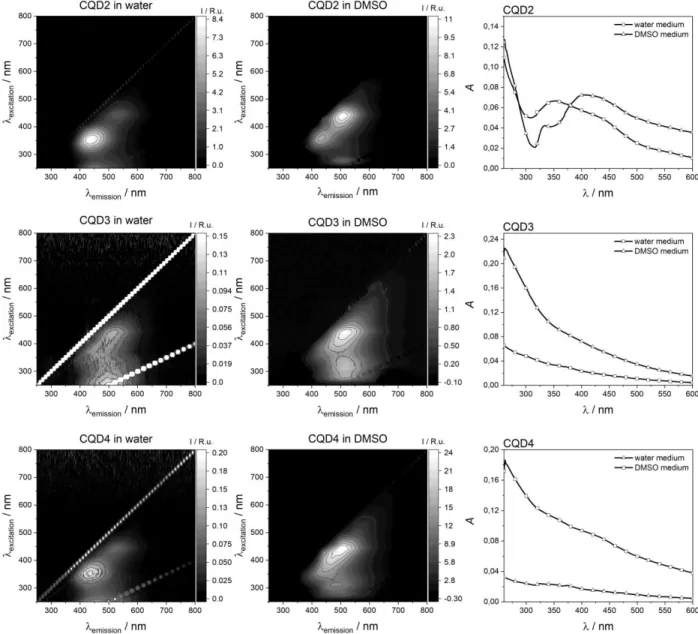
Figure 7. 3D fluorescence and UV-Vis absorbance spectra of CQD samples in water and DMSO
Samples exhibit broad absorption in the UV-Vis range (Fig. 7). CQD3 and CQD4 show no distinctive peaks either in water or in DMSO. On the other hand, CQD2 shows two pseudo peaks in the 330–350 nm and the 400–430 nm range. Fluorescence properties of the particles were investigated using fluorescence spectrophotometry. The emitted light intensity as a function of emission and excitation wavelength is presented in 3D spectrum in Fig. 7. Spectra were recorded for all particle samples in water and DMSO. CQD2 (prepared in water) had two main luminescence regions centered around 350 nm excitation with 450 nm emission (Peak 1) and 440
nm excitation with 500 nm emission (Peak 2). The presence of a further weak peak could be detected at smaller wavelength, below 250 nm excitation and around 450 nm emission (Peak 3).
Dispersing medium had marked effect on the peak ratios. In DMSO Peak 2 became more prominent. The position of these two peaks did not change considerably. On the other hand, Peak 3 showed a remarkable red shift and appears at 280 nm excitation and 500 nm emission wavelengths in DMSO.
Samples prepared in DMSO (CQD3 and CQD4) exhibited markedly different fluorescence character. These samples also had their main peaks in the Peak 1 and Peak 2 regions, however in DMSO the region is broadened, and no individual peaks were observed. Peak 3 became even more red-shifted to 300–310 nm excitation and 490–510 nm emission. In water the overall intensities were greatly reduced, probably due to aggregation. In the case of CQD4 the shape of the spectrum became almost similar to CQD2 in water, while CQD3 retained its native spectrum shape. The fluorescence peaks can be attributed to the various luminescence centers in the particles. The Peak 3 region of fluorescence can be assigned as transitions of sp2- hybridized carbon originating from the conjugated electron structure of the particle core, while the Peak 1 region can be assigned as transitions at the carbon lattice edge [65]. The lower energy Peak 2 fluorescence is commonly associated with transitions of surface functional groups of the particles [66]. It is important to note that CQD3 has the most prominent fluorescence in the Peak 3 region, responsible for the core luminescence. This correlates with the high aromatic nitrogen content (N1) of this sample shown by XPS results.
Quantum yield of the samples in their native solvent medium (in the case of CQD2 also in DMSO) was also determined using quinine sulfate in 0.5 M H2SO4 aqueous solution as a standard. The average measured values and their confidence intervals (triplicate measurements, 95% confidence) are collected in Table 3.
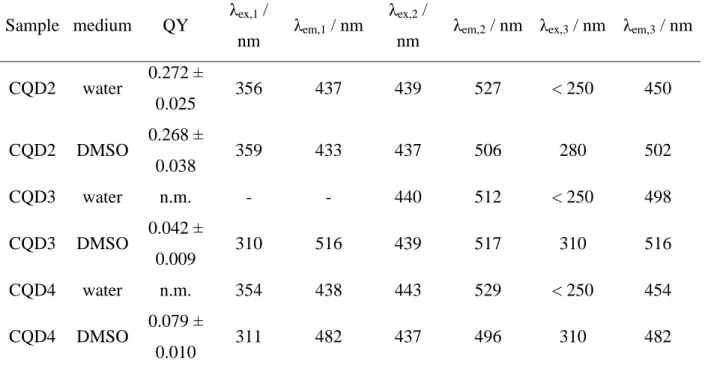
Table 3. Fluorescence quantum yields, excitation and emission maximum wavelengths of CQDs dispersed in water and DMSO
Sample medium QY λex,1 /
nm λem,1 / nm λex,2 /
nm λem,2 / nm λex,3 / nm λem,3 / nm CQD2 water 0.272 ±
0.025 356 437 439 527 < 250 450
CQD2 DMSO 0.268 ±
0.038 359 433 437 506 280 502
CQD3 water n.m. - - 440 512 < 250 498
CQD3 DMSO 0.042 ±
0.009 310 516 439 517 310 516
CQD4 water n.m. 354 438 443 529 < 250 454
CQD4 DMSO 0.079 ±
0.010 311 482 437 496 310 482
*Note: Excitation and emission wavelength values are accurate within ±1 nm
In cellular assays, factors such as pH could have a dramatic effect on the fluorescence intensity of fluorescent dyes and molecular probes. Therefore, it is necessary to measure the effect of pH on the fluorescence properties of the nanodots. The water dispersible CQD2 was used in these experiments, where 3D spectra of the particles at constant concentration were recorded between pH 3 and 12. It was found that the peak maximum positions shifted slightly with, excitation peaks red-shifting from 345, and 439 nm at pH 3 to 362 and 448 nm at pH 12, respectively. The relative quantum yields of the particles also increased by 23% between pH 3 and 12. About 20%
of the change occurred between pH 3 and 7. This indicates that the quantum yield seems to correlate with carboxylic type carbon moieties. Comparably the quantum yield of fluorescein, a commonly used fluorescent dye in biological applications, changes from 0.2 to 0.8, around 400%
increase over a pH range of 6 to 8 [67]. Therefore, it can be concluded that the CQD particles are ideal for bioimaging applications where pH independency is a desired property.
3.5 Quantum dot internalization by human MonoMac6 monocytes
Flow cytometry is a sensitive tool to determine cell viability and cellular uptake profile following treatment with fluorescent compounds, nanoparticles [68] or quantum dots. The main advantage of the technique allows the analysis on a per-cell basis. It has been recognized that variations in intracellular fluorescence intensity reflect differences on uptake rate. The intracellular fluorescence intensity of a certain cell population stained for a specific quantum dot is related to the internalized particles compared with untreated negative control cells. Gating the live cell population with increased intracellular fluorescence intensity, the percentage of the quantum dots containing cells can be determined.
MonoMac6 human monocytes [52] were treated with CQD2 and CQD3 nanodots at 0.3 and 0.15 mg/ml concentration. Following exposure and removal of quantum dots by washing the cells (to remove cell surface bound nanodots, cells were also trypsinized), they were transferred to tubes.
When preparing the samples for assay, cells have been carefully harvested to avoid the loss or damage of a certain subpopulations. Spontaneous cell death due to sample preparation was determined for untreated control cells (not more than 10-15% of death). A threshold for dead and live cells was set on forward scatter and side scatter (FSC, SSC) to exclude cell debris or any artefacts; the gating strategy was confirmed by propidium-iodide staining (PI gating data not shown). The gates were obtained with FACSDiva software and used for the data acquisition and analysis.
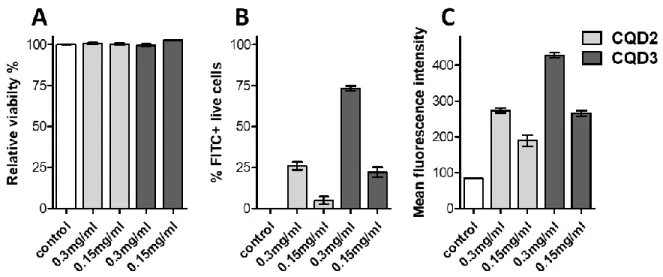
Viability of nanodot exposed cells was the same as viability of the untreated control cells, which result clearly demonstrates that none of the nanodots were cytotoxic at the applied concentration range (Fig. 8A). According to the mean fluorescence value, relevant concentration-dependent internalization was observed for both CDQ2 and CDQ3 nanodots (Fig. 8C). To compare internalization rates the mean fluorescence values and percentage of FITC positive cell population were used (Fig. 8B). The mean fluorescence intensity of CQD3 treated cells was significantly higher than CQD2 treated cells (p<0.0001, unpaired t-test). At 0.3 mg/ml concentration, more than 70% of the cells were FITC positive. Moreover, even at the lower concentration, intracellular fluorescent intensity of CQD3 treated cells was almost 3-times higher than the mean fluorescence intensity of the untreated control cells. Both values, the mean fluorescence intensity and the percentage of fluorescence positive cells (based on the applied channel, the FITC-positive cells) indicate significantly different uptake rate for CQD2 and
CQD3. It has been shown that hydrophobicity can increase internalization rates of both drugs [69] and nanoparticles [70]. CQD3 was shown to have a more apolar character than CQD2 that could contribute to its higher uptake. Surface charge is another property that determines the interaction between cells and nanoparticles. A cationic surface character has been described to increase the internalization rate of particles [71]. CQD3 has the highest nitrogen content of the samples. In aqueous environment the nitrogen functionalities can become protonated and gain a positive charge that can lead to the increased internalization.
Figure 8. Internalization of carbon nanodots into human MonoMac6 monocytes. Cells were treated with CQD2 and CQD3 nanodots at 0.15 and 0.3 mg/ml concentration for 1.5 h. Cell viability of untreated control was 86.8% ± 0.2%. Relative viability of the CQD2 and CQD3 treated cells was more than 95% in each case. Cellular uptake of monocytes increases in a concentration dependent manner. CQD3 nanodots showed a significantly higher internalization
rate than CQD2 in accordance with the shift in mean fluorescence values and FITC positive percentage.
Figure 9. Internalization of nanodot CQD3 using flow cytometry and fluorescence microscopy.
Column (1) shows the histograms displaying mean intracellular fluorescence intensity of untreated and CQD3 treated cell population (0.3 mg/mL; 1.5 h; FITC LP505; BP 530/30).
Column (2) displays bright field images of untreated control cells and CQD3 treated cells (0.3 mg/mL; 1.5 h). Column (3) displays untreated and CQD3 treated cells (0.3 mg/mL; 1.5 h)
imaged with WideBlue Filter.
In Fig. 9 Column (1) the histograms of mean fluorescence intensity of untreated and CQD3 treated cell population are presented. It was found that distributions are symmetrical and unimodal for untreated control and CQD3 exposed cell populations; the shift in mean fluorescence intensity demonstrates the significant uptake of CQD3 nanodots. Parallel with flow cytometry measurements – from the identical cell sample – to visualize cell morphology and the intracellular fluorescence microscopic images were also captured by a fluorescent microscope (Fig. 9, Column 2 and 3). Washed, trypsinized (to prevent surface bound quantum dots from interfering with the measurements) and re-suspended cells were imaged in a 96-well flat bottom tissue culture plate. It was found that even with a mercury-vapor light source the CQD
containing cells were imaged with acceptable resolution and signal intensity despite the relatively large unfocused background part and long exposure time.
4. Conclusions
Carbon quantum dots (CQDs) with a variety of covalently bound functional groups were synthesized from common precursors, citric acid and urea. Four different synthesis methods have been explored. When low energy thermal excitation was used, i.e. refluxing in water at 100 °C, no particles were formed. We discovered, however, that particles could be readily formed by such simple atmospheric refluxing for 16 hours at 180 °C when using dimethyl sulfoxide (DMSO) solvent. Applying the energetic microwave assisted heating we also found that particles were formed already in 5 minutes. All the synthesized carbon dots exhibited luminescence.
With eventual biomarker applications in mind the created nanoparticle systems have been characterized based on their size, luminescence, chemical composition, cellular uptake and toxicity.
The composition and chemical structure of the CQDs were determined by a detailed X-ray photoelectron spectroscopic (XPS) analysis. A direct interrelation was found between the fluorescence properties and the surface chemical groups of the particles. It has been established that the luminescence quantum yield (QY) is mainly dependent on the shell part of the dots, more specifically on the overall oxygen content, and the amount of carboxylic type groups play the most important role in the determination of the fluorescence intensity.
Chemical composition also has marked effect on the surface polarity of the CQDs. The samples exhibited a decreasing hydrophilicity in the series CQD2, CQD3 and CQD4. This is reflected in their aromatic, sp2-type carbon content that respectively increases. Parallel to that, the carboxylic, amide type carbon content is decreasing in the series that was independently confirmed by zeta potential measurements. These two effects can lead to the decrease in the polar nature of the particle making them increasingly more hydrophobic. Surface polarity determines the aqueous dispersibility of the particles and as such has crucial role in their biological applications.
The CQDs were studied as potential cellular markers, employing in vitro cellular internalization experiments. The water dispersible nanoparticles proved to be non-cytotoxic in the studied concentration range and showed concentration dependent cellular uptake and intracellular
fluorescence, making them promising markers both in flow cytometric measurements and fluorescence microscopy. In these experiments it also became evident that in addition to the quantum yield of the particles the surface polarity is of paramount importance. Sample CQD2 is highly water dispersible and exhibits the largest QY. Sample CQD3 has a far smaller QY and is barely water dispersible but proved to be more suited for cellular staining due to the increased hydrophobicity promoting enhanced cellular uptake. Sample CQD4, on the other hand, was too hydrophobic for cellular internalization resulting in the aggregation of particles and precipitation in aqueous medium.
Considering that carbon nanodots have a promising potential for bio-imaging and with further surface modifications these particles could serve as nanoparticulate carriers for drug delivery.
Future studies will focus on elucidating the effect of surface modifications on the mechanism of cellular uptake, the in vivo bio distribution and long-term toxicological risk.
Acknowledgements
This work was completed in the ELTE Institutional Excellence Program (1783- 3/2018/FEKUTSTRAT) supported by the Hungarian Ministry of Human Capacities. These studies were supported by grant (VEKOP-2.3.3-15-2017-00020) from the European Union and the State of Hungary, co-financed by the European Regional Development Fund. K. Horváti was supported by the János Bolyai Research Scholarship of the Hungarian Academy of Sciences and by the Hungarian Scientific Research Fund (OTKA, grant number: 115431 and 124077). The authors thank D. Szabó and J. Kóth for their contributions to the quantum dot synthesis optimization.
References
1 Jensen EC. Use of Fluorescent Probes: Their Effect on Cell Biology and Limitations. The Anatomical Record. 2012;295:2031–2036. DOI: 10.1002/ar.22602
2 Xu X, Ray R, Gu Y, Ploehn HJ, Gearheart L, Raker K, et al. Electrophoretic Analysis and Purification of Fluorescent Single-Walled Carbon Nanotube Fragments. J. Am. Chem. Soc. 2004;126(40):12736–
12737. DOI: 10.1021/ja040082h
3 Park Y, Yoo J, Lim B, Kwon W, Rhee SW. Improving the functionality of carbon nanodots: doping and surface functionalization. Journal of Materials Chemistry A. 2016;4:11582–11603. DOI:
10.1039/C6TA04813G
4 Pandey N, Srivastava RK, Singh MK, Singh J. Optical properties of carbon nanodots synthesized by
laser induced fragmentation of graphite powder suspended in water. Mat. Sci. Semicon. Proc.
2014;27:150–153. DOI: 10.1016/j.mssp.2014.06.039
5 Dong Y, Pang H, Ren S, Chen C, Chi Y, Yu T. Etching single-wall carbon nanotubes into green and yellow single-layer graphene quantum dots. Carbon. 2013;64:245–251. DOI:
10.1016/j.carbon.2013.07.059
6 Papaioannou N, Marinovic A, Yoshizawa N, Goode AE, Fay M, Khlobystov A, et al. Structure and solvents effects on the optical properties of sugar-derived carbon nanodots. Scientific Reports.
2018;8:6559. DOI:10.1038/s41598-018-25012-8
7 Dong Y, Shao J, Chen C, Li H, Wang R, Chi Y, et al. Blue luminescent graphene quantum dots and graphene oxide prepared by tuning the carbonization degree of citric acid. Carbon. 2012;50(12):4738–
4743. DOI: 10.1016/j.carbon.2012.06.002
8 Qian Z, Ma J, Shan X, Feng H, Shao L, Chen J. Highly Luminescent N-Doped Carbon Quantum Dots as an Effective Multifunctional Fluorescence Sensing Platform. Chem. Eur. J. 2014;20:2254–2263.
DOI: 10.1002/chem.201304374
9 Jiang J, He Y, Lia S, Cui H. Amino acids as the source for producing carbon nanodots: microwave assisted one-step synthesis, intrinsic photoluminescence property and intense chemiluminescence enhancement. Chem. Commun. 2012;48:9634–9636. DOI: 10.1039/C2CC34612E
10 Wu Q, Li W, Wu P, Li J, Liu S, C. J, et al. Effect of reaction temperature on properties of carbon nanodots and their visible-light photocatalytic degradation of tetracyline. RSC Adv. 2015;5:75711–
75721. DOI: 10.1039/C5RA16080D
11 Wang L, Zhou HS. Green Synthesis of Luminescent Nitrogen-Doped Carbon Dots from Milk and Its Imaging Application. Anal. Chem. 2014;86(18):8902–8905. DOI: 10.1021/ac502646x
12 Wu M, Wang Y, Wu W, Hu C, Wang X, Zheng J, et al. Preparation of functionalized water-soluble photoluminescent carbon quantum dots from petroleum coke. Carbon. 2014;78:480–489. DOI:
10.1016/j.carbon.2014.07.029
13 Zhao Y, Zhang Y, Liu X, Kong H, Wang Y, Qin G, et al. Novel carbon quantum dots from egg yolk oil and their haemostatic effects. Scientific Reports. 2017;7:4452. DOI: 10.1038/s41598-017-04073-1 14 Wang Y, Hu A. Carbon quantum dots: synthesis, properties and applications. J. Mater. Chem. C.
2014;2(34):6921–6939. DOI: 10.1039/C4TC00988F
15 Lim SY, Shen W, Gao Z. Carbon quantum dots and their applications. Chem. Soc. Rev. 2015;44:362–
381. DOI: 10.1039/C4CS00269E
16 Glinka YD, Lin KW, Chang HC, Lin SH. Multiphoton-Excited Luminescence from Diamond Nanoparticles. Journal of Physical Chemistry B. 1999;103(21):4251–4263. DOI: 10.1021/jp9835364 17 Sun YP, Zhou B, Lin Y, Wang W, Fernando KAS, Pathak P, et al. Quantum-Sized Carbon Dots for
Bright and Colorful Photoluminescence. Journal of the American Chemical Society.
2006;128(24):7756–7757. DOI: 10.1021/ja062677d
18 Wang L, Chen X, Lu Y, Liu C, Yang W. Carbon quantum dots displaying dual-wavelength photoluminescence and electrochemiluminescence prepared by high-energy ball milling. Carbon.
2015;94:472–478. DOI: 10.1016/j.carbon.2015.06.084
19 Pillar-Little TJ, Wanninayake N, Nease L, Heidary DK, Glazer EC, Kim DY. Superior photodynamic effect of carbon quantum dots through both type I and type II pathways: Detailed comparison study of
top-down-synthesized and bottom-up-synthesized carbon quantum dots. Carbon. 2018;140:616–623.
DOI: 10.1016/j.carbon.2018.09.004
20 Zhu H, Wang X, Li Y, Wang Z, Yang F, Yang X. Microwave synthesis of fluorescent carbon nanoparticles with electrochemiluminescence properties. Chemical Communications. 2009;34:5118–
5120. DOI: 10.1039/B907612C
21 Zhu S, Meng Q, Wang L, Zhang J, Song Y, Jin H, et al. Highly Photoluminescent Carbon Dots for Multicolor Patterning, Sensors, and Bioimaging. Angwandte Chemie International Edition.
2013;52:3953–3957. DOI: 10.1002/ange.201300519
22 Wang J, Peng F, Lu Y, Zhong Y, Wang S, Xu M, et al. Large‐ Scale Green Synthesis of Fluorescent Carbon Nanodots and Their Use in Optics Applications. Advanced Optical Materials. 2015;3:103–111.
DOI: 10.1002/adom.201400307
23 Shamsipur M, Barati A, Karami S. Long-wavelength, multicolor, and white-light emitting carbon- based dots: Achievements made, challenges remaining, and applications. Carbon. 2017;124:429–472.
DOI: 10.1016/j.carbon.2017.08.072
24 Zhai X, Zhang P, Liu C, Bai T, Li W, Dai L, et al. Highly luminescent carbon nanodots by microwave- assisted pyrolysis. Chemical Communications. 2012;48(64):7955–7957. DOI: 10.1039/C2CC33869F 25 Meiling TT, Cywiński PJ, Bald I. White carbon: Fluorescent carbon nanoparticles with tunable
quantum yield in a reproducible green synthesis. Scientific Reports. 2016;6:28557. DOI:
10.1038/srep28557
26 Atchudan R, Edison TNJI, Lee YR. Nitrogen-doped carbon dots originating from unripe peach for fluorescent bioimaging and electrocatalytic oxygen reduction reaction. J Colloid Interface Sci.
2016;482:8–18. DOI: 10.1016/j.jcis.2016.07.058
27 Ortega-Liebana MC, Chung NX, Limpens R, Gomez L, Hueso JL, Santamaria J, et al. Uniform luminescent carbon nanodots prepared by rapid pyrolysis of organic precursors confined within nanoporous templating structures. Carbon. 2017;117:437–446. DOI: 10.1016/j.carbon.2017.03.017 28 Zhu S, Song Y, Zhao X, J. S, J. Z, Yang B. The photoluminescence mechanism in carbon dots
(graphene quantum dots, carbon nanodots, and polymer dots): current state and future perspective.
Nano Res. 2015;8(2):355–381. DOI: 10.1007/s12274-014-0644-3
29 Arcudi F, Đorđević L, Prato M. Synthesis, Separation, and Characterization of Small and Highly Fluorescent Nitrogen‐ Doped Carbon NanoDots. Angew. Chem. Int. Ed. 2016;55:2107–2112. DOI:
10.1002/anie.201510158
30 Kwon W, Lee G, Do S, Joo T, Rhee S. Size‐ Controlled Soft‐ Template Synthesis of Carbon Nanodots toward Versatile Photoactive Materials. Small. 2014;10(3):506–513. DOI:
10.1002/smll.201301770
31 Zhou Y, Liu Y, Li Y, He Z, Xu Q, Chen Y, et al. Multicolor carbon nanodots from food waste and their heavy metal ion detection application. RSC Adv. 2018;8:23657–23662. DOI:
10.1039/C8RA03272F
32 Travlou NA, Giannakoudakis DA, Algarra M, Labella AM, Rodríguez-Castellón E, Bandosz TJ. S- and N-doped carbon quantum dots: Surface chemistry dependent antibacterial activity. Carbon.
2018;135:104–111. DOI: 10.1016/j.carbon.2018.04.018
33 Campos BB, Contreras-Cáceres R, Bandosz TJ, Jiménez-Jiménez J, Rodríguez-Castellón E, Esteves da
Silva JCG, et al. Carbon dots as fluorescent sensor for detection of explosive nitrocompounds. Carbon.
2016;106:171–178. DOI: 10.1016/j.carbon.2016.05.030
34 Huang H, Weng Y, Zheng L, Yao B, Weng W, Lin X. Nitrogen-doped carbon quantum dots as fluorescent probe for “off-on” detection of mercury ions, l-cysteine and iodide ions. J Colloid Interface Sci. 2017;506:373–378. DOI: 10.1016/j.jcis.2017.07.076
35 Qi H, Teng M, Liu M, Liu S, Li J, Yu H, et al. Biomass-derived nitrogen-doped carbon quantum dots:
highly selective fluorescent probe for detecting Fe3+ ions and tetracyclines. J. Colloid Interface Sci.
2019;332–341:539. DOI: 10.1016/j.jcis.2018.12.047
36 Resch-Genger U, Grabolle M, Cavaliere-Jaricot S, Nitschke R, Nann T. Quantum dots versus organic dyes as fluorescent labels. Nat Methods. 2008;5(9):763–775. DOI: 10.1038/nmeth.1248
37 Molaei MJ. A review on nanostructured carbon quantum dots and their applications in biotechnology, sensors, and chemiluminescence. Talanta. 2019;196:456–478. DOI: 10.1016/j.talanta.2018.12.042 38 Zheng XT, Ananthanarayanan A, Luo KQ, Chen P. Glowing graphene quantum dots and carbon dots:
Properties, syntheses, and biological applications. Small. 2015;11:1620–1636. DOI:
10.1002/smll.201402648
39 Liu C, Zhang P, Zhai X, Tian F, Li W, Yang J, et al. Nano-carrier for gene delivery and bioimaging based on carbon dots with PEI-passivation enhanced fluorescence. Biomaterials. 2012;33(13):3604–
3613. DOI: 10.1016/j.biomaterials.2012.01.052
40 Choi Y, Kim S, Choi M, Ryoo S, Park J, Min D, et al. Highly Biocompatible Carbon Nanodots for Simultaneous Bioimaging and Targeted Photodynamic Therapy In Vitro and In Vivo. Adv. Funct.
Mater. 2014;24:5781–5789. DOI: 10.1002/adfm.201400961
41 Lee HU, Park SY, Park ES, Son B, Lee SC, Lee JW, et al. Photoluminescent carbon nanotags from harmful cyanobacteria for drug delivery and imaging in cancer cells. Sci. Rep. 2014;4:4665. DOI:
10.1038/srep04665
42 Mewada A, Pandey S, Thakur M, Jadhav D, Sharon M. Swarming carbon dots for folic acid mediated delivery of doxorubicin and biological imaging. J. Mater. Chem. B. 2014;2(6):698–705. DOI:
10.1039/C3TB21436B
43 Huang X, Zhang F, Zhu L, Choi KY, Guo N, Guo J, et al. Effect of Injection Routes on the Biodistribution, Clearance, and Tumor Uptake of Carbon Dots. ACS Nano. 2013;7:5684–5693. DOI:
10.1021/nn401911k
44 Pierrat P, Wang R, Kereselidze D, Lux M, Didier P, Kichler A, et al. Efficient in vitro and in vivo pulmonary delivery of nucleic acid by carbon dot-based nanocarriers. Biomaterials. 2015;51:290–302.
DOI: 10.1016/j.biomaterials.2015.02.017
45 Mintz KJ, Zhou Y, Leblanc RM. Recent development of carbon quantum dots regarding their optical properties, photoluminescence mechanism, and core structure. Nanoscale. 2019;11:4634–4652. DOI:
10.1039/C8NR10059D
46 Jung YK, Shin E, Kim BS. Cell Nucleus-Targeting Zwitterionic Carbon Dots. Sci. Rep. 2015;5:18807.
DOI: 10.1038/srep18807
47 Du J, Xu N, Fan J, Sun W, Peng X. Carbon Dots for In Vivo Bioimaging and Theranostics. Small.
2019 1805087. DOI: 10.1002/smll.201805087
48 Gyulai G, Pénzes CB, Mohai M, Csempesz F, Kiss É. Influence of surface properties of polymeric