ACTIVE AGEING INDEX, NEW EMPHASIS WITHIN THE SAME METHODOLOGY. THE ROLE OF THE INTERNET
Éva Berde*
Corvinus University of Budapest, Budapest, Hungary E-mail: eva.berde@uni-corvinus.hu
Izabella Kuncz
Corvinus University of Budapest, Budapest, Hungary E-mail: izabella.kuncz@uni-corvinus.hu
(Received: August 2019; Accepted: October 2019; Published: November 2019) Abstract: Our paper focuses on the role of the Internet in older people’s lives and suggests that the weighting given to Internet usage should be increased when calculating the Active Ageing Index (AAI). We analyse the results of two weighting systems, which differ from the original one created by an expert group. First, we use the coefficients calculated by Djurovic et al. (2017), then create our own system in which the Internet usage component is given a very high coefficient value, ceteris paribus. Evaluations are done for AAI 2010, 2012, 2014, 2016 and 2018. The rank order of countries differs in the alternative weighting systems, but these differences are slight, and decrease year by year, suggesting the robustness of the original weighting system. This also shows that older EU citizens are using the Internet more and more, and that Internet usage is becoming a category similar to basic literacy. Finally, we recommend that AAI include a more sophisticated indicator of Internet usage instead of just asking respondents if they have used the Internet at least once a week in the previous three months.
Keywords: Active Ageing Index, Internet usage, weighting system, rank robustness JEL Codes: I30, J14, L86
1. Introduction
The ageing of the population has become an unavoidable issue, especially in developed countries. In the European Union, 59.8% of the population was of working age (20-64 years old) in 2017, a rate which is expected to drop below 55%
* Corresponding author: Éva Berde. E-mail: eva.berde@uni-corvinus.hu Copyright © 2019 The Author(s). Published by VGWU Press
This is an Open Access article distributed under the terms of the Creative Commons Attribution License - Non Commercial - NoDerivs License (http://creativecommons.org/licenses/by-nc-nd/3.0/) which permits unrestricted use, distribution, and reproduction in any medium, provided the original author and source are credited.
Active ageing index, new emphasis within the same methodology. The role of the Internet
by 2035, and stay there until as late as 2080. In 2017, the ratio of those over 65 was 19.4%, a value expected to rise to 29.1% by 2080 (Eurostat, 2018).
The ageing of the population has pushed issues like the welfare and the quality of life of the elderly to the foreground, with surveys focusing on their financial state and satisfaction levels (Hellström, Persson, & Hallberg, 2004; Bandura, 2008;
Hawton et al., 2011; Yang, 2014). There have been numerous complex indices to measure the welfare levels of the older generation. The one, which has seen the most widespread used in Europe, is the Active Ageing Index (AAI). It has been published every other year since 2010 to evaluate the results of surveys made two years previously (e.g. AAI 2010 is about the year 2008). Presently, the indices published in 2010, 2012, 2014, 2016 and 2018* – the latest using some estimates of basic data – report on the five analyses within the period 2008 to 2016.
Based on estimates, AAI is calculated as a weighted sum of various components†. AAI tendencies may be used to describe the development of countries over time, and to analyse rankings of countries. Index values show the immanent potential in ageing. For economists responsible for drawing up government policies, AAI is a guideline for assessing the efficacy of strategies relevant to ageing. Although the index has faced much criticism, practical experience suggests that it serves its original purpose quite well inasmuch as it reflects the effectiveness of efforts in active ageing policies. Furthermore, it draws attention to segments needing further measures. However, economic development obviously results in the emergence of new tendencies that affect the lifestyles of the elderly (Carstensen, 1995). Our paper focuses on one of these factors, namely the role of the Internet in later life, and, consequently, suggests that the weight of this factor should be increased when calculating AAI.
The Internet has a twofold importance in the lives of older people. Firstly, a good number of services have become available online, including sources of supplementary income. Those who refuse to use the Internet on a daily basis will soon find themselves less able to make financial transactions, find books to read, make appointments with doctors, etc. Moreover, the Internet can also be great help in finding friends online, helping to build real communities. However, the so-called digital divide positions more-and-more people on the disadvantageous side of this divide, which further escalates their lag (Srinuan & Bohlin, 2011; Krueger, Stone
& Lukaszewski, 2018).
*Cf. https://statswiki.unece.org/pages/viewpage.action?pageId=76287845, downloaded on 24 March 2019.
† This is the so called “expert method”. AAI also can be calculated upon different mathematical statistical methods. See summarizing these methods in Berde & Kuncz (2019).
Active ageing index, new emphasis within the same methodology. The role of the Internet
The importance of the Internet has been recognised at an EU level, too. The European Commission has already formulated an action plan entitled “Ageing well in the Information Society” (EU, 2007) which aims to develop information and communication technologies related to services provided to the elderly, and coordinates them within the Union. According to the plan, the Internet should enable old people to work for a longer time while maintaining a desirable work-life balance. In addition, the action plan promotes social activity by means of online communication, in order to enhance the quality of later life. Neagu & Dima (2017) also point out, that the facilitation of information flow between individuals contributes greatly to the global economic integration of countries. This paper discusses two ways the weighting values given to Internet usage could be increased in AAI. In the first case, the weight suggested by Djurovic et al. (2017) was applied. They underpinned the relevance of a greater weight with calculations based on statistical estimates. Then, we weighted the Internet component beyond the level suggested by Djurovic et al. (2017) by moving this indicator into a separate, fifth domain to amend the original index. This new, more marked weight function slightly rearranges the ranking of countries too. In addition to our suggestion to increase the weight coefficient of Internet usage in AAI, we also propose to use a more sophisticated indicator of Internet usage than the present one.
The paper comprises five sections, including this introduction. The second section will give an overview of the components and structure of AAI. The third will present the two further weighting systems that seek to emphasise the marked importance of Internet usage. In Section Four, a new ranking of countries – generated by the new weighting systems – will be analysed. Here we suggest new categories which could be applied when measuring Internet usage for the AAI. In the final section we highlight the fact that no matter how important it may seem to increase the weighting of Internet usage in AAI, the indicator calculated with the original weight functions seems to be rank robust
.
2. Literature review
2.1. The Active Ageing Index
The Active Ageing Index (AAI) is a complex index containing 22 indicators across four domains, the creation of which was initiated by the United Nations European Commission of Economics (UNECE) and the European Commission’s Directorate General for Employment, Social Affairs and Inclusion (Zaidi et al., 2013). The main target of AAI is to measure the effectiveness of economic policies that respond to ageing. AAI also shows the efficacy by which the economic and social
Active ageing index, new emphasis within the same methodology. The role of the Internet
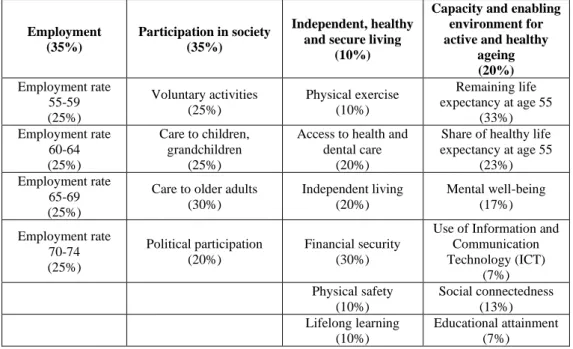
potential of ageing is exploited. The four major domains of AAI and the indicators within each domain are shown in Table 1.
Table 1 The four domains of AAI, the indicators of each domain, and the weighting of each indicator within its respective domain.
Employment (35%)
Participation in society (35%)
Independent, healthy and secure living
(10%)
Capacity and enabling environment for active and healthy
ageing (20%) Employment rate
55-59 (25%)
Voluntary activities (25%)
Physical exercise (10%)
Remaining life expectancy at age 55
(33%) Employment rate
60-64 (25%)
Care to children, grandchildren
(25%)
Access to health and dental care
(20%)
Share of healthy life expectancy at age 55
(23%) Employment rate
65-69 (25%)
Care to older adults (30%)
Independent living (20%)
Mental well-being (17%) Employment rate
70-74 (25%)
Political participation (20%)
Financial security (30%)
Use of Information and Communication Technology (ICT)
(7%) Physical safety
(10%)
Social connectedness (13%) Lifelong learning
(10%)
Educational attainment (7%) Source: Zaidi et al. (2013). Note: Financial security includes three indicators:
“Relative median income of 65+ relative to those aged below 65”, “No poverty risk for older persons” and “No severe material deprivation rate”.
The first three domains of AAI relate to the results achieved in active ageing, including physical, social and financial security, and participation in paid and unpaid activities. This trio found its way to the Active Ageing Index upon the recommendation of the World Health Organisation (WHO, 2002). Finally, the fourth domain considers the extent to which the environment supports active ageing, and the efforts the elderly make to improve their quality of life.
The data used for calculating AAI originate from European Union surveys: EU- LFS (Labour Force Survey), EU-SILC (Statistics on Income and Living Conditions), EQLS (European Quality of Life Survey), EHLEIS (European Health and Life Expectancy Information Systems), Eurostat ICT (Information and Communications Technology) Survey and ESS (European Social Survey). When calculating AAI, responses to subjective questions were placed on a 0-100 scale, together with quantitative data (e.g. employment rate). As a result, all domains and
Active ageing index, new emphasis within the same methodology. The role of the Internet
indicators of AAI appear as percentage data, enabling researchers to make comparisons between countries and analyse the Active Ageing-related tendencies of any EU nation. The closer an indicator to 100 for any given year, the better the result for a particular country. Since gender also appears as a parameter for each indicator, it is even possible to make male – female comparative analyses.
The domains were recommended by the AAI research team, who also suggested the particular weighting values to be given to each indicator before being aggregated. Although all the indicators were to be given the same weighting originally (Zaidi et al., 2013), on scientific grounds they eventually used the weight functions indicated in Table 1.
As with nearly all-complex indices, AAI has faced criticism from many sides. It has mostly been criticised on mathematical and statistical grounds (e.g. São José et al., 2017; Djurovic et al., 2017), whereas our present paper argues that the role of certain factors that contribute to active ageing becomes more important over time, meaning that it might well be reasonable to adjust their weighting in the aggregate index with special regard to indicators presenting remarkably different values for most countries. We shall focus on one of these indicators in the next section: the growing importance of Internet usage.
2.2. The role of the Internet usage in active aging
Nowadays, it is an increasingly important question whether someone can use the Internet and the purpose they are using it for. In the literature, differences in Internet usage between social classes, countries, and communities are called digital divide. There are three levels of differences (Tirado-Morueta et al., 2018). First- digital divide refers to differences between those groups, who have access to information and communication technologies – including the Internet – and those, who do not. This level can be measured by using the ICT indicator, currently a part of AAI. The percentage of people without an Internet connection is decreasing in developed countries, so nowadays the importance has shifted to the efficient use of the Internet. This is what the second-level digital divide is about. The second-level digital divide explores the differences in the quality of Internet usage, which arises as a result of the inequalities in the skills related to Internet usage (Hargittai, 2002;
van Deursen & van Dijk, 2011). Finally, the third-level digital divide focuses on the exploitation of the benefits of Internet usage. Different groups with a similar level of Internet access and a similar efficiency to use it, might have different approaches to it and thus have a different potential to exploit its benefits. Both the second- and the third-level digital divide can be lowered by the improvement of digital literacy. There are programs and trainings to help with digital literacy for even older people (Tirado-Morueta et al., 2018). From now on, we will refer to higher-level digital literacy as quality Internet usage.
Active ageing index, new emphasis within the same methodology. The role of the Internet
However, it is important to note that sometimes the problems caused by the digital divide should not be seen that relevant, because in many cases it is possible to reach a socially efficient solution not only by reducing the divide. Loucanova et al.
(2017) show for example that in the case of packaging, the method usually chosen by older people is the one proposed by computer algorithms as a clever solution.
3. Methodology and empirical data
3.1. Empirical data
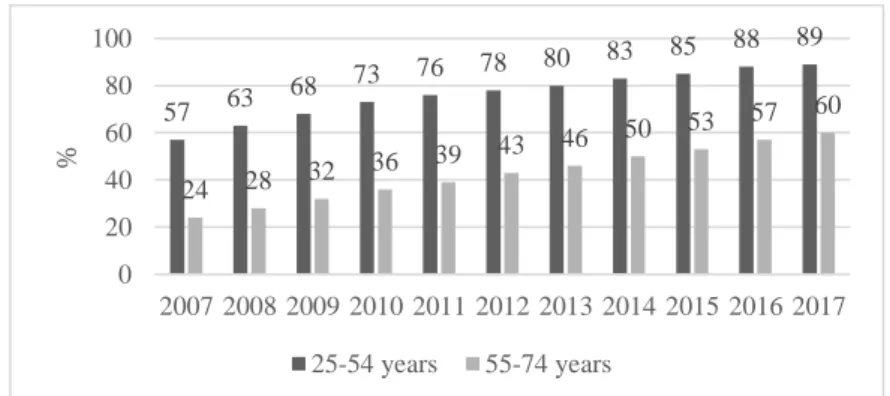
In many aspects, the Internet has been gaining importance in the lives of older people (Lazãr, Epure, & Spãtariu, 2011). As shown in Figure 1, the popularity of the Internet has been on the rise in the European Union among both the young and the old. In the past decade between 2007 and 2017, the rate of Internet users in the 55-74 year-old age group jumped from 24% to 60%. These data also suggest the strong likelihood that this pure measure of Internet usage, which shows “whether the person has used the Internet at least once a week in the last three months”, lacks any detail about how it was used. Later we will recommend a more sophisticated method for measuring how people use the Internet. Such a variable would result a more reliable AAI.
Figure 1 The rate of EU 28 Internet users from the 25-54 and 55-74 age groups who use the Internet at least once a week
Source: Eurostat (2018)
Nonetheless, behind the upward trend of Internet usage among older people (shown in Figure 1) there are still significant underlying differences. Though the percentage of users increased in all countries, the 2017 data reveal that in Romania and Luxembourg the proportion of elderly Internet users were 28% and 91%, respectively - a striking difference. However, looking at the increasing trends in
57 63 68 73 76 78 80 83 85 88 89 24 28 32 36 39 43 46 50 53 57 60
0 20 40 60 80 100
2007 2008 2009 2010 2011 2012 2013 2014 2015 2016 2017
%
25-54 years 55-74 years
Active ageing index, new emphasis within the same methodology. The role of the Internet
each country (see Table A1 in the Appendix), we can expect the differences between them to disappear soon (verified also by Peter & Valkenburg, 2006).
In AAI, the proportion of Internet users is found in the fourth domain as an indicator named "Use of Information and Communication Technology (ICT)". As shown in Table 1, Domain 4 is weighted 20%, and within it ICT is weighted 7%.
Consequently, the weighting of Internet usage is a meagre 1.4% within AAI.
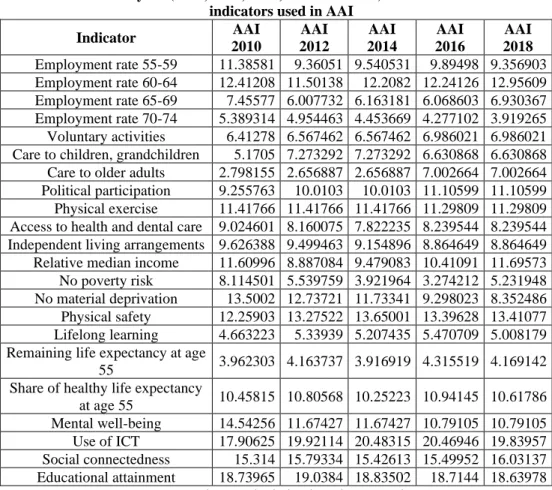
Considering the ever-increasing importance of Internet usage, this indicator seems quite underrepresented. It might be reasonable to increase its value. This argument is further supported by the fact that among all the 22 indicators of AAI, ICT still has the highest standard deviation (see Table A2 for the standard deviations of all variables). Djurovic et al. (2017) also called for an increased weighting for ICT.
They used a statistical estimation method known as the Composite I-distance Indicator (CIDI) to calculate the weightings of AAI indicators. For a detailed description about the CIDI method see Ivanovic (1973), Jeremic et al. (2011), and Dobrota et al. (2016).
These weights are not subjective; they are not based on estimates of the UNECE Expert Group on Active Ageing, which elaborated the original index. Instead, their values were calculated using the Pearson correlation coefficient. The values of the weightings generated are listed in the second column of Table 2.
Comparing the first two columns of Table 2, the difference between the statistical and the original weight estimates is visible in many places. For example, the original index used the same weight for all age groups in the employment domain, while according to the calculations of Djurovic et al. (2017) the 65-69 age groups got a more marked weight in AAI than the 60-64 age groups, which is still higher than that of the 55-59 age groups. (However, the weighting score of the employment rate of the 70-74 age groups is lower, but the employment rate of this age group is so small in fact that the difference of its coefficient makes is marginal.) The retirement age in the European Union is most commonly at 65 years, meaning that for people under 65 years of age employment is more probable than those who are 65 and older. Weights calculated with the composite I-distance also clearly indicate that the real challenge would be to improve the employment rate of people aged between 65 and 69.
The most interesting issue that concerns us here is the weight of ICT. Weights according to Djurovic et al. (2017) shown in Table 2 suggest that the indicator of ICT is only less important than mental health in Domain 4. In Domain 4, ICT originally had a weighting of 7%, which was increased – in fact, more than tripled – by Djurovic et al. (2017) to 22%. In AAI, the original weighting of 20% for Domain 4, which includes ICT, jumped to 33%. Weights calculated on a statistical basis therefore support our hypothesis that Internet usage as it appeared in the original AAI had too little weight.
Active ageing index, new emphasis within the same methodology. The role of the Internet
3.2. Methodology
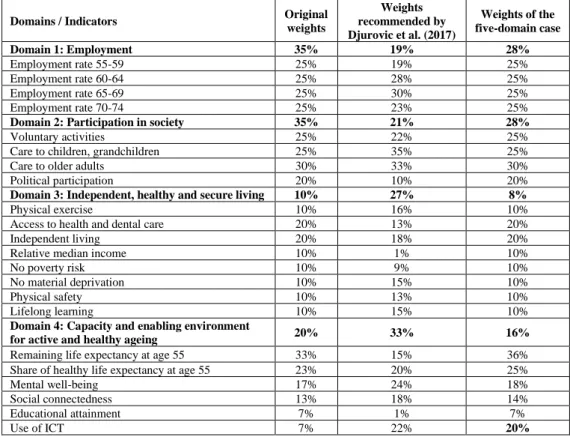
We examined the importance of Internet usage by creating an alternative weighting system in which ICT would have the highest weighting in the AAI. The relative weights of the other variables within their domains and the weights of the domains relative to one another remained unchanged. This calculation enables us to compare the rankings of countries generated by using the original and the increased ICT weightings, ceteris paribus. Implementation was done by removing ICT usage from Domain 4 and creating a separate domain, Domain 5, within AAI (cf. Table 2, column titled "Weights of the five-domain case"). Domain 5 was given a much higher weighting – 20% – than the original ICT weighting of 7% of 20%, which equalled only 1.4%.
Table 2 The weight functions of indicators and domains in the three cases
Domains / Indicators Original
weights
Weights recommended by Djurovic et al. (2017)
Weights of the five-domain case
Domain 1: Employment 35% 19% 28%
Employment rate 55-59 25% 19% 25%
Employment rate 60-64 25% 28% 25%
Employment rate 65-69 25% 30% 25%
Employment rate 70-74 25% 23% 25%
Domain 2: Participation in society 35% 21% 28%
Voluntary activities 25% 22% 25%
Care to children, grandchildren 25% 35% 25%
Care to older adults 30% 33% 30%
Political participation 20% 10% 20%
Domain 3: Independent, healthy and secure living 10% 27% 8%
Physical exercise 10% 16% 10%
Access to health and dental care 20% 13% 20%
Independent living 20% 18% 20%
Relative median income 10% 1% 10%
No poverty risk 10% 9% 10%
No material deprivation 10% 15% 10%
Physical safety 10% 13% 10%
Lifelong learning 10% 15% 10%
Domain 4: Capacity and enabling environment
for active and healthy ageing 20% 33% 16%
Remaining life expectancy at age 55 33% 15% 36%
Share of healthy life expectancy at age 55 23% 20% 25%
Mental well-being 17% 24% 18%
Social connectedness 13% 18% 14%
Educational attainment 7% 1% 7%
Use of ICT 7% 22% 20%
Source: Zaidi et al. (2013), Djurovic et al. (2017), and the third column contain the weights of our own thought experiment. Note: Use of ICT is the 5th domain in the five-domain case. In the five- domain case, the weight ratios of the domains relative to each another were the same as the ones of
the original weight system. Values in the table are rounded to the nearest integer.
Active ageing index, new emphasis within the same methodology. The role of the Internet
The original AAI weights are also included in Table 2 for easy comparison with weighting systems calculated in different ways. It is clearly visible that the weight functions recommended by Djurovic et al. (2017) differ from the original AAI weights significantly. As a result of modifying ICT while leaving everything else unchanged a marked difference appears in comparison with original AAI weights, even though we retained the relative proportions of the other weights (i.e. it represents a ceteris paribus change of the weights). The weight of ICT was 1.4% in the original estimate, 7.26% in Djurovic et al. (2017), and 20% in our analysis. The three different ICT weighting and the difference between the other coefficient weights enable us to test whether the original weighting system is robust or not.
Consequently, rankings by country can be compared to each other in the next section.
If our distinct weighting system results in considerably different rankings, it might well be worthwhile to reconsider the original weights. Nonetheless, even if the differences are insignificant, the original weights should still be adjusted slightly, but only in fields where economic development has created a new environment, and some new tendencies should also be taken into consideration in the assessment of the potentials of active ageing.
In the following section we calculate the average absolute difference indicator, a measure to see how the change in the weights affects the positions in the ranking.
The indicator has the following form for countries, which number equals to 𝑀:
𝑅̅ = 1
𝑀∑𝑀𝑐=1|𝑅𝑎𝑛𝑘𝑟𝑒𝑓(𝐶𝐼𝑐) − 𝑅𝑎𝑛𝑘(𝐶𝐼𝑐)|, (1) where, applying the markings used by OECD (2008), 𝑅𝑎𝑛𝑘𝑟𝑒𝑓(𝐶𝐼𝑐) is the position of country 𝑐 in the ranking according to the original weights, and 𝑅𝑎𝑛𝑘(𝐶𝐼𝑐) is the country’s new position.
4. Empirical results
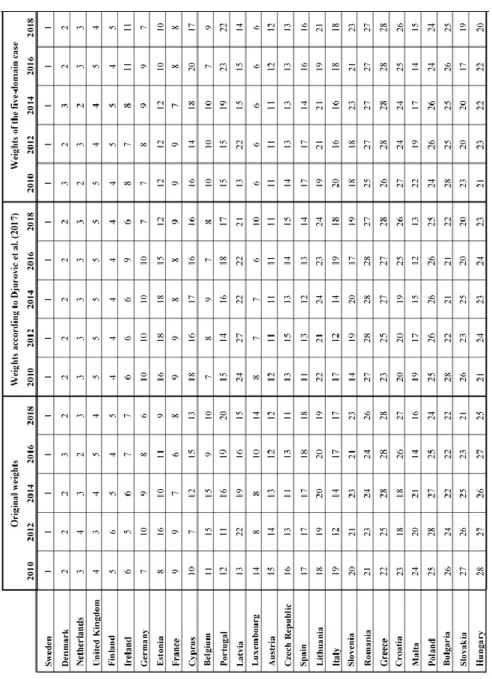
The goal of our analysis was to find out if the three different weighting systems resulted in different rankings of the 28 members of the European Union. AAI has been calculated in five distinct years so far, and separate rankings of the member states were compiled for each year. This is presented in Table A3 in the Appendix – the rankings for 2010, 2012, 2014, 2016 and 2018 are shown under each of the three weighting systems. (See more about the general importance of rankings in the decision-making processes of economic policy makers in Searing, 1978; Nelson &
Oxley, 1999; Hazelkorn, 2009)
Using the weights recommended by Djurovic et al. (2017) with 2018 AAI estimates, the results mostly favour Luxembourg, Spain and Slovenia. These countries ranked four places higher on the list when the original weights were replaced. On the other hand, the most disadvantaged countries in this respect were
Active ageing index, new emphasis within the same methodology. The role of the Internet
Latvia and Lithuania, falling six and five places respectively. The weighting systems do not seem to have affected the top and the bottom of the list: in both cases, the first three were Sweden, Denmark and Holland, and the last three Romania, Croatia and Greece.
Using the weights suggested by Djurovic et al. (2017), the average absolute difference between rankings according to equation (1) is 𝑅̅ = 1.93 in 2018. Since Djurovic et al. (2017) modified all the weights of indicators, the different rankings can not to be put down solely to Internet usage tendencies. In order to narrow the analysis down to weighting of ICT, the original ranking should be compared to the five-domain ranking.
As an example, looking at the AAI 2018 rankings and the five-domain case we see that in both cases Sweden, Denmark and Holland finished on top, Romania, Croatia and Greece at the bottom. Weights suggested by Djurovic et al. (2017) bore the same results. The rankings were pretty much the same in these countries with respect to Internet usage, too (cf. Appendix, Table A1), so it is hardly a surprise that a greater weighting of ICT did not help the lower-ranked countries to move up the list. The greatest improvements in comparison to the original ranking were made by Luxembourg and Hungary, ranking eight and five places higher respectively. In 2016 Luxembourg was home to the greatest number of elderly Internet users in the EU, whereas in the same year* Hungary was somewhere in the middle. Thus Hungary could make a spectacular advance in AAI ranking as a result of greater Internet usage. Lazãr, Epure, & Spãtariu (2011) also show how important it is to develop Internet usage in countries, where social progress can be obtained.
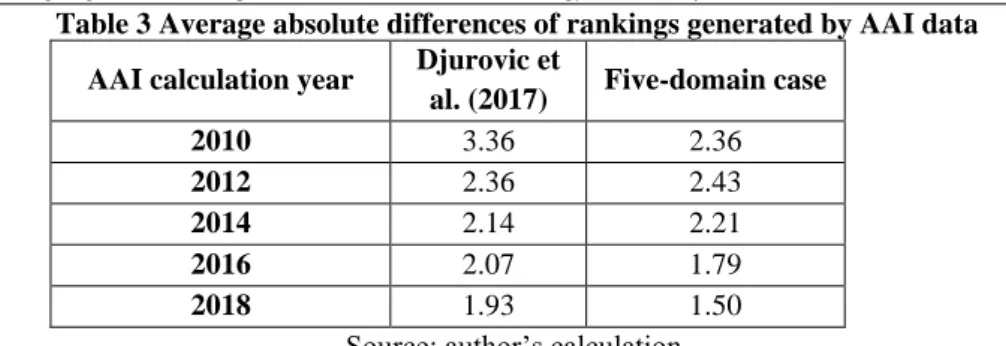
Cyprus would be affected by the new weight unfavourably; it would set the island nation back four places. In Cyprus, relatively few people from the older age group used the Internet at least once a week in 2016. All in all, according to equation (1), the average absolute difference between the rankings is 1.5 in 2018. This roughly means that by increasing the weighting for Internet usage, a country would shift 1.5 places away from its original position on average. This means that a weighting system, which attributes great importance to Internet usage would only alter the AAI 2018 rankings to a relatively small extent. The surprising thing is that our analysis revealed the lowest average absolute rank difference between the original and the Djurovic et al. (2017) rankings and also between the original and the five- domain rankings (Table 4) for the final year, 2018.
* Note that AAI 2018 is based on 2016 Internet usage data.
Active ageing index, new emphasis within the same methodology. The role of the Internet
Table 3 Average absolute differences of rankings generated by AAI data AAI calculation year Djurovic et
al. (2017) Five-domain case
2010 3.36 2.36
2012 2.36 2.43
2014 2.14 2.21
2016 2.07 1.79
2018 1.93 1.50
Source: author’s calculation.
As seen in Table 4, average absolute rank differences were not high in the first year, 2010 either. In case of the ranking generated by the weights recommended by Djurovic et al. (2017) countries shift 3.36 places on average, and in the five- domain case countries shift 2.36 places. All this shows the robustness of the ranking generated by the AAI index. In Table 4 we can also see that the average absolute differences, which are low to begin with, decrease even further in later years. The sole exception to this is an increase of 0.07 in the five-domain case, from 2010 to 2012. We will now show how this tendency is explained by increasing Internet usage and the converging ICT values of the countries involved.
ICT, like all indicators used for AAI calculations, is placed on a 0-100 scale. In case of ICT this number shows the percentage of 55-74 year-olds who used the Internet at least once per week in a three month period. Changes in each country’s ICT values could influence the composite index in several ways:
(i) If the ICT value increases by the same percentage points in all countries, then the AAI scores increase by an identical value as well. A given type of AAI, e.g. the original one that uses the weights established by the Expert Group will result in the same ranking of countries before and after the ceteris paribus increase.
(ii) If the ICT value increases more in certain countries than in the others, then, leaving all other variables unchanged, these certain countries advance in the ranking. This increase in rank is likely to be greater in AAIs where the ICT has a larger weight, like in our five-domain analysis.
(iii) If there are only small changes in ICT values, then that will only have minor effects on the rankings, if any. The use of ICT by 25-54 year-olds has already reached very high levels in all countries. As seen in Figure 1, the EU-wide average is 89%. In most individual countries it is at least 80%*. This will probably not decrease by the time this age group grows old. Therefore the future variations in Internet usage are likely to be minute and are unlikely to change the rankings.
* Except for Romania, Bulgaria and Italy, where these ratios are respectively 72%, 76% and
79%.
Active ageing index, new emphasis within the same methodology. The role of the Internet
Given the above three points, the progressive decrease in the average rank differences in Table 4 can be easily explained. The differences are decreasing because of the phenomenon described in point (iii). This is especially true of the difference between the experts’ weightings in the original AAI and our five- domain AAI, as these only differ in the weightings given to use of ICT. However, as the ICT values of all countries are converging, the difference between the rankings will be less and less. The average absolute differences between the original ranking and the ranking resulting from the weightings made by Djurovic et al. (2017) are larger, because the weights of all indicators were changed. The standard deviations of the indicators included in the AAI are presented in the Appendix, Table A2. The growth rates of the relative standard deviations from 2010 to 2018 are shown in Table 5 below.
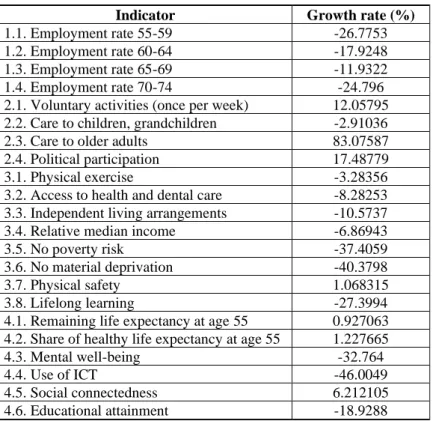
Table 5 Growth rates of relative standard deviations of the indicators used in the AAI from 2010 to 2018
Indicator Growth rate (%)
1.1. Employment rate 55-59 -26.7753
1.2. Employment rate 60-64 -17.9248
1.3. Employment rate 65-69 -11.9322
1.4. Employment rate 70-74 -24.796
2.1. Voluntary activities (once per week) 12.05795 2.2. Care to children, grandchildren -2.91036
2.3. Care to older adults 83.07587
2.4. Political participation 17.48779
3.1. Physical exercise -3.28356
3.2. Access to health and dental care -8.28253 3.3. Independent living arrangements -10.5737
3.4. Relative median income -6.86943
3.5. No poverty risk -37.4059
3.6. No material deprivation -40.3798
3.7. Physical safety 1.068315
3.8. Lifelong learning -27.3994
4.1. Remaining life expectancy at age 55 0.927063 4.2. Share of healthy life expectancy at age 55 1.227665
4.3. Mental well-being -32.764
4.4. Use of ICT -46.0049
4.5. Social connectedness 6.212105
4.6. Educational attainment -18.9288
Source: author’s calculation based on AAI data
Active ageing index, new emphasis within the same methodology. The role of the Internet
Table 5 shows that the relative standard deviation of some indicators increased, while that of others decreased in the analysis period. The use of ICT had the largest decrease in relative standard deviation. Table 5 as well as Figure 1 support that differences between countries in the use of ICT are vanishing.
In Table 4 the increase in average absolute difference in the case of the five- domain ranking from 2010 to 2012 is seemingly negligible, but it still exists. In addition, it has an important underlying cause. The use of ICT by older people in the 2012 AAI increased greatly in several countries that had previously been ranked lower. It is very important that the eight percentage points increase in ICT use by 55-74 year-olds from the year 2010 to 2012 (actually these are the ICT data on Figure 1 from the year 2008 and 2010) mainly happened as a result of lower ranked countries catching up, having nearly unchanged almost all other factors of AAI. That is why the five domains AAI changed much more compared to the expert based AAI, than the Djurovic et al. (2017) AAI, where the weight of AAI was not as emphasized as in the five-domain case.
The decrease in average absolute differences does not mean that we should not attribute more importance to Internet usage in AAI, since the Internet is actually becoming the primary means of communication between people, even for the older generation. It should not be forgotten that the range of usage has been increasing and will continue to do so. There is indeed much difference between occasionally checking a favourite news portal and using the Internet daily for money transfers, keeping contact with friends, making informed choices before shopping, etc. Over the eight years we have analysed the frequency of Internet usage varied greatly among the countries, so it may be safe to say that the quality of usage might also vary from country to country. The scientific literature of literacy shows several examples which also could give idea how Internet use could be measured. For example, Ahmed (2011) provides three characterizations of literacy based on the UNESCO definition. The first characterization is about the most superficial literacy, stating that a literate person is someone “who can, with understanding, both read and write a short simple statement on his or her everyday life”. The third, deepest characterization counts a person as literate if she / he has the “ability to identify, understand, interpret, create, communicate and compute using printed and written materials associated with varying contexts”, and using this ability they can communicate with the rest of society on a high level.
On the use of ICT, it is our opinion that the ICT indicator currently used in the AAI corresponds to the first characterization by Ahmed (2011). Just as nearly 100% of the adult population of the EU can read a simple statement, this conventional ICT indicator will soon reach close to 100%. Therefore its continued use is without merit. It is important to find an indicator of ICT usage that better characterizes a country’s level of development.
Active ageing index, new emphasis within the same methodology. The role of the Internet
Since the European ICT usage survey (Eurostat, 2018) posed several different questions to the respondents, not just whether they had used the Internet, it is conceivable that by grouping and publishing this information we could devise an indicator of “quality Internet usage”. There are several categories in the ICT survey that seem useful for this purpose, including but not limited to:
a) using the Internet for job searches b) using the Internet for e-learning c) using the Internet for e-banking.
Unfortunately, the currently published ICT survey data do not include statistics about how many people have used the Internet for at least one of these important purposes. If such an indicator were available, we would need to verify whether it better captures differences between countries than the currently used ICT. If so, such an indicator should be used when calculating AAI, otherwise we would need to keep looking for an indicator that truly captures the importance of Internet usage during everyday tasks. This indicator should describe the situation for all age groups, old and young alike. Further research is needed to properly explore this problem.
5. Conclusions
In our study we analysed the Active Ageing Index values of the European Union, which have been published every two years since 2010, and the rankings of the member states that they generate. These rankings were analysed with reference to the weighting system used when aggregating the categories that make up AAI.
The ranking defined by the original weight functions were considered the default.
Rankings defined by the other two weighting systems were compared to the default rankings. One of the weighting systems was the alternative published by Djurovic et al. in 2017, a system of coefficients on a mathematical-statistical basis. Our alternative weighting system multiplied the original weighting given to Internet usage by a factor of more than 14, but left the weight ratios of the rest of the indicators unchanged. The rankings changed more when the Djurovic weightings were applied, however, there has been a decrease in year-on-year average deviation. As far as the AAI 2018 indicators are concerned, the average difference remained below two in both alternative weighting systems.
Our analysis enables us to draw two conclusions. First, it has shown that the rankings generated from the original AAI are robust. Second, it calls attention to the fact that the role of the simple Internet usage indicator has decreased with the passage of time, and can be expected to keep decreasing. Since the Internet is becoming an essential tool of everyday life, it would be worthwhile to include it in AAI with a larger weight. However, we recommend that rather than simply
Active ageing index, new emphasis within the same methodology. The role of the Internet
measuring Internet usage, Internet usage essential to several everyday tasks is measured and included in the calculations.
Acknowledgements
The authors thank the anonymous reviewers for their valuable contribution at the the Second Seminar on Active Ageing, 27–28 September 2018, Bilbao. The authors also thank the very useful remarks of the two anonymous reviewers of the journal Studia Universitatis „Vasile Goldiș” Arad.
Funding
This research has been supported by the European Union and Hungary and co- financed by the European Social Fund through the project EFOP-3.6.2-16-2017- 00017, titled “Sustainable, intelligent and inclusive regional and city models”.
Disclosure Statement
The authors declare no conflict of interest.
Author Contributions
This study is the independent work of the two authors, from the conception of the topic, to the literature review, data collection, and analysis. The authors participated equally in the making of this paper.
References
1. Ahmed, M., (2011), Defining and Measuring Literacy: Facing the Reality, International Review of Education, 57(1-2), 179.
https://doi.org/10.1007/s11159-011-9188-x
2. Bandura, R., (2008), A Survey of Composite Indices Measuring Country Performance: 2008 update. New York: United Nations Development Programme, Office of Development Studies (UNDP/ODS Working Paper)
3. Berde, É., Kuncz, I., (2019), What is the Best Way to Take Internet Usage into Consideration in the Different Variants of the Active Ageing Index?. Society and Economy, 1-15. https://doi.org/10.1556/204.2019.003
4. Carstensen, L.L., (1995), Evidence for a Life-Span Theory of Socioemotional Selectivity. Current Directions in Psychological Science, 4, 151-156.
https://doi.org/10.1111/1467-8721.ep11512261
5. Djurovic, I., Jeremic, V., Bulajic, M., Dobrota, M., (2017), A Two-Step Multivariate Composite I-Distance Indicator Approach for the Evaluation of Active Ageing Index. Journal of Population Ageing, 10(1), 73–86.
https://doi.org/10.1007/s12062-016-9169-8
Active ageing index, new emphasis within the same methodology. The role of the Internet
6. Dobrota, M., Bulajic, M., Bornmann, L., Jeremic, V., (2016), A New Approach to the QS University Ranking Using the Composite I-distance Indicator:
Uncertainty and Sensitivity Analyses. Journal of the Association for Information Science and Technology, 67(1), 200–211. https://doi.org/10.1002/asi.23355
7. EU, (2007), Ageing Well in the Information Society: Action Plan on Information and Communication Technologies and Ageing. Retrieved from: https://eur- lex.europa.eu/legal-content/EN/TXT/?uri=LEGISSUM%3Al24292, Accessed on March 8, 2019.
8. Eurostat, (2018), Eurostat Database, Retrieved from:
http://ec.europa.eu/eurostat/data/database. Accessed on March 5, 2018.
9. Hargittai, E., (2002), Second-Level Digital Divide: Differences in People’s Online Skills. First Monday, 7(4), https://doi.org/10.5210/fm.v7i4.942
10. Hazelkorn, E., (2009), Rankings and the Battle for World-Class Excellence, Higher Education Management and Policy, 21(1), 1-22.
https://doi.org/10.21427/D76P7M
11. Hawton, A., Green, C., Dickens, A.P., Richards, S.H., Taylor, R.S., Edwards, R., Campbell, J.L., (2011), The Impact of Social Isolation on the Health Status and Health-Related Quality of Life of Older People. Quality of Life Research, 20(1), 57-67. https://doi.org/10.1007/s11136-010-9717-2
12. Hellström, Y., Persson, G., Hallberg, I.R., (2004), Quality of Life and Symptoms Among Older People Living at Home. Journal of advanced nursing, 48(6), 584-593. http://doi.org/10.1111/j.1365-2648.2004.03247.x
13. Ivanovic, B., (1973), A Method of Establishing a List of Development Indicators. Paris: United Nations educational, scientific and cultural organization.
14. Jeremic, V., Bulajic, M., Martic, M., Radojicic, Z., (2011), A Fresh Approach to Evaluating the Academic Ranking of World Universities. Scientometrics, 87(3), 587–596. https://doi.org/10.1007/s11192-011-0361-6
15. Krueger, D.C., Stone, D.L., Lukaszewski, K.M., (2018), Age and the Digital Divide, Journal of Strategic Innovation and Sustainability, 13(3), 75-84.
16. Lazăr, C., Epure, D.T., Spătariu, E.C., (2011), Digital Economy Impact on Society, Ovidius University Annals, Economic Sciences Series, Ovidius University of Constantza, Faculty of Economic Sciences, 11(1), 1131-1133.
17. Loucanova, E., Kalamarova, M., Parobek, J., (2017), The Innovative Approaches to Packaging – Comparison Analysis of Intelligent and Active Packaging Perceptions in Slovakia, Studia Universitatis „Vasile Goldis” Arad, Economics Series, 27(2), 33-44. http://doi.org/10.1515/sues-2017-0007
18. Neagu, O., Dima S., (2017), Impact of Globalisation On Economic Growth in Romania: An Empirical Analysis of Its Economic, Social and Political Dimensions, Studia Universitatis „Vasile Goldis” Arad, Economics Series, 27(1), 29-40.
http://doi.org/10.1515/sues-2017-0003
Active ageing index, new emphasis within the same methodology. The role of the Internet
19. Nelson, T.E., Oxley, Z.M., (1999), Issue Framing Effects on Belief Importance and Opinion, The Journal of Politics, 61(4), 1040-1067.
http://doi.org/10.2307/2647553
20. OECD, (2008), Handbook on Constructing Composite Indicators, Methodology
and User Guide. Paris: OECD Publications.
https://doi.org/10.1787/9789264043466-en
21. Peter, J., Valkenburg, P.M., (2006), Adolescents’ Internet Use: Testing the
“Disappearing Digital Divide” versus the “Emerging Digital Differentiation”
Approach. Poetics, 34(4-5), 293-305, https://doi.org/10.1016/j.poetic.2006.05.005 22. São José, J.M., Timonen, V., Amado, C.A.F., Santos, S.P., (2017), A Critique of the Active Ageing Index, Journal of Aging Studies, 40, 49-56.
https://doi.org/10.1016/j.jaging.2017.01.001
23. Searing, D.D., (1978), Measuring Politicians' Values: Administration and Assessment of a Ranking Technique in the British House of Commons. American Political Science Review, 72(1), 65-79, https://doi.org/10.2307/1953599
24. Srinuan, C., Bohlin, E., (2011), Understanding the Digital Divide: A Literature Survey and Ways Forward, 22nd European Regional ITS Conference, Budapest 2011: Innovative ICT Applications – Emerging Regulatory, Economic and Policy Issues 52191, International Telecommunications Society (ITS).
25. Tirado-Morueta, R., Aguaded-Gómez, J.I., Hernando-Gómez, Á., (2018), The Socio-Demographic Divide in Internet Usage Moderated by Digital Literacy
Support. Technology in Society, 55, 47-55.
https://doi.org/10.1016/j.techsoc.2018.06.001
26. Van Deursen, A.J., Van Dijk, J., (2011), Internet Skills and the Digital Divide, New Media & Society, 13(6): 893-911. https://doi.org/10.1177/1461444810386774 27. WHO, (2002), Active Ageing – A Policy Framework, The Contribution of the World Health Organization to the Second United Nations World Assembly on Ageing, Madrid, Spain, April 2002.
28. Yang, L., (2014), An Inventory of Composite Measures of Human Progress, Occasional Paper on Methodology, UNDP Human Development Report Office 29. Zaidi, A., Gasior, K., Hofmarcher, M.H., Lelkes, O., Marin, B., Rodrigues, R., Schmidt, A., Vanhuysse, P., Zolyomi, E., (2013), Active Ageing Index 2012:
Concept, Methodology and Final Results. Report Produced in Collaboration with UNECE (Geneva) and European Commission’s DG for Employment, Social Affairs & Inclusion, (Brussels).
Active ageing index, new emphasis within the same methodology. The role of the Internet
Appendix Table A1 The percentage of EU Internet users from the 55-74 age groups who used
the Internet at least once a week in the years data was converted to AAI indicators (%).
Country
2008 (AAI 2010)
2010 (AAI 2012)
2012 (AAI 2014)
2014 (AAI 2016)
2016 (AAI 2018)
Belgium 37 48 55 64 67
Bulgaria 7 12 18 22 26
Czech Republic 20 28 36 47 52
Denmark 57 67 73 82 87
Germany 38 47 52 60 68
Estonia 24 33 41 55 61
Ireland 25 29 43 45 51
Greece 6 8 13 24 28
Spain 15 23 30 38 47
France 35 44 55 60 63
Croatia 7 12 20 32 35
Italy 13 20 24 32 40
Cyprus 8 14 22 24 36
Latvia 17 21 35 42 49
Lithuania 14 19 24 35 39
Luxembourg 53 69 75 83 91
Hungary 25 27 37 43 51
Malta 16 23 33 44 45
Netherlands 61 70 77 81 84
Austria 35 38 45 49 58
Poland 14 18 24 31 37
Portugal 11 19 22 27 36
Romania 4 7 13 16 24
Slovenia 16 26 28 33 40
Slovakia 20 32 37 43 49
Finland 49 58 68 76 77
Sweden 63 70 78 81 86
United Kingdom 44 56 66 74 81
Source: Eurostat (2018)
Active ageing index, new emphasis within the same methodology. The role of the Internet
Table A2 The 5-year (2010, 2012, 2014, 2016 and 2018) standard deviations of indicators used in AAI
Indicator AAI
2010
AAI 2012
AAI 2014
AAI 2016
AAI 2018 Employment rate 55-59 11.38581 9.36051 9.540531 9.89498 9.356903 Employment rate 60-64 12.41208 11.50138 12.2082 12.24126 12.95609 Employment rate 65-69 7.45577 6.007732 6.163181 6.068603 6.930367 Employment rate 70-74 5.389314 4.954463 4.453669 4.277102 3.919265 Voluntary activities 6.41278 6.567462 6.567462 6.986021 6.986021 Care to children, grandchildren 5.1705 7.273292 7.273292 6.630868 6.630868 Care to older adults 2.798155 2.656887 2.656887 7.002664 7.002664 Political participation 9.255763 10.0103 10.0103 11.10599 11.10599 Physical exercise 11.41766 11.41766 11.41766 11.29809 11.29809 Access to health and dental care 9.024601 8.160075 7.822235 8.239544 8.239544 Independent living arrangements 9.626388 9.499463 9.154896 8.864649 8.864649 Relative median income 11.60996 8.887084 9.479083 10.41091 11.69573 No poverty risk 8.114501 5.539759 3.921964 3.274212 5.231948 No material deprivation 13.5002 12.73721 11.73341 9.298023 8.352486 Physical safety 12.25903 13.27522 13.65001 13.39628 13.41077 Lifelong learning 4.663223 5.33939 5.207435 5.470709 5.008179 Remaining life expectancy at age
55 3.962303 4.163737 3.916919 4.315519 4.169142 Share of healthy life expectancy
at age 55 10.45815 10.80568 10.25223 10.94145 10.61786 Mental well-being 14.54256 11.67427 11.67427 10.79105 10.79105 Use of ICT 17.90625 19.92114 20.48315 20.46946 19.83957 Social connectedness 15.314 15.79334 15.42613 15.49952 16.03137 Educational attainment 18.73965 19.0384 18.83502 18.7144 18.63978
Source: author’s calculation based on AAI data.
Active ageing index, new emphasis within the same methodology. The role of the Internet
Table A4 Rankings of European Union member states using three different weight functions. These are based on AAI values of 2010, 2012, 2014, 2016 and 2018
Sources: Zaidi et al. (2013), Djurovic et al. (2017) and our own thought experiment.