Regular Article
Label-free tracking of whole-cell response on RGD functionalized surfaces to varied flow velocities generated by fluidic rotation
Kinga Dóra Kovács
a,b, Martin Novák
a, Zoltán Hajnal
c, Csaba H} os
d, Bálint Szabó
b, Inna Székács
a, Ye Fang
e, Attila Bonyár
f,⇑, Robert Horvath
a,⇑aNanobiosensorics Laboratory, ELKH EK MFA, Budapest, Hungary
bDepartment of Biological Physics, Eötvös University, Budapest, Hungary
cMicrosystems Laboratory, ELKH EK MFA, Budapest, Hungary
dDepartment of Hydrodynamic Systems, Budapest University of Technology and Economics, Budapest, Hungary
eEIG New Programs, Corning Research and Development Corporation, Corning Incorporated, NY, USA
fDepartment of Electronics Technology, Faculty of Electrical Engineering and Informatics, Budapest University of Technology and Economics, Budapest, Hungary
g r a p h i c a l a b s t r a c t
a r t i c l e i n f o
Article history:
Received 26 November 2020 Revised 11 April 2021 Accepted 18 April 2021 Available online 20 April 2021
Keywords:
Label-free Biosensor
Interface phenomena Fluidic flow Cell adhesion
a b s t r a c t
Fluidic flow plays important roles in colloid and interface sciences. Measuring adsorption, aggregation processes and living cell behavior under a fluidic environment with varied flow velocities in a parallel and high-throughput manner remains to be a challenging task. Here a method is introduced to monitor cell response to well-defined flow with varied velocities over an array of label-free resonant waveguide grating (RWG) based optical biosensors. The arrangement consists of a circular well with an array of biosensors at the bottom surface. By rotating the liquid over the biosensor array using a magnetic stirrer bar, flow velocities from zero to a predefined maximum can be easily established over different locations within the biosensor array as characterized in detail by numerical simulations. Cell adhesion and detach- ment measurements on an Arg-Gly-Asp (RGD) peptide functionalized surface were performed to demon- strate i) measurements at a wide range of simultaneous flow velocities over the same interface; ii) the possibility of parallel measurements at the same flow conditions in one run; and iii) the simple tuning
https://doi.org/10.1016/j.jcis.2021.04.091
0021-9797/Ó2021 The Authors. Published by Elsevier Inc.
This is an open access article under the CC BY-NC-ND license (http://creativecommons.org/licenses/by-nc-nd/4.0/).
⇑Corresponding author.
E-mail addresses:bonyar@ett.bme.hu(A. Bonyár),horvathr@mfa.kfki.hu(R. Horvath).
Contents lists available atScienceDirect
Journal of Colloid and Interface Science
j o u r n a l h o m e p a g e : w w w . e l s e v i e r . c o m / l o c a t e / j c i s
Cell detachment Biomimetic interfaces Colloid adsorption Flow field Rotating flow RGD peptide motif High-Throughput fluidics
of the employed range of flow velocities. Our setup made it possible to analyze the magnitude and rate of cell detachment at various flow velocities in parallel and determine the critical velocity and force where cells start to detach from the RGD motif displaying biomimetic surface. Furthermore, cellular response to simultaneous mechanical (flow) and chemical stimulation was also investigated using trypsin as a model.
This study opens a new possibility to investigate interface phenomena under predefined and conve- niently varied flow conditions.
Ó2021 The Authors. Published by Elsevier Inc. This is an open access article under the CC BY-NC-ND license (http://creativecommons.org/licenses/by-nc-nd/4.0/).
1. Introduction
Fluidic flow over interfaces has a crucial role in various fields, including physics[1], chemistry[2], colloid sciences[3,4], and cell biology[5]. Surface adsorption and aggregation processes are also heavily altered by the flow of the dissolving solutions, since any flow over the interface alters the bulk concentration of the dis- solved species near the boundary, which is a key parameter in all adsorption and aggregation phenomena[3,4,6,7].
As previous studies indicated fluid flow over the solid-liquid interface not only plays an important role in basic research fields, but also in processes with high technological relevances, such as polyelectrolyte adsorption and layer build-up [1], the self- assembly of peptide-loaded microgels[8], and in the detachment of colloidal particles from a flat substrate [3]. Interestingly, the flow can control the structure of materials, as it was demonstrated for gel network systems, like Carbopol[2].
Not less importantly, living cells in the human body are often exposed to liquid flow besides various chemical and mechanical signals controlling their behavior. Typical assays investigating cell behaviorin vitroemploy a static fluidic environment. However, in the body, most of the cells and tissues are exposed to some kind of flow. For example, endothelial cells forming the inner wall of blood vessels receive important signals through cell surface receptors from the blood flow. The flow also plays an essential role in cancer metastasis and immune cell actions. Previous works highlighted the importance of flow environment by investigating the adhesion of monocytes to endothelial layers[9,10], ion channel function in endothelial cells exposed to flow [11], adhesion and detachment of breast cancer cells under a continuous flow environment[12]
or the effect of drugs on cancer cell adhesion inside a flow environ- ment[12]. Besides the cardiovascular system, the lymphatic sys- tem is also an environment where cells are exposed to flow [13,14]. It could be useful and important to study immune cell interactions with different materials not only in static conditions, but also under fluid flow to better approach physological condi- tions[15,16].
Flow velocity varies greatlyin vivoin the cardiovascular system.
The velocity in the capillaries is often less than 5 cm/s, whereas the velocity can be as high as 50 cm/s in the aorta and around 30 cm/s inside the venae cavae. In contrast, the highest velocity in the lym- phatic system is around 0.6 mm/s [13,14,17]. Considering the actual morphology and configuration, the shear stress also varies greatly across different tissues and organsin vivo. The mean shear stress is the lowest in the large veins, less than 1 dyne/cm2, but rel- atively high in small arterioles, where it can reach 80 dyne/cm2and with a maximum of 40 dyne/cm2in small venules[18]. Inside the smallest capillaries (~4
l
m in diameter), the shear stress is in the range of 2 to 95 dyne/cm2[19].Several different approaches have been developed to establish a well-controlled flow over living cellsin vitro. Lateral flow is gener- ally created by using a microfluidic channel and a pump[20–22].
Such arrangements are also adapted in other fields in chemical and interface sciences to control the flow profile over a given sur- face [1,2,5,6]. This configuration, however, requires a relatively
large amount of assay medium (in the range of mL-L) for each mea- surement, which is impractical when the applied drugs or other chemical or colloidal species are expensive or available in tiny amounts only. Another solution is the cone and plate device, where a relatively large cone is rotated above the cells[23–26]. Early ver- sions of this method go back to the 80’s[23,24]. This configuration was not adapted outside of the field of cell biology, possibly due to the difficulty to control and vary the concentration of dissolved species in this arrangement. Of note, this arrangement provided end-point data only and the kinetics of processes could not be investigated.
Optical microscopy is the standard technique used to monitor the effect of flow on the morphology of adherent cells, but it has a relatively poor temporal resolution (hours-days) and low- throughput, making the biological and biophysical model develop- ment cumbersome. Morover, objects with sizes in the sub-micron or nanometer range are invisible in standard optical microscopy settings, and can not be adapted to colloid and interface studies.
It should also be emphasized that, except for one progressive study [12], all of the setups mentioned above offered a relatively low- throughput. Also, typically 1–2 flow conditions could be only investigated in a run. This limits again applicability, since large amount of measurements at various conditions in a reasonable time-frame is a prerequest of most cost-effective bio-chemical research and technological process optimization.
Novel biotechnological and biological problems require high- throughput methods, preferably a wide range of flow velocities that can be applied simultaneously on the same cell or tissue cul- ture to minimize experimental variations. Nowadays, a new gener- ation of biosensors is emerging to investigate the morphology and content of living cells at the nanometer scale with excellent tem- poral resolution and throughput. Typical examples are the reso- nant waveguide gratingb (RWG) [27], quartz crystal microbalance (QCM)[28], electric cell-substrate impedance sens- ing (ECIS) [29], and surface plasmon resonance (SPR) methods [30]. It is important to stress that these methods are readily appli- cable to investigate the surface behaviour of biomolecules and col- loids in a high-resolution, real-time and high-throughput manner [31–33].
Waveguide-based optical biosensors use an exponentially decaying evanescent field to monitor the refractive index in a 150 nm thick layer above the waveguide. In the novel RWG config- urations, a corrugated waveguide is illuminated from below with a broadband light source and reflects a narrow wavelength range only, the so-called resonant wavelength. Refractive index changes inside the evanescent field detune the resonant and shift the reso- nant wavelength. The measured wavelength shift is proportional to the optical density above the surface and consequently propor- tional to the number of biomolecules or surface adhered living cells. RWGs are available in high-throughput formats and were successfully employed to follow cell adhesion kinetics[34], cell signaling[35–38], nanoparticle-cell interactions[39]. The technol- ogy has a sufficiently large spatial resolution to resolve single-cells and can be employed in the emerging field of single-cell biology.
Very recently, RWG was combined with robotic fluidic force
microscopy (FluidFM BOT), and it was demonstrated that the mea- sured optical response is proportional to the surface adhesion force of single cells[40].
Here, we introduced rotating liquid as a means to generate var- ious flow velocities over an array of 37 RWG biosensors and simul- taneously monitored whole-cell responses using the biosensors.
We demonstrated that it is possible to perform at least four parallel whole-cell measurements at 7 different fluid velocities in a single run and to monitor the effect of signaling molecules on cell behav- ior without any perturbation of the generated flow field. The rich data set obtained from the measurements were used to obtain the critical velocity and force where cells start to detach and the rate of detachment and its dependence on the employed flow velocity.
2. Materials and methods 2.1. Experimental protocols
2.1.1. Polymer solutions and coating protocols of biosensor surfaces Poly(L-lysine)-graft-poly(ethylene glycol) (PLL-g-PEG, [PLL(20)- g(3.5)-PEG(2)]) (hereafter PP) and its Arg-Gly-Asp (RGD) peptide functionalized counterpart: PLL-g-PEG/PEGGGGGYGRGDSP (PLL- g-PEG-RGD, [PLL(20)-g(3.5)-PEG(2)/PEG(3.4)-RGD (14.7%)]) (here- after PPR) were obtained as powder from SuSoS AG (Dübendorf, Switzerland) and were stored at20°C until use.
For coating, both PP and PPR polymers were dissolved in 10 mM pH 7.4 sterile-filtered 2-[4-(2-hydroxyethyl)piperazin-1-yl]ethane sulfonic acid (HEPES) with a final concentration of 1 mg/mL and mixed in 1 to 1 ratio. Each well was first hydrated with 10 mM pH 7.4 sterile-filtered HEPES, followed by incubating with 800mL of the PP and PPR mixture under gentle shaking for 30 min. After removing the mixture solution, the wells were washed with 2 mL HEPES solution and finally rinsed with 2 mL of assay buffer.
All chemicals used were of analytical purity grade and were obtained from Sigma-Aldrich unless stated otherwise.
2.1.2. Cell culture
HeLa cell line (93021013 Sigma-Aldrich) was maintained in Dulbecco’s Modified Eagle’s Medium (DMEM), supplemented with 10% fetal bovine serum (Biowest SAS, France), 4 mML-glutamine, 100 U/mL penicillin, and 100mg/mL streptomycin. Cells were cul- tured in a humidified atmosphere containing 5% CO2at 37°C.
2.1.3. Preparation of cell suspensions
The assay buffer, 20 mM pH 7.4 HEPES-HBSS, was prepared by mixing HEPES with Hank’s balanced salt solution (HBSS), sterile- filtered and stored at 4°C.
For the experiment, HeLa cells were removed from tissue cul- ture dishes using a standard procedure (0.05% (w/v) trypsin, 0.02% (w/v) 2,20,20’,20’’-(Ethane-1,2-diyldinitrilotetraacetic acid (EDTA)). After centrifugation at 200xg for 5 min and removing the cell culture medium, the cell pelet was re-suspended in 1 mL of assay buffer and ready-to-use for biosensor assays.
2.1.4. Label-free cell assays
2 mL of the assay buffer was added to each well, and then the assembled biosensor unit was placed into an Epic BT reader. After the signal became stable, the baseline was recorded for approxi- mately 20 min. 800,000 cells in 2 mL of assay buffer were then added to each well while the measurement was paused. The spreading of the cells was monitored until the signal reached a pla- teau. Afterward, the reader was paused again, and the experimen- tal arrangement for fluid rotation was assembled over one well while the other, the reference well, remained intact to filter out
the effect of any interference factors (seeFig. 1). By switching on the magnetic stirrer bar with a given rotation frequency, the assay buffer was rotated over the cells for 60 min.
2.2. Epic BT biosensor reader and sensor inserts with custom wells The RWG based Epic BT biosensor reader (Corning Incorporated, Corning, NY) was used in all of the experiments. The reader accepts 96 or 384 well biosensor microplates and has a whole microplate read time of 3 s, facilitating label-free kinetic measurement. The resonant wavelength distribution is imaged by a CCD camera in a range of 15 000 pm centered around 830 nm with 0.25 pm resolu- tion. In the developed fluidic scheme, we used Corning Epic 384 well microplate ‘‘inserts” containing 384 22 mm optical biosen- sors with a 2.5 mm separation distance. This insert is the glass bot- tom of the original cell assay 384 well microplate without the plastic with 384 wells attached to its surface. Instead of the origi- nal plastic holey plate, the sensor insert was attached to a home developed arrangement containing two circular wells. A rotating magnetic bar above an array of RWG sensor units in one of the two wells generated the unique flow fields, while the well was used as a reference.
2.3. Biosensor data acquisition and evaluation
Both the reference well and the assay well with the rotating magnetic bar contained 37 waveguide sensors. In order to elimi- nate any variations in the number of adhered cells on the individ- ual sensors, the recorded signals were normalized with the saturated cell adhesion signals, measured at the start of the fluid rotation. The assay well’s signal during the rotation was corrected with the reference well’s signal during data analysis.
To determine the effects of the flowing assay buffer on the cells and to compare the biosensor data with the results of numerical simulation, each sensor’s signal was analyzed individually and plotted on a two-dimensional heatmap in the function of their lat- eral position. Afterward, the averaged signal that was recorded in the reference well was subtracted from each sensor’s signal in the assay well.
The recorded biosensor signal at each sensor corresponds to the averaged response over the whole 22 mm sensing area. Corre- spondingly, we calculated the averaged velocities over each sensor from the velocity profile obtained from numerical simulations.
2.4. Numerical simulation of flow velocity profiles 2.4.1. Geometry and mesh
The fluid dynamics simulation was performed by using a com- mercial CFD (computational fluid dynamics) software, ANSYS CFX.
To model the experimental setup, which has both stationary and rotating parts, the geometric model was partitioned into two dif- ferent domains: a stationary (i.e., the reference well) and a rotating one (i.e., a cylinder which includes the walls of the rotating bar). In contrast to the real experimental geometry (Fig. 1c), the magnetic stirrer bar did not touch the cover plate, because if it would, the elements near the contact point would have been skewed. In order to eliminate this problem, a 0.1 mm thick gap was introduced between the top of the well and the magnetic stirrer bar. Conse- quently, the height of the well was 15.1 mm instead of 15 mm.
In this way, the distance between the bottom of the well and the bar in the computer model was the same as in the experiment.
The employed mesh consisted of 332,753 elements, hexahedral elements near the walls, tetrahedral elements everywhere else.
2.4.2. Boundary conditions
The traditional boundary condition for fluid flow over a solid wall is prescribing vanishing velocity components for both the tangential and off-wall directions[41]. However, for textured surfaces, such as the surface analyzed in this study, the no-slip boundary condition might be inappropriate. In such a case, one defines slip length[42], which, geometrically, is the distance that the velocity profile has to be extrapolated to reach zero value. The so-called transpiration velocity becomes significant for textured walls, which connects the change of the streamwise velocity component and the off-wall velocity component via the continuity equation[43]. It was clearly demonstrated by Bolanos[44]that the no-slip boundary condition is the first order corrector to the ‘‘effective boundary” condition on the limiting smooth surface and, by using the proposed method, the authors had provided a formula for computing the slip length for various geometries. In this study, we acknowledge the fact that for textured surfaces, it might be necessary to interpolate between free-slip and no-slip boundary conditions; however, the interpola- tion weights might be problem-dependent and, even more, must be tuned based on measurements.
2.4.3. Fluidic model and solver
In the stationary domain, the equations were solved in a sta- tionary reference frame, while the rotating domain’s motion was modeled by using the multiple reference frame (MRF) approach, i.e., by solving the equation in a rotating framework.
In CFX, the well-known Shear Stress Transport (SST) model was used with free-slip boundary conditions, which unites the advan- tages ofk-
e
(reasonable convergence rate even from not too good initial conditions) andk-x(more precise, better wall treatment).SST uses so-called blending functions to mix the two mentioned models; it usesk-xnear the walls andk-
e
in the internal regions.For each rotation frequency, a steady-state simulation was run until the convergence of the RMS residuals got a stall, and there was no further increase in accuracy (~10-4).
Afterward, a 2 s long transient simulation was performed, ini- tialized with the stationary simulation results. The time-stepping scheme was second-order backward, with adaptive time- stepping, limiting the maximal step size to~104s. The inner cycle of a time step was stopped if the RMS residual reached~105,and the imbalance of the conserved quantities was under 0.1%.
Fig. 1. The experimental setup for creating the rotating fluidic flow field over an array of RWG sensor elements. a) Block diagram of the main parts of the setup. b) Illustration of the flow field and cell interactions in the assay and reference wells, respectively. c) The custom made two-welled plate and its assembly together with the insert (sensor plate) of a standard 384 well Epic cell assay microplate, plastic cover plate, magnetic stirrer bar, and electrical rotor. d) Photos of the custom made PTFE well containing the insert. e) The arrangement of the 37 sensor elements inside the individual wells. Note, one of the RWG sensors is located exactly at the center of the circular well.
3. Results and discussion
3.1. Rotating fluidic flow field over an array of optical biosensors We used a custom-built setup to perform all assays (Fig. 1). In this setup, two wells were formed on a standard Corning Epic
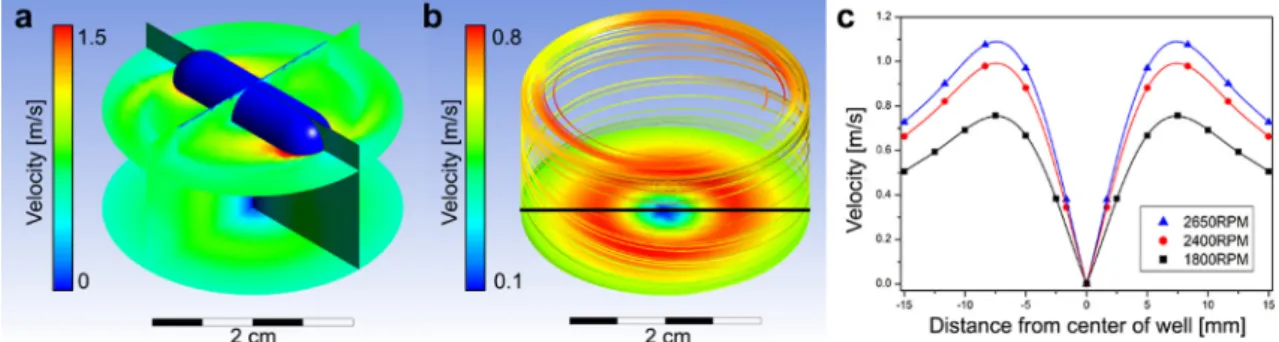
microplate insert containing 384 RWG biosensors using a home- made polytetrafluoroethylene (PTFE) cell (Fig. 1d). Each well has an inner diameter of 30 mm and a height of 15 mm, and contains an array of 37 sensor elements (Fig. 1e). Both wells were filled with the buffer solution and sealed tight with a standard plastic cover plate to filter out any unwanted light during the measurements Fig. 2. a) Cross-sectional view of the simulated flow velocity profile. b) The velocity profile at the bottom of the well with a few visualized streamlines inside the well. c) The total velocity was plotted against the radial positions in the well at the three different stirrer rotation frequencies and fitted 5th-degree polynomial functions.
Fig. 3.Optical microscopic images of adhered HeLa cells at a) the center of the well, b) at 9 mm, and c) 13.5 mm radial positions (from the center) before rotation. The corresponding images after 60 min of rotating flow above the cells are d), e), and f). The decreasing number of cells with increasing radial position is clearly seen in d), e), and f).
Fig. 4.Biosensor data obtained from the experiments with the highest employed rotation frequency (2650 RPM). The data were corrected with the reference well’s signal. The vertical dotted line marks the end of the cell adhesion phase and the start of stirring and subsequent cell detachment inside the assay well. The output of the sensors (recorded resonant wavelength shifts) were normalized, considering this point as the reference. Each curve’s color helps to identify the sensor’s position inside the circular well with which the actual kinetic curve was recorded.
(Fig. 1c). In one of the two wells, a rotating flow field was gener- ated with a magnetically levitated stirrer bar, while another well served as a reference with idle buffer (Fig. 1b). The cylindrical mag- netic stirrer bar (length: 20 mm, diameter: 6 mm) was placed inside the well during assembly, while a 12 V DC motor (type:
SUNON ME50101V1-000U-G99) was fixed above the sealed cover plate using laboratory stands. To enhance the magnetic grip between the fan and the magnetic stirrer bar and to position it, an N52 type neodymium magnet (20 mm 5 mm, thickness 2 mm) was attached to the bottom of the fan. During assembly we also used micromachined spacers and positioners to ensure that the rotor is precisely positioned above the center of the well, thus the stirring bar also will be at the center of the well. The air gap between this magnet and the cover plate was set to 5 mm in all experiments (Fig. 1b). The speed of the fan was controlled by pulse-width modulation (PWM) by using a custom controller cir- cuit and software. The rotation speed in RPM (rotation per minute) was directly measured and fed back by the fan. In all of our con- ducted experiments with different rotation speeds (1800, 2400, or 2650 RPM), the fan and the magnetic stirrer bar were entirely in phase.
An important requirement of the experimental setup is to min- imize the mechanically introduced noise in the system since the optical sensors are quite sensitive to vibrations. Of note, in our setup there is no direct mechanical contact between the rotor and the Epic BT instrument, the magnetically levitated and rotated cylindrical stirrer bar slides smoothly on the surface of the cover plate, which altogether ensures minimal vibrations. The noise levels introduced by stirring were quantified before the experi- ments and found to be negligible. The variation in the measured wavelength was found to be around 0.2 pm without stirring but increased to around 1 pm during stirring (data is not shown).
Knowing that the expected signal arising from cell adhesion is in the range of 100 to 1000 pm, this introduced noise can be consid-
ered to be insignificant. This low noise level is also acceptable in cell signaling studies where the typical signals are in the 10 to 100 pm range[35–38].
3.2. Flow velocity profiles from numerical simulations
The results of the numerical simulation for typically employed magnetic stirrer bar rotation speeds are briefly summarized in Fig. 2. The cross-sectional flow velocity profile is shown in Fig. 2a, where the magnetic stirrer bar is also visible. Results showed that the stirrer bar’s rotation produces a rather constant flow velocity profile perpendicular to the sensor surface in a posi- tion close to the sensing interface. However, in the radial direction, the velocity changes more noticeably, as represented inFig. 2b, and c. At the center of the well, the velocity was found to be practically zero, and the flow velocity monotonically increased towards the walls until reaching its maximum value at around 7 mm radially from the center. After this peak, the velocity monotonically decreased until reaching the wall of the well. It is important to note that the rotation frequency does not affect the shape of the velocity profile plotted in the radial direction, only changes its maximum value. Increasing the rotation frequency from 1800 RPM to 2650 RPM resulted in a roughly 50% increase in the flow’s maximum velocity.
These results have several implications. First, employing the introduced arrangement, the velocity close to the sensing interface can be easily tuned between zero and a predefined maximum value in a highly controllable manner. Therefore, each sensor ele- ment at the bottom of the well may experience different flow velocities depending on its radial position inside the well. Second, the obtained flow velocity profile has circular symmetry, meaning that the same velocity is present at several sensing elements (4–8) positioned at the same radial distance in the well. These features are highly advantageous since cellular responses from multiple
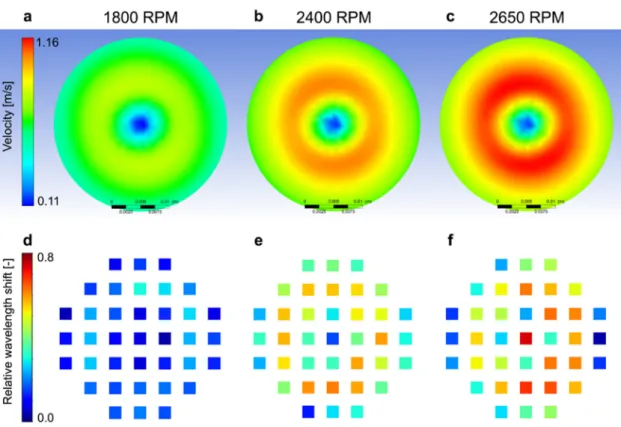
Fig. 5.Comparison of the label-free data (bottom row) with the numerical simulation (top row) for the different rotation frequencies. Top row: the simulation shows the velocity profile 25lm above the bottom surface. Bottom row: the spatial distribution of the 37 individual sensors’ data, measured at 60 min after the start of the stirring (cell detachment phase).
sensor elements exposed to the same velocity can be used for effective statistical analysis. Furthermore, cellular responses exposed to different velocities can be directly compared since all were obtained from the same well.
3.3. Cell adhesion and detachment under rotating flow
Initially, cell adhesion and detachment were examined using optical microscopy to illustrate the effect of rotating flow on living cells qualitatively. HeLa cells adhered to an RGD functionalized surface at the bottom of the circular well in assay buffer at room temperature for 100 min and were first imaged at various radial positions. Afterward, the rotating flow was switched on for 60 min at a rotation frequency of 1400 RPM, and the cells were imaged again at the same radial positions. Results showed that rotating flow caused a decrease in the number of adhered cells, which depends on location. We counted the cells on the before and after microscope images to quantify the cell loss without the use of biosensor data. Little cell loss was observed at the central position (15%) and at the 13.5 mm position (13%), the highest cell loss at the 9 mm position (30%) corresponds well with the calcu- lated flow profiles inFig. 2c(see Fig. 3.)
Second, we monitored cell adhesion and detachment process in real-time using an RWG biosensor. Cell adhesion was first moni- tored without a flow present inside the wells. Afterward, the well-spread cells were exposed to the rotating flow with various rotation frequencies. Results showed that cell adhesion resulted in a sigmoidal shaped signal on all 37 individual sensors in both wells (Fig. 4). This shape is a typical characteristic of active, living processes and was analyzed in detail earlier in the case of Hela cell adhesion on RGD functionalized surfaces [45–48]. Cell adhesion reached its maximum value after about 90 min. Furthermore, the rotating flow field resulted in an apparent decrease in the biosen- sor signals, the degree of which was dependent on the rotation speed and the location. The signal drops were the most substantial at the highest rotation speed, suggesting a clear connection between the cell detachment and the employed flow velocities.
To further clarify the correlation, two-dimensional heat maps were created (Fig. 5). The circular symmetric flow profiles from the numerical simulation were also plotted for comparison. Results showed that the biosensor response also displayed a circular sym- metry with a reasonable agreement with the flow profiles. To quantify this circular symmetry we calculated the coefficient of variation for each radial position (for further information see Sup- plementary Information (SI), Fig. S1). Of note, largest asymmetry was observed at the highest rotational frequency which could be caused by slightlyunstable flow presumably originating from tiny assembling errors. However, at this rotation frequency the flow velocity is higher than the physiological velocity so this instability won’t affect the applicability of the setup in cell biological research, but should be carefully considered in other applications. Simula- tion suggested that the flow velocities at 25
l
m above the bottom of the well were in the range of 0.11 to 1.16 m/s, while the label- free assay indicated the corresponding cell detachment percentage was between 2.5% and 70%.3.4. Critical velocity and rate of detachment
The connections between the measured relative wavelength shifts (corresponding to the ratio of detached cells), the exact radial positions of the sensors, and the flow velocities acting on the cells in these positions were analyzed in more detail, as presented in Fig. 6. As can be seen inFig. 6a, the shape of the relative wave- length shift profiles differs slightly from the simulated flow veloc- ity profiles of Fig. 2c. E.g., the observed peaks in the measured profiles are shifted 1–2 mm towards the wall of the well compared
to the simulation profiles (peak positions at 9 mm and 7 mm, respectively). To visualize this we plotted the simulation and the measurement data onto each other for each RPMs (see SI, Fig. S2). Note that the datapoints inFig. 6a are averaged for the Fig. 6.a) The average relative wavelength shift plotted with the standard deviation obtained from 4 to 8 parallel measurements, which corresponds to the ratio of cells detached from the sensor surface, in the function of the radial positions of the sensor elements from the center of the well. b) The same cell detachment ratio in the function of the actual velocities obtained from numerical simulations. c) The cell detachment ratio from the 1800 RPM measurement in the function of the velocity and the fitted linear function: y¼ð1:06 0:09Þxþ 0:53ð 0:06Þwith R2¼ 0:962. The critical flow velocity needed to detach the cells from the biomimetic interface is also highlighted inFig. 6c (cc. 0.5 m/s).
sensor elements in the same radial positions and that they each have surface areas of 4 mm2. In order to minimize the error origi- nating from this difference, the measured profiles were separately fitted with polynomial functions and were scaled with the maxi- mum simulated flow velocities (based onFig. 2c) corresponding to each rotation frequency. The resulting relative signal response in function of the velocities acting on the sensors elements is plot- ted inFig. 6b.
By comparing the relative cell detachment ratio with the actual flow velocities, a linear trend can be observed in the investigated velocity range (see Fig. 6b). A linear function of y¼ð1:06 0:09Þxþ ð 0:530:06Þ, was fitted on the lowest velocity range (at a rotation frequency of 1800 RPM) with R2¼ 0:962 to determine the critical velocity where cells start to detach from the surface. The linear fit resulted in a critical velocity of cc. 0.5 m/s (Fig. 6c).
Fig. 7.a) The relative wavelength shift corresponding to cell detachment from 3 sensors of the 2650 RPM experiment, plotted together with the fitted exponential functions from Eq.(1). Note, the employed model fits the data perfectly. b) The detachment rates from the exponential fits of the 2650 RPM measurement data in the function of flow velocity. The continuous line represents the fit of Eq.(2)to the plotted data set.
Fig. 8.Photo of the modified measurement setup with inlet and outlet ports a) without and b) with the assembled rotor and cover plate. c) A schematic illustration of the setup with the inlet/outlet ports d) Biosensor data of cell adhesion and detachment of three sensors, obtained at different positions inside the well: blue: 14.23, orange: 13.5, green 9 mm position from the center corresponding to 0.69, 0.73 and 0.96 m/s flow velocities. Cells were added to adhere at 25 min. The first dotted vertical line marks the start of the rotation, while the second marks the administration of the reagent, which was 10X trypsin-EDTA solution. (For interpretation of the references to color in this figure legend, the reader is referred to the web version of this article.)
We also calculated the force corresponding to the obtained crit- ical velocity based on the attached HeLa cells’ height (5mm), area (~1000
l
m) and the dynamic viscosity of room temperature water [40,49]. This fluid-induced force, 910 nN, reasonably agreed with the detachment forces measured with FluidFM BOT on the same surface and the same type of cells (HeLa cells), 690 nN, which fur- ther confirms our results considering the critical velocity where cells start to detach[40].It should be emphasized that the linear approximation employed inFig. 6c is the simplest possible model to describe cell detachment under flow conditions and fit our experimental data.
More sophisticated models can also be found in the literature, allowing cell detachment at zero flow velocity and giving closed- form solutions for the rate of detachment in the function of hydro- dynamic stress[50,51]. The data set obtained from our measure- ments are perfectly suited to test such models.
To this end, we determined the cells’ detachment rates based on the normalized biosensor signals and the following equation:
A tð Þ ¼A1þð1A1Þert; ð1Þ
whereA tð Þis the biosensor signal (proportional to the area cov- ered by the cells), A1is the remaining coverage after infinite detachment time, andr is the detachment rate[50]. In order to obtain the detachment rate at a given flow velocity, we fitted the time-dependent biosensor signals recorded in the cell detachment phases (seeFig. 4) by using Eq.(1). The corresponding results are shown inFig. 7a for free different flow velocities to demonstrate the methodology.
Next, we plotted the obtained detachment rates in the function of velocity in the case of the 2650 RPM measurement and fitted the data with Eq.(2)to determine the intrinsic detachment rate con- stant,r0¼0:00180:0013min1, and the reference velocity that scales the effect of applied velocity on the detachment rate con- stant,
v
0¼0:020:01 ms1.[51] Eq. (2) is based on a peeling model used to describe cell detachment, where it described how a cell adhering on a solid substrate and submitted to a steady shear flow stress would detach[52].rð Þ ¼
v
r0expffiffiffiffiffiffi
4vv0
q
4vv0
1=4 : ð2Þ
It should be pointed out that the detachment rate increases with the velocity, as expected. Note that the original equation was developed for shear stress, we assumed a linear correlation between the flow velocity and the hydrodinamic stress based on experimental evidence and the following equation:
s
¼l
@u@y; ð3Þwhere
s
is the wall shear,u yð Þis the velocity profile,yis the off- wall coordinate (y¼0 is the wall surface) andl
is dynamic viscos- ity, to express the equation for velocity[53].3.5. Cellular response upon chemical stimulation under rotating flow Next, we examined the ability to perform cellular assays upon chemical stimulation under rotating flow conditions. To do so, an additional chamber with integrated inlets and outlets was designed and used. The schematic picture and photographs of Fig. 8a-c illustrate this modified setup. By incorporating a septum injection port at the inlet of the chamber, we were able to inject 100
l
L 10X trypsin-EDTA solution (0.5% trypsin, 0.2% EDTA) over the adhered cells 45 min after the stirring started with a rotation frequency of 2400 RPM without disturbing the flow. In this way,the cells were already exposed to the mechanical stimulus from the rotating flow when the trypsin exerted its chemical effect. This resulted in a further drop in the sensors’ signal corresponding to increased cell detachment, as demonstrated for three individual sensors inFig. 8d. The relative cell detachment before the admin- istration of the trypsin solution for the three individual sensors, shown inFig. 8d, were found to be around 0.33, 0.44 and 0.64 with the corresponding velocities being 0.69, 0.73 and 0.96 m/s, which was in full agreement with our abovementioned results (see Fig. 6b,Fig. 4). The injected trypsin caused a 26% further drop in the signal only a few minutes after its injection with smaller flow velocities. On the sensor with the highest flow velocity, around 0.96 m/s, the additional signal drop was only 19%. Presumably, this difference can be attributed to the relatively large flow velocity, which already caused cell detachment as well as weakened cell adhesion strength. It is important to emphasize that our novel arrangement enabled the possibility of the simultaneous mechan- ical and chemical stimuli of the cells without pausing the experi- ment or perturbing the flow profile in any way.
4. Conclusions
A novel high-throughput method was presented to study cell adhesion and detachmentin vitrounder varied flow velocities over an array of label-free RWG biosensors. The main advantage of the proposed setup over the widely used laminar flow systems[20–22]
is that many parallel measurements can be performed simultane- ously at the same predefined flow conditions. Compared to the cone and plate device[23–26], which also uses rotating flow fields to stimulate cells, but provides only end-point data, our setup yields real-time, high-resolution and noise-free kinetics about the cell attachment-detachment processes. Both numerical simula- tions and experimental data proved the circular symmetric nature of the flow field inside our device. In future works it would be advantageous to measure the velocity profile over the sensing units more directly. The discussed detachment experiments with the living cells could be considered as a possible solution to exper- imentally estimate the flow field, but several other methods are also available which could be adapted in future works. These include the introduction of micron-scale particles and the mapping of their movement using dark field or conventional microscopies [54,55]. Ultrasound velocimetry [56,57] and laser Doppler velocimetry[58,59]are also excellent candidates to be considered in more advanced setups. Another interesting possibility is the application of freestanding membranes or tiny cantilevers to directly measure the flow at the bottom surface of the wells[60–
62]. The signals obtained on an array of label-free RWG biosensors inside this field, supported by optical microscope revealed that cell detachment from the RGD functionalized surface has a linear rela- tionship with the flow velocity. Based on this, the force corre- sponding to the critical velocity, where cells start to detach from the surface was calculated, and found to be in good agreement with previous results of direct force measuring techniques[40].
Moreover, the detachment rates, intrinsic detachment rate con- stant, and reference velocitycould be determined even from a sin- gle experiment. These results underline the advantages of our novel measurement setup in obtaining a large amount of data at various flow conditions in a fast and parallel way. This innovative approach can be used to study endothelial cells under controlled and well-defined flow conditions. Although in this work a cell- based biological model was used to demonstrate the advantages and applicability of our measurement setup, it is important to note that its application can also be beneficial to investigate the surface behavior of biomolecules and colloids in a high-resolution, real-time and high-throughput manner, combined with other
well-established surface sensitive methods, like quartz crystal microbalance[28], electric cell-substrate impedance spectroscopy [29], or surface plasmon resonance[30].
CRediT authorship contribution statement
Kinga Dóra Kovács:Formal analysis, Investigation, Writing - original draft, Visualization. Martin Novák: Writing - original draft. Zoltán Hajnal: Supervision. Csaba H}os:Writing - original draft, Supervision.Bálint Szabó:Writing - review & editing.Inna Székács:Resources, Writing - review & editing.Ye Fang:Discus- sions, Writing - review & editing.Attila Bonyár:Conceptualization, Writing - original draft, Visualization, Supervision. Robert Horvath:Conceptualization, Writing - original draft, Supervision, Project administration, Funding acquisition.
Declaration of Competing Interest
The authors declare that they have no known competing finan- cial interests or personal relationships that could have appeared to influence the work reported in this paper.
Acknowledgments
This work was supported by the ‘‘Lendület” (HAS) research pro- gram, the National Research, Development and Innovation Office of Hungary (KKP_19 and KH grants). The research reported in this paper was partially supported by the NRDI Fund (TKP2020 IES, Grant No. BME-IE-BIO) based on the charter of bolster issued by the NRDI Office under the auspices of the Ministry for Innovation and Technology. The mechnaical engineering work of Béla Plósz is greatfully acknowledged, too.
Appendix A. Supplementary material
Supplementary data to this article can be found online at https://doi.org/10.1016/j.jcis.2021.04.091.
References
[1] N.L. Filippova, Adsorption kinetics of polyelectrolytes on planar surfaces under flow conditions, J. Colloid Interface Sci. (1999), https://doi.org/10.1006/
jcis.1998.6018.
[2] R. Graziano et al., The microstructure of Carbopol in water under static and flow conditions and its effect on the yield stress, J. Colloid Interface Sci. 582 (2021) 1067–1074,https://doi.org/10.1016/j.jcis.2020.09.003.
[3] J.W. Cleaver, B. Yates, Mechanism of detachment of colloidal particles from a flat substrate in a turbulent flow, J. Colloid Interface Sci. (1973),https://doi.org/
10.1016/0021-9797(73)90323-8.
[4] A.A. Potanin, On the computer simulation of the deformation and breakup of colloidal aggregates in shear flow, J. Colloid Interface Sci. (1993),https://doi.
org/10.1006/jcis.1993.1202.
[5] J.M. Meinders, H.C. van der Mei, H.J. Busscher, Deposition efficiency and reversibility of bacterial adhesion under flow, J. Colloid Interface Sci. (1995), https://doi.org/10.1006/jcis.1995.9960.
[6] J.J. Lee, G.G. Fuller, Adsorption and desorption of flexible polymer chains in flowing systems, J. Colloid Interface Sci. (1985),https://doi.org/10.1016/0021- 9797(85)90132-8.
[7] L. Song, M. Elimelech, Particle deposition onto a permeable surface in laminar flow, J. Colloid Interface Sci. (1995),https://doi.org/10.1006/jcis.1995.1310.
[8] B.C. Borro et al., Microfluidics-based self-assembly of peptide-loaded microgels: Effect of three dimensional (3D) printed micromixer design, J.
Colloid Interface Sci. 538 (2019) 559–568, https://doi.org/10.1016/j.
jcis.2018.12.010.
[9]N.A. Pawlowski, E.L. Abraham, S. Pontier, W.A. Scott, Z.A. Cohn, Human monocyte-endothelial cell interaction in vitro, Proc. Natl. Acad. Sci. U. S. A. 82 (1985) 8208–8212.
[10] O. Spertini, F.W. Luscinskas, M.A. Gimbrone, T.F. Tedder, Monocyte attachment to activated human vascular endothelium in vitro is mediated by leukocyte adhesion molecule-1 (dselectin) under nonstatic conditions, J. Exp. Med.
(1992),https://doi.org/10.1084/jem.175.6.1789.
[11] S.P. Olesen, D.E. Claphamt, P.F. Davies, Haemodynamic shear stress activates a K+ current in vascular endothelial cells, Nature (1988), https://doi.org/
10.1038/331168a0.
[12] A. Spencer, A.B. Baker, High throughput label free measurement of cancer cell adhesion kinetics under hemodynamic flow, Sci. Rep. (2016),https://doi.org/
10.1038/srep19854.
[13] M.A. Swartz, The physiology of the lymphatic system, Adv. Drug Deliv. Rev.
(2001),https://doi.org/10.1016/S0169-409X(01)00150-8.
[14] K.N. Margaris, R.A. Black, Modelling the lymphatic system: Challenges and opportunities, J. Royal Soc. Interface (2012), https://doi.org/10.1098/
rsif.2011.0751.
[15] M.J. Feito et al., In vitro evaluation of graphene oxide nanosheets on immune function, J. Colloid Interface Sci. 432 (2014) 221–228,https://doi.org/10.1016/
j.jcis.2014.07.004.
[16] M.C. Matesanz et al., Early in vitro response of macrophages and T lymphocytes to nanocrystalline hydroxyapatites, J. Colloid Interface Sci. 416 (2014) 59–66,https://doi.org/10.1016/j.jcis.2013.10.045.
[17] C. Blatter et al., In vivo label-free measurement of lymph flow velocity and volumetric flow rates using Doppler optical coherence tomography, Sci. Rep.
(2016),https://doi.org/10.1038/srep29035.
[18] B.J. Ballermann, A. Dardik, E. Eng, A. Liu, Shear stress and the endothelium, in:
Kidney International, Supplement, 1998. doi: 10.1046/j.1523- 1755.1998.06720.x.
[19]A.G. Koutsiaris et al., Volume flow and wall shear stress quantification in the human conjunctival capillaries and post-capillary venules in vivo, Biorheology (2007).
[20] M.J. Levesque, R.M. Nerem, The elongation and orientation of cultured endothelial cells in response to shear stress, J. Biomech. Eng. (1985),https://
doi.org/10.1115/1.3138567.
[21]Y.S. Zhang, A. Sevilla, L.Q. Wan, I.R. Lemischka, G. Vunjak-Novakovic, Patterning pluripotency in embryonic stem cells, Stem Cells 31 (2013) 1806–1815.
[22] S.H. Kim, W. Chegal, J. Doh, H.M. Cho, D.W. Moon, Study of cell-matrix adhesion dynamics using surface plasmon resonance imaging ellipsometry, Biophys. J. (2011),https://doi.org/10.1016/j.bpj.2011.01.033.
[23] C.F. Dewey, S.R. Bussolari, M.A. Gimbrone, P.F. Davies, The dynamic response of vascular endothelial cells to fluid shear stress, J. Biomech. Eng. (1981),https://
doi.org/10.1115/1.3138276.
[24] M. Yoshizumi et al., Hemodynamic shear stress stimulates endothelin production by cultured endothelial cells, Biochem. Biophys. Res. Commun.
(1989),https://doi.org/10.1016/0006-291X(89)92679-X.
[25]S. Dimmeler, J. Haendeler, V. Rippmann, M. Nehls, A.M. Zeiher, Shear stress inhibits apoptosis of human endothelial cells, FEBS Lett. 399 (1996) 71–74.
[26] T. Nagel, N. Resnick, W.J. Atkinson, C.F. Dewey, M.A. Gimbrone, Shear stress selectively upregulates intercellular adhesion molecule-1 expression in cultured human vascular endothelial cells, J. Clin. Invest. (1994),https://doi.
org/10.1172/jci117410.
[27] Y. Fang, A.M. Ferrie, N.H. Fontaine, J. Mauro, J. Balakrishnan, Resonant waveguide grating biosensor for living cell sensing, Biophys. J. (2006), https://doi.org/10.1529/biophysj.105.077818.
[28] C.K. O’Sullivan, G.G. Guilbault, Commercial quartz crystal microbalances - theory and applications, Biosens. Bioelectron. (1999),https://doi.org/10.1016/
S0956-5663(99)00040-8.
[29] J. Wegener, C.R. Keese, I. Giaever, Electric cell-substrate impedance sensing (ECIS) as a noninvasive means to monitor the kinetics of cell spreading to artificial surfaces, Exp. Cell Res. (2000), https://doi.org/10.1006/
excr.2000.4919.
[30] J. Homola, Present and future of surface plasmon resonance biosensors, Anal.
Bioanal. Chem. (2003),https://doi.org/10.1007/s00216-003-2101-0.
[31] B. Peter et al., Label-free in situ optical monitoring of the adsorption of oppositely charged metal nanoparticles, Langmuir (2014), https://doi.org/
10.1021/la5029405.
[32] Y. Fang, Resonant waveguide grating biosensor for microarrays, in: 27–42 (2010). doi: 10.1007/978-3-642-02827-4_2.
[33] R. Wang, J. Wang, Y. Liu, X. Zhang, X. Liang, Resonant waveguide grating based assays for colloidal aggregate detection and promiscuity characterization in natural products, RSC Adv. (2019),https://doi.org/10.1039/c9ra06466d.
[34] J.J. Ramsden, R. Horvath, Optical biosensors for cell adhesion, J. Recept. Signal Transduction (2009),https://doi.org/10.1080/10799890903064119.
[35] I. Kurucz et al., Label-free optical biosensor for on-line monitoring the integrated response of human B cells upon the engagement of stimulatory and inhibitory immune receptors, Sens. Actuators, B Chem. (2017),https://doi.
org/10.1016/j.snb.2016.09.015.
[36] Y. Fang, Label-free cell-based assays with optical biosensors in drug discovery, Assay Drug Develop. Technol. (2006),https://doi.org/10.1089/adt.2006.4.583.
[37] R. Schröder et al., Deconvolution of complex G protein-coupled receptor signaling in live cells using dynamic mass redistribution measurements, Nat.
Biotechnol. (2010),https://doi.org/10.1038/nbt.1671.
[38] C.M. Henstridge et al., GPR55 ligands promote receptor coupling to multiple signalling pathways, Br. J. Pharmacol. (2010),https://doi.org/10.1111/j.1476- 5381.2009.00625.x.
[39] B. Peter et al., Interaction of positively charged gold nanoparticles with cancer cells monitored by an in situ label-free optical biosensor and transmission electron microscopy, ACS Appl. Mater. Interfaces (2018), https://doi.org/
10.1021/acsami.8b01546.
[40] M. Sztilkovics et al., Single-cell adhesion force kinetics of cell populations from combined label-free optical biosensor and robotic fluidic force microscopy, Sci.
Rep. (2020),https://doi.org/10.1038/s41598-019-56898-7.
[41] C. Hirsch, Numerical computation of internal and external flows: the fundamentals of computational fluid dynamics, Numer. Comput. Internal External Flows: Fundam. Comput. Fluid Dynamics (2007),https://doi.org/
10.1016/B978-0-7506-6594-0.X5037-1.
[42] C.L. Navier, Mémoire sur les lois du mouvement des fluids, Mémoires l’Académie des Sci. l’Institut Fr (1823).
[43] U. La¯cis, Y. Sudhakar, S. Pasche, S. Bagheri, Transfer of mass and momentum at rough and porous surfaces. (2018). doi: 10.1017/jfm.2019.897.
[44] S.J. Bolaños, B. Vernescu, Derivation of the Navier slip and slip length for viscous flows over a rough boundary, Phys. Fluids (2017),https://doi.org/
10.1063/1.4982899.
[45] N. Orgovan et al., Dependence of cancer cell adhesion kinetics on integrin ligand surface density measured by a high-throughput label-free resonant waveguide grating biosensor, Sci. Rep. (2014), https://doi.org/10.1038/
srep04034.
[46] I. Szekacs et al., Integrin targeting of glyphosate and its cell adhesion modulation effects on osteoblastic MC3T3-E1 cells revealed by label-free optical biosensing, Sci. Rep. (2018), https://doi.org/10.1038/s41598-018- 36081-0.
[47] B. Peter et al., High-resolution adhesion kinetics of EGCG-exposed tumor cells on biomimetic interfaces: comparative monitoring of cell viability using label- free biosensor and classic end-point assays, ACS Omega (2018),https://doi.
org/10.1021/acsomega.7b01902.
[48] I. Szekacs, N. Orgovan, B. Peter, B. Kovacs, R. Horvath, Receptor specific adhesion assay for the quantification of integrin–ligand interactions in intact cells using a microplate based, label-free optical biosensor, Sens. Actuators, B Chem. (2018),https://doi.org/10.1016/j.snb.2017.09.208.
[49] D. Guan, E. Charlaix, R.Z. Qi, P. Tong, Noncontact viscoelastic imaging of living cells using a long-needle atomic force microscope with dual-frequency modulation, Phys. Rev. Appl. (2017), https://doi.org/10.1103/
PhysRevApplied.8.044010.
[50] A.M. Jötten et al., Correlation of in vitro cell adhesion, local shear flow and cell density, RSC Adv. (2019),https://doi.org/10.1039/c8ra07416j.
[51] E. Décavé, D. Garrivier, Y. Bréchet, B. Fourcade, F. Bruckert, Shear flow-induced detachment kinetics of Dictyostelium discoideum cells from solid substrate, Biophys. J. (2002),https://doi.org/10.1016/S0006-3495(02)75583-5.
[52] E. Décavé, D. Garrivier, Y. Bréchet, F. Bruckert, B. Fourcade, Peeling process in living cell movement under shear flow, Phys. Rev. Lett. (2002),https://doi.org/
10.1103/PhysRevLett.89.108101.
[53] J. Rohr, M.I. Latz, S. Fallon, J.C. Nauen, E. Hendricks, Experimental approaches towards interpreting dolphin-stimulated bioluminescence, J. Exp. Biol. (1998).
[54] F. Xiao, K.M. Lam, X.yan, Li Investigation and visualization of internal flow through particle aggregates and microbial flocs using particle image velocimetry, J. Colloid Interface Sci. 397 (2013) 163–168,https://doi.org/10.
1016/j.jcis.2013.01.053.
[55] M. Shiraishi et al., Development of dark-field dynamic light scattering microscopy and its application: tracking dynamics of particles in condensed slurries spreading on planar/nonplanar substrates, J. Colloid Interface Sci. 584 (2021) 723–728,https://doi.org/10.1016/j.jcis.2020.09.095.
[56] C. Poelma et al., Ultrasound imaging velocimetry: toward reliable wall shear stress measurements, Eur. J. Mech. B/Fluids (2012),https://doi.org/10.1016/j.
euromechflu.2012.03.003.
[57] C. Poelma, Ultrasound imaging velocimetry: a review, Exp. Fluids (2017), https://doi.org/10.1007/s00348-016-2283-9.
[58] C.P. Wang, Laser doppler velocimetry, J. Quant. Spectrosc. Radiat. Transf.
(1988),https://doi.org/10.1016/0022-4073(88)90122-7.
[59] W.K. George, J.L. Lumley, The laser-Doppler velocimeter and its application to the measurement of turbulence, J. Fluid Mech. (1973),https://doi.org/10.1017/
S0022112073000194.
[60] M.H. Zarifi, H. Sadabadi, S.H. Hejazi, M. Daneshmand, A. Sanati-Nezhad, Noncontact and nonintrusive microwave-microfluidic flow sensor for energy and biomedical engineering, Sci. Rep. (2018),https://doi.org/10.1038/s41598- 017-18621-2.
[61] M.S. Cheri et al., Real-time measurement of flow rate in microfluidic devices using a cantilever-based optofluidic sensor, Analyst (2013),https://doi.org/
10.1039/c3an01588b.
[62] H. Naveen, S. Narasimhan, B. George, A.K. Tangirala, Design and development of a low-cost cantilever-based flow sensor, IFAC-PapersOnLine (2020),https://
doi.org/10.1016/j.ifacol.2020.06.019.