Article
Spatial and Temporal Changes in Infiltration and Aggregate Stability: A Case Study of a Subhumid Irrigated Cropland
Gergely Jakab1,2,3,* , Endre Dobos2, Balázs Madarász1,4 , Zoltán Szalai1,3and Judit Alexandra Szabó1
1 Geographical Institute, Research Centre for Astronomy and Earth Sciences, MTA, 1112 Budapest, Hungary;
madarasz.balazs@csfk.mta.hu (B.M.); szalai.zoltan@csfk.mta.hu (Z.S.); szabo.judit@csfk.mta.hu (J.A.S.)
2 Institute of Geography and Geoinformatics, University of Miskolc; 3515 Miskolc, Hungary;
ecodobos@uni-miskolc.hu
3 Department of Environmental and Landscape Geography, ELTE University, 1117 Budapest, Hungary
4 Department of Soil Science and Water Management, Faculty of Horticultural Science, Szent István University, 1118 Budapest, Hungary
* Correspondence: jakab.gergely@csfk.mta.hu; Tel.:+36-130-926-28
Received: 1 April 2019; Accepted: 24 April 2019; Published: 26 April 2019
Abstract:Climate change is increasing the occurrence of extreme precipitation events and causing irregular precipitation patterns. This occurs in parallel with the degradation of crop fields, and triggers the occurrence of pluvial floods and droughts on the same field. Consequently, irrigation must be adapted to the changing soil properties. Detailed spatial and temporal measurements of changes in infiltration are required. This study aimed to quantify changes in infiltration for a subhumid irrigated cropland with various soil types (Phaeozem, Solonetz, Chernozem) and field conditions (seedbed and stubble) by simulating rainfall. As the soil structure determines hydrology, the aggregate stability/surface roughness was tested as a proxy of infiltration through photogrammetry. The soil losses caused by precipitation did not exhibit connections to changes in the surface roughness, and lower aggregate stability did not necessarily cause lower infiltration intensities, suggesting that sedimentation could only partly seal drainage pores. The final infiltration intensities varied within a wide range (0.2–28.4 mm h−1). Seedbed preparation did not increase the volume of micropores (<10µm), which resulted in higher infiltration under stubble. Photogrammetry was found to be a potentially useful tool for measuring aggregate stability, however, further investigations on in situ soil surfaces are required for technical improvement.
Keywords: rainfall simulation; surface roughness; irrigated crop field; photogrammetry
1. Introduction
Intensive horticulture and agriculture that are traditionally based on cultivation can considerably degrade soil structure [1,2]. Poor soil structure results in the rapid breakdown of aggregates, which mitigates the porosity of the uppermost soil layer [3]. In addition, canopy cover is often rare or even missing on crop fields depending on various agrotechniques used [4]. Aggregate breakdown accelerates due to splash erosion and inhibits water infiltration [5]. Moreover, the temporal pattern of rainfall has changed, and the occurrence of extreme precipitation events has increased in most parts of the world [6]. On hummocky landscapes, surface runofferodes the most fertile part of the soil, forms gullies, fills reservoirs, and transports nutrients and pollutants to surface and subsurface water bodies [7]. Furthermore, runofffrom crop fields is responsible for flash floods that often directly damage infrastructure [8]. On non-sloping landscapes, excess water can trigger pluvial flooding and
Water2019,11, 876; doi:10.3390/w11050876 www.mdpi.com/journal/water
hinder the application of agrotechniques to crop fields [9,10]. This water loss indicates an increase in moisture deficiency during the growing season under mesic conditions. Irrigation is often introduced to reduce the effect of climate change and ensure stable crop production [11]. However, despite its beneficial effects, irrigation can also degrade the soil structure and results in pluvial flooding or erosion [12]. Sprinkler irrigation is presumed to be less dangerous than furrow irrigation in terms of soil structure conservation. On considerable parts of the Hungarian Grate Plain sprinkler irrigation is used on crop fields in order to increase food security
Infiltration is a key parameter of crop fields, although it is difficult to quantify. The actual infiltration volumes change over time as tillage operations affect the composition of aggregates and soil porosity [13], and in space, as soil properties vary due to erosion or hydromorphic pedogenesis [14].
Moreover, the initial moisture content, surface roughness, and precipitation intensity can affect the actual infiltration volume [15]. Accordingly, infiltration measurements from crop fields are necessary to obtain more information for model development. Theoretically, smart technologies can change the amount and intensity of artificial precipitation in space, depending on the current soil properties, such as infiltration. In practice, further measurements for calibration and validation are required to ensure successful and stable application [16].
One of the best methods of estimating infiltration is using rainfall simulators [17,18], which produce quasi-natural precipitation drop spectra, while the intensity and kinetic energy of the drops are adjustable [19] and measurements are collected for a larger area, considering the soil heterogeneity and in situ soil biology as driving forces [20]. Another advantage is the possibility of measuring or setting the morphological parameters of the slope, initial moisture content, or surface roughness to simplify the system [21].
Surface roughness is a key property affecting water retention and infiltration, although it is often difficult to measure [22]. In crop fields, surface roughness is determined by the employed tillage operations, which increase roughness, and precipitation-related processes, which decrease surface roughness [23]. Therefore, surface roughness varies widely during the growing season. The general trend is a decreasing range in elevation from decimeter, created by plowing or wheel tracks, to millimeter scales, determined by splash erosion, crusting, and aggregate breakdown [24], which is strongly correlated with sealing and crusting, and also plays an important role in the loss of soil organic carbon [25].
Close-range digital photogrammetry is a well-known and widely used remote sensing method that allows the user to survey the soil surface through digital elevation models (DEMs) [26]. Along with the increasing availability of high-resolution cameras and computers with a high process capacity, photogrammetry-based DEMs have become widespread in several scientific fields [27]. By applying this method, surface roughness can be estimated without causing surface disturbance when collecting mechanical measurements using a pin board or chain, or requiring high investment, such as that required when using a laser scanner [28]. This method is generally used for large areas [29] in combination with unmanned aerial vehicles [30], however, it is also suitable for small-scale scientific purposes [31–34]. The disadvantage of this method is that it is only suitable for bare surfaces. A crucial question is determining which model should be used for DEM calculation. Developers have provided various solutions, however, the applicability of these tools for such scientific purposes has not yet been fully discussed. In theory, comparing repeated DEMs for the same surface should allow changes in aggregate breakdown due to artificial rainfall to be quantified.
The aim of this study is to model the effects of sprinkler irrigation on soil infiltration and aggregate stability on the same in situ crop field. The following hypotheses are tested: (i) pedological heterogeneity results in high spatial infiltration variability, (ii) the infiltration intensity changes during the growing season, and (iii) the final infiltration intensity is correlated with aggregate stability, which can be predicted by photogrammetry.
2. Materials and Methods
2.1. The Study Site
The studied arable field is located in the middle of the Great Hungarian Plain, where micro-topography is an important soil formation driver. The field is 105 ha at an elevation of 88–92 m above sea level. In the higher parts of the field, loess-derived Chernozems are predominant, while the soils of the lower surfaces mainly contain hydromorphic soils, such as Phaeozems and Solonetz according to the Word Reference Base. The mean annual precipitation and temperature are 540 mm and 9.8◦C, respectively [35]. Intensive cultivation with continuous plowing occurs in the field;
hence, the soil structure is highly degraded and the field contains a compact plow pan [36]. As the investigation focuses on irrigation and its result on soil structure, only the uppermost cultivated layer was measured during sampling. Based on the spatial soil heterogeneity of the field [36], three different topsoils were select to measure the in situ water infiltration and estimate the hydrological properties of the field (Figure1). The measured soil types differ in their texture and chemical properties, hence, their soil type analogies were identified according to the World Reference Base [37] (Table1). Therefore, the three replicates are (Phaeozem (47.509693 N; 21.271736 E); Solonetz (47.508995 N; 21.273058 E);
Chernozem (47.504360 N; 21.277486 E). The first measurement was collected on 8 May 2018 under recently sown sweet corn (Syngenta GSS3071), while soil surface was recently tilled (shallow disking) and bare without any canopy cover. The second measurement was collected on 10 July 2018 after harvest, under stubble conditions, again without any canopy cover. During the growing period, two mechanical weed controls were done (at four and at eight leaves phenophase) with shallow cultivator.
As natural precipitation amount exceeded 310 mm in total, no irrigation was used.
Water 2019, 11, x FOR PEER REVIEW 3 of 12
The studied arable field is located in the middle of the Great Hungarian Plain, where micro- topography is an important soil formation driver. The field is 105 ha at an elevation of 88–92 m above sea level. In the higher parts of the field, loess-derived Chernozems are predominant, while the soils of the lower surfaces mainly contain hydromorphic soils, such as Phaeozems and Solonetz according to the Word Reference Base. The mean annual precipitation and temperature are 540 mm and 9.8 °C, respectively [35]. Intensive cultivation with continuous plowing occurs in the field; hence, the soil structure is highly degraded and the field contains a compact plow pan [36]. As the investigation focuses on irrigation and its result on soil structure, only the uppermost cultivated layer was measured during sampling. Based on the spatial soil heterogeneity of the field [36], three different topsoils were select to measure the in situ water infiltration and estimate the hydrological properties of the field (Figure 1). The measured soil types differ in their texture and chemical properties, hence, their soil type analogies were identified according to the World Reference Base [37] (Table 1).
Therefore, the three replicates are (Phaeozem (47.509693 N; 21.271736 E); Solonetz (47.508995 N;
21.273058 E); Chernozem (47.504360 N; 21.277486 E). The first measurement was collected on 8 May 2018 under recently sown sweet corn (Syngenta GSS3071), while soil surface was recently tilled (shallow disking) and bare without any canopy cover. The second measurement was collected on 10 July 2018 after harvest, under stubble conditions, again without any canopy cover. During the growing period, two mechanical weed controls were done (at four and at eight leaves phenophase) with shallow cultivator. As natural precipitation amount exceeded 310 mm in total, no irrigation was used.
Figure 1. Location of the study area with elevation lines (m above sea level) and the investigated soil spots. The arrow indicates the slope direction (Google maps). Main soil types (a) Chernozem; (b) Solonetz; (c) Phaeozem.
Table 1. Main properties of the investigated topsoils. SOM: soil organic matter. The particle size classes are in µm.
Depth pHKCl Ca CaCO3 Salt Content SOM P2O5 K2O Na Sand Silt Clay cm m/m % mg/kg 50< 50–2 <2 Solonetz 0–30 6.68 0.23 0.57 0.086 2.51 138 196 300< 39.5 26.8 33.7 Phaeozem 0–30 7.23 0.46 1.15 0.048 2.36 284 320 300< 33.2 34.5 32.3 Chernozem 0–30 7.04 0.44 1.13 0.054 3.49 582 298 106 30.3 24.7 44.9
2.2. Measurements on Soil Porosity
Figure 1. Location of the study area with elevation lines (m above sea level) and the investigated soil spots. The arrow indicates the slope direction (Google maps). Main soil types (a) Chernozem;
(b) Solonetz; (c) Phaeozem.
Table 1.Main properties of the investigated topsoils. SOM: soil organic matter. The particle size classes are inµm.
Depth pHKCl Ca CaCO3 Salt Content SOM P2O5 K2O Na Sand Silt Clay
cm m/m % mg/kg 50< 50–2 <2
Solonetz 0–30 6.68 0.23 0.57 0.086 2.51 138 196 300< 39.5 26.8 33.7
Phaeozem 0–30 7.23 0.46 1.15 0.048 2.36 284 320 300< 33.2 34.5 32.3
Chernozem 0–30 7.04 0.44 1.13 0.054 3.49 582 298 106 30.3 24.7 44.9
2.2. Measurements on Soil Porosity
The porosity of the uppermost cultivated soil layer was measured by collecting 100-cm3 undisturbed samples, with three replicates per sample. The initial moisture content, bulk density, and differentiated porosity values were measured following the gravimetric method [38]. The results were tested by conducting a one-way ANOVA with a post-hoc Tukey test and presented as boxplots using IBM SPSS Statistics for Windows, (version 22, IBM Corp., Armonk, NY, USA).
2.3. Rainfall Simulation
A Meersmans’s rainfall simulator was used to collect the in situ infiltration measurements.
The device was developed and constructed at Catholic University of Leuven [39]. We used a Lechler 460.788 full cone nozzle, which should provide a continuous rainfall intensity of 45 mm h−1under a pressure of 0.2 bar. The formed drop spectrum and kinetic energy agree with those of natural rainfall with a similar intensity [40]. The investigated soil surface is a rectangle of approximately 0.5 m2, fenced by aluminum sheets. To avoid border effects, the irrigated area was approximately 2.5 m2[19].
The plot locations were randomly selected. The real precipitation amount and intensity were measured using plastic vessels placed next to the plot and analyzed against the theoretical values [19]. The total amount of runoffwas continuously measured and collected parallel with time. The sediment yield was determined in the laboratory by evaporating the whole amount of runoffdivided to 6–10 intervals per precipitation.
2.4. Calculation of Hydrological Properties
The separate runoffvolumes were plotted as a function of time. As the precipitation intensity was constant, in the final stage of the measurement, the runoffintensity became constant, which was determined by fitting a linear function to the final 6–10 measured data points. The steepness of the fitted function was equal to the final runoffintensity [5]. As evaporation was set to negligible under the applied circumstances and the surface storage capacity was constant, the final infiltration intensity was calculated as the difference between precipitation intensity and apparent runoffintensity.
2.5. Estimating Surface Roughness Changes
As the investigated plots were flat, the surface water storage capacity was taken as a proxy of surface roughness, and was calculated as the difference between the beginning of runoffand appearance of excess water in seconds. A longer period indicates a higher surface roughness. The soil surface roughness was also estimated by photogrammetry. High-resolution (10 MP) photos (25–30) of the plot surface were captured from 360◦aspects just before and after the precipitation. The images were compiled into a digital elevation model (DEM) using the PhotoScan image processing software (Agisoft, Russia). The horizontal and vertical resolutions of the created DEMs were 3 mm. The elevation histogram of each DEM was analyzed using basic descriptive statistics. The DEMs before and after rainfall were compared and analyzed by applying the topographic range (TR) index, which is the difference in height (mm) between the highest and lowest point of the surface [41]. DEM construction and analysis were conducted using ArcMap 10.3. by Environmental Systems Research Institute, USA.
3. Results and Discussion
3.1. Results of Porosity Changes
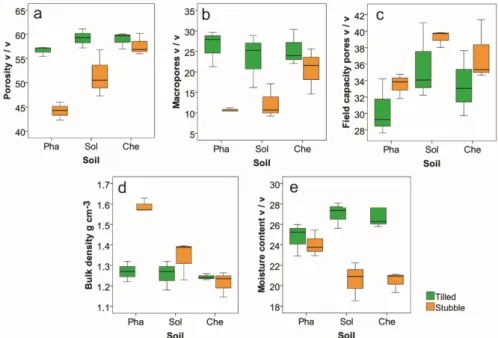
Seedbed preparation created homogeneous and high porosity values (55%–60% v/v) throughout the investigated field, which significantly decreased during the growing season. The volume of the decrease was affected by the soil type. The decrease in the volume of Phaeozem was 10%, while that of Chernozem was only 2%–3%, and significant differences (p<0.01) were observed between soil types (Figure2a). The same is true for macropores (>50µm), although micropores exhibited an opposite trend. The volume of micropores increased during the growing season and was not affected by the soil type. Moreover, the soil type determined the microporosity under both tilled and stubble conditions; Solonetz exhibited the highest amount of micropores, while Chernozem exhibited the lowest (Figure2c). Consequently, tillage cannot affect the volume of microporosity, which is consistent with the findings of Wairiu and Lal [42]. Both the Solonetz and Chernozem soils lost a significant part of their moisture content during the growing season (p<0.01), while the moisture content of Phaeozem did not change (Figure2e). The volume of micropores was in accordance with the moisture content under seedbed conditions, while it became independent under stubble, indicating that a drought occurred under the latter conditions.
Water 2019, 11, x FOR PEER REVIEW 5 of 12
by the soil type. Moreover, the soil type determined the microporosity under both tilled and stubble conditions; Solonetz exhibited the highest amount of micropores, while Chernozem exhibited the lowest (Figure 2c). Consequently, tillage cannot affect the volume of microporosity, which is consistent with the findings of Wairiu and Lal [42]. Both the Solonetz and Chernozem soils lost a significant part of their moisture content during the growing season (p < 0.01), while the moisture content of Phaeozem did not change (Figure 2e). The volume of micropores was in accordance with the moisture content under seedbed conditions, while it became independent under stubble, indicating that a drought occurred under the latter conditions.
Figure 2. Differential porosity and moisture content values after seedbed preparation and under stubble conditions. Pha: Phaeozem; Sol: Solonetz; Che: Chernozem. (a) porosity, (b) volume of macropores, (c) volume of field capacity pores, (d) bulk density, (e) moisture content
3.2. Results of Infiltration Measurements
The measured mean rainfall intensities were not uniform due to the occasional winds and pressure fluctuations, but were scattered around 47 mm h−1 (Table 2), which is slightly higher than the intensity generally applied during sprinkler irrigation using the Linear device on the studied field (42 mm h−1). The time taken for excess water to appear on the surface reflects the initial water infiltration capacity of the soil. These values were within one-minute intervals (3–4 min) for recently tilled soil and independent of soil type. In contrast, excess water appearance periods were longer and more diverse under stubble conditions, suggesting that the initial moisture content has a significant role in water infiltration against macroporosity, which was also reported by Ruggenthaler et al. [43].
Macropores created by seedbed preparation can drain and store excess water, which appears on the surface of macro-aggregates due to the higher moisture content in the capillary pores. Moreover, the order of excess water appearance over time is consistent with the micro-porosity values under stubble conditions (compared to Figure 2c).
Figure 2.Differential porosity and moisture content values after seedbed preparation and under stubble conditions. Pha: Phaeozem; Sol: Solonetz; Che: Chernozem. (a) porosity, (b) volume of macropores, (c) volume of field capacity pores, (d) bulk density, (e) moisture content
3.2. Results of Infiltration Measurements
The measured mean rainfall intensities were not uniform due to the occasional winds and pressure fluctuations, but were scattered around 47 mm h−1(Table2), which is slightly higher than the intensity generally applied during sprinkler irrigation using the Linear device on the studied field (42 mm h−1). The time taken for excess water to appear on the surface reflects the initial water infiltration capacity of the soil. These values were within one-minute intervals (3–4 min) for recently tilled soil and independent of soil type. In contrast, excess water appearance periods were longer and more diverse under stubble conditions, suggesting that the initial moisture content has a significant role in water infiltration against macroporosity, which was also reported by Ruggenthaler et al. [43]. Macropores created by seedbed preparation can drain and store excess water, which appears on the surface of macro-aggregates due to the higher moisture content in the capillary pores. Moreover, the order
of excess water appearance over time is consistent with the micro-porosity values under stubble conditions (compared to Figure2c).
Table 2.Main measured and calculated properties of the investigated soil types.
Seedbed Conditions Stubble Conditions Phaeozem Solonetz Chernozem Phaeozem Solonetz Chernozem
Precipitation amount (mm) 47.5 16.26 18.74 30.6 34.0 39.4
Precipitation intensity (mm h−1) 47.91 51.35 35.21 45.8 42.0 61.5
Excess water appearance (s) 287 235 180 587 392 457
Runoffinitiation (s) 1556 495 530 786 1028 776
Runoffamount (mm) 8.31 4.68 3.84 5.11 3.00 15.35
Final runoffintensity (mm h−1) 40.68 47.16 32.04 27.4 17.6 61.3 Final infiltration intensity (mm h−1) 7.23 4.19 3.17 18.44 24.31 0.21
Sediment yield (g) 448.99 11.99 161.38 16.0 8.3 15.4
Runoffconcentration (g L−1) 88.93 5.82 51.79 5.17 4.8 4.8
As a direct indicator of surface runoff, the runoffinitiation time revealed that the surface only smoothed over the growing season for Phaeozem (Figure3). Vermang et al. [44] observed explicit smoothening due to rainfall simulation, however, they measured runofffrom sieved soils under laboratory conditions. Our results suggest that in situ runoffinitiation is determined by the interactions of several circumstances beyond surface roughness.
Water 2019, 11, x FOR PEER REVIEW 6 of 12
Table 2. Main measured and calculated properties of the investigated soil types.
Seedbed Conditions Stubble Conditions
Phaeozem Solonetz Chernozem Phaeozem Solonetz Chernozem Precipitation amount (mm) 47.5 16.26 18.74 30.6 34.0 39.4 Precipitation intensity (mm h−1) 47.91 51.35 35.21 45.8 42.0 61.5
Excess water appearance (s) 287 235 180 587 392 457
Runoff initiation (s) 1556 495 530 786 1028 776
Runoff amount (mm) 8.31 4.68 3.84 5.11 3.00 15.35
Final runoff intensity (mm h−1) 40.68 47.16 32.04 27.4 17.6 61.3 Final infiltration intensity (mm h−1) 7.23 4.19 3.17 18.44 24.31 0.21
Sediment yield (g) 448.99 11.99 161.38 16.0 8.3 15.4
Runoff concentration (g L−1) 88.93 5.82 51.79 5.17 4.8 4.8
As a direct indicator of surface runoff, the runoff initiation time revealed that the surface only smoothed over the growing season for Phaeozem (Figure 3). Vermang et al. [44] observed explicit smoothening due to rainfall simulation, however, they measured runoff from sieved soils under laboratory conditions. Our results suggest that in situ runoff initiation is determined by the interactions of several circumstances beyond surface roughness.
Figure 3. Temporal changes in runoff intensity. Circles indicate seedbed condition; crosses indicate stubble condition. The steepness of linear functions fitted to the last 6–10 data points of each measurement provides final runoff intensity.
The final infiltration intensities were lower under seedbed conditions and increased by one order of magnitude under stubble conditions, or almost decreased to zero for Chernozem. Bombino et al.
[16] also observed a considerable decrease in the final infiltration due to cultivation on clay soils.
Effective infiltration is highly affected by the formation of a surface crust and sealing [45], as the surface is flat and the sediment deposits within a few decimeters. Therefore, the total sediment yield triggers unconsolidated crust generation with no porosity on surface depressions, which mitigates infiltration. This was also speculated by Zhao et al. [46]. Hence, the sediment yield and runoff concentration exhibit an inverse relationship with infiltration on crop fields with no slope. Stubble conditions (surface smoothing) considerably decreases the sediment yield under each soil type (Table 2), emphasizing the role of surface conditions and soil properties on aggregate stability [44].
Figure 3.Temporal changes in runoffintensity. Circles indicate seedbed condition; crosses indicate stubble condition. The steepness of linear functions fitted to the last 6–10 data points of each measurement provides final runoffintensity.
The final infiltration intensities were lower under seedbed conditions and increased by one order of magnitude under stubble conditions, or almost decreased to zero for Chernozem. Bombino et al. [16]
also observed a considerable decrease in the final infiltration due to cultivation on clay soils. Effective infiltration is highly affected by the formation of a surface crust and sealing [45], as the surface is flat and the sediment deposits within a few decimeters. Therefore, the total sediment yield triggers unconsolidated crust generation with no porosity on surface depressions, which mitigates infiltration.
This was also speculated by Zhao et al. [46]. Hence, the sediment yield and runoffconcentration exhibit
an inverse relationship with infiltration on crop fields with no slope. Stubble conditions (surface smoothing) considerably decreases the sediment yield under each soil type (Table2), emphasizing the role of surface conditions and soil properties on aggregate stability [44].
Chernozem soil has lower Na+ and higher organic carbon contents than Solonetz (Table1).
In theory, these circumstances result in Na humate-dominated, less developed, and more vulnerable aggregates for the latter soil. However, the lowest infiltration intensities were detected for Chernozem soil at both times of the year. This suggests that aggregate distribution and stability in intensively cultivated soils is a function of individual tillage operations, rather than physicochemical properties.
However, Bottinelli et al. [47] emphasized the role of moisture content and seasonal dynamics. Moreover, these results also indicate the important role of particle size distribution in aggregate stability [48], as the clay content of Chernozem was highest (Table1).
3.3. Changes in Surface Roughness
Altogether, 12 DEMs were built. The before- and after-rainfall DEMs of the Phaeozem soil under seedbed conditions are presented in Figure4as an example. Generally, the higher parts of the plots were eroded due to the precipitation that triggered the decrease in the elevation of the concerning clogs.
Water 2019, 11, x FOR PEER REVIEW 7 of 12
Chernozem soil has lower Na+ and higher organic carbon contents than Solonetz (Table 1). In theory, these circumstances result in Na humate-dominated, less developed, and more vulnerable aggregates for the latter soil. However, the lowest infiltration intensities were detected for Chernozem soil at both times of the year. This suggests that aggregate distribution and stability in intensively cultivated soils is a function of individual tillage operations, rather than physicochemical properties. However, Bottinelli et al. [47] emphasized the role of moisture content and seasonal dynamics. Moreover, these results also indicate the important role of particle size distribution in aggregate stability [48], as the clay content of Chernozem was highest (Table 1).
3.3. Changes in Surface Roughness
Altogether, 12 DEMs were built. The before- and after-rainfall DEMs of the Phaeozem soil under seedbed conditions are presented in Figure 4 as an example. Generally, the higher parts of the plots were eroded due to the precipitation that triggered the decrease in the elevation of the concerning clogs.
Figure 4. Surfaces of the Phaeozem soil under seedbed conditions before (a) and after (b) precipitation, and the built elevation models (c,d). The models were rotated clockwise by approximately 120°.
The relevant soil losses of the plots were measured, and considerable sedimentation was also recorded at the deepest parts of some plots (Figure 4d). Highly fragmented elevations became uniform and the contours were smoothed, indicating a general leveling of the surface. Jester and Klik [49] presented data on the higher inaccuracy created by using photogrammetry-based DEM to interpolate rough surfaces among macro-aggregates, which were not detected in this study.
However, highly contrasting shades and plant residuals triggered local failures (<2% of the area; also lamented by Hwang et al. [50]) that were excluded from further investigation.
The elevation values of each DEM were analyzed to quantify the changes in topography, and the descriptive statistical parameters of the distributions are presented in Table 3. As minimum (0) values were set at the deepest (runoff outlet) points of each plot, no changes were detected, despite
Figure 4.Surfaces of the Phaeozem soil under seedbed conditions before (a) and after (b) precipitation, and the built elevation models (c,d). The models were rotated clockwise by approximately 120◦.
The relevant soil losses of the plots were measured, and considerable sedimentation was also recorded at the deepest parts of some plots (Figure4d). Highly fragmented elevations became uniform and the contours were smoothed, indicating a general leveling of the surface. Jester and Klik [49]
presented data on the higher inaccuracy created by using photogrammetry-based DEM to interpolate rough surfaces among macro-aggregates, which were not detected in this study. However, highly contrasting shades and plant residuals triggered local failures (<2% of the area; also lamented by Hwang et al. [50]) that were excluded from further investigation.
The elevation values of each DEM were analyzed to quantify the changes in topography, and the descriptive statistical parameters of the distributions are presented in Table3. As minimum (0) values were set at the deepest (runoffoutlet) points of each plot, no changes were detected, despite the considerable sedimentation that occurred in some sub-basins. Hence, the sedimentation process was only quantified from the mean elevation values calculated following comparative statistical methods.
Table 3.Surface roughness changes due to rainfall simulation based on the elevation model histograms.
The values are in mm, TR: topographic range, B: before precipitation; A: after precipitation, SD:
standard deviation.
Seedbed Conditions Stubble Conditions
Phaeozem Solonetz Chernozem Phaeozem Solonetz Chernozem
B A B A B A B A B A B A
Min. 0 0 0 0 0 0 0 0 0 0 0 0
Max.
(TR) 163 115 118 100 102 95 157 75 85 78 128 92
Mean 54 52 56 51 37 34 47 26 29 32 35 35
Median 53 48 58 52 36 33 46 23 28 31 35 34
SD 26 25 21 15 17 16 19 14 10 10 13 13
Skewness 0.50 0.22 −0.43 0.14 0.17 0.23 0.58 0.87 0.59 0.26 0.14 0.04 Kurtosis 0.26 −0.78 −0.14 −0.26 −0.77 −0.54 0.40 0.31 1.19 0.47 −0.33 −0.54
The mean elevation values also decreased due to precipitation under seedbed conditions.
In contrast, no general trend was observed under stubble conditions. Phaeozem exhibited the highest reduction I elevation to 55%, while Chernozem did not change and the elevation of Solonetz increased. In theory, the increase in the mean elevation value and sedimentation within the plot should be inversely proportional to the runoffconcentration (sediment leaving the plot). However, this is not fully supported by the runoffresults (Table2). Changes in the median values are similar to those reported concerning the means, which may refer to quasi-normal distributions, in line with the skewness and kurtosis values.
The maximum values were equal to the TR and scattered within a wide range before precipitation.
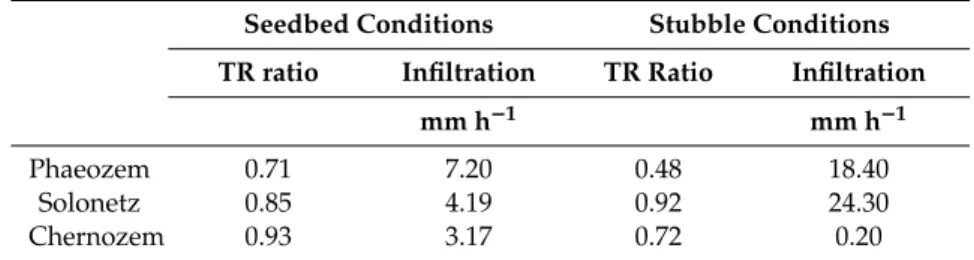
The values decreased in all cases due to precipitation, however, the ratio of change differed. The greatest smoothing was recorded for the Phaeozem soil under stubble conditions, where the topographic range decreased to 48%. Similarly, the Phaeozem soil was also the most vulnerable under seedbed conditions, where the topographic range decreased to 71%. The role of Na+in soil structure destabilization has already been reported by several authors [51,52]. In this study, both Solonetz and Phaeozem soils were rich in Na+(Table1), even though the topographic range decreases of Solonetz and Chernozem were lower and exhibited opposite trends under seedbed and stubble conditions (Table2). Therefore, the role of Na+in aggregate stability is likely affected by additional drivers, such as the organic matter content and compound, which was also suspected by Rengasamy and Olsson [53]. The lowest change was observed for Chernozem under seedbed conditions (93%). However, the temporal fluctuations during the growing season due to tillage and sealing are not yet fully understood [47]. The changes in TR due to precipitation were analyzed with the final infiltration intensities (Table4), and they were found to be completely independent.
Runoff initiation (s) (an indicator of surface storage capacity) for rainfall was found to be independent from the surface roughness estimated using TR (Table2). This supports the results obtained by Appels et al. [54], who reported that infiltration has a greater effect on runoffgeneration than the surface storage capacity. Our results also demonstrate the importance of the known and still unsolved question of characterizing surface roughness using a single number [49]. Swath analysis [55]
provides a generalized cross-section of an area at the landscape scale. Therefore, it could be suitable for measuring surface roughness in the present scale and if the spatial resolution is sufficiently high.
Table 4.Ratio of topographical range values after/before precipitation and final infiltration intensities.
Seedbed Conditions Stubble Conditions TR ratio Infiltration TR Ratio Infiltration
mm h−1 mm h−1
Phaeozem 0.71 7.20 0.48 18.40
Solonetz 0.85 4.19 0.92 24.30
Chernozem 0.93 3.17 0.72 0.20
Spatial variations in hydrology, erosion, and sedimentation within the plot were only investigated by visual observations. For example, stream capture was observed within a plot (Figure4b,d) during rainfall, which resulted in hydrological changes. To adequately describe such processes, further GIS applications are available. Theoretically, these databases are suitable for quantifying soil redistribution volumes and comparing them to the measured soil losses due to runoff. For instance, creating elevation difference maps, comparing the DEMs for before and after precipitation, or calculating the water storage capacity and flow direction database of the surface provides such additional information that would be very useful for spatially detailed smart irrigation planning. In this study, the spatial resolution of the DEMs was not sufficiently high to reliably quantify soil redistribution. Moreover, in the absence of measured bulk density values of the original surface (including wheel tracks, and micro and macro aggregates) and the sealed sediments triggered by rainfall, the volumetric prediction would not be sufficiently precise [56]. Nevertheless, our method shows promise, and further tests and calibrations are required for proper application.
4. Conclusions
The tillage-induced initial topsoil porosity and moisture content differed between the studied conditions. There was no significant difference in the volume of micropores (<10µm) under seedbed and stubble soil conditions. As a result, the final infiltration intensity was higher under stubble conditions, which occurred alongside the lower sediment concentration in runoff caused by the crusted surface. The final infiltration intensities varied widely (0.2–28.4 mm h−1) in both space and time, indicating the importance of precise irrigation. For better water efficiency and reducing soil structure degradation, the irrigation volume must be adapted to the actual infiltration value of the soil in both time and space. Nevertheless, the precipitation-generated sediment losses were not connected to the surface roughness changes, and lower aggregate stability did not necessarily trigger lower infiltration intensities, suggesting that sedimentation could only partly seal the drainage pores.
Photogrammetry was found to be a potentially useful tool for measuring aggregate stability, however, further investigations on in situ surfaces are required for technical improvement.
Author Contributions: Conceptualization and writing, G.J.; Methodology, B.M.; Investigation, G.J., E.D., and J.A.S.; Formal analysis, J.A.S.; Supervision, Z.S.
Funding: This research was funded by the National Research, Development and Innovation Office (NKFIH;
123953).
Acknowledgments:Gergely Jakab and Balázs Madarász was supported by the Bolyai fellowship of the Hungarian Academy of Sciences.
Conflicts of Interest: The authors declare no conflict of interest. The funders had no role in the design of the study; in the collection, analyses, or interpretation of data; in the writing of the manuscript, or in the decision to publish the results.
References
1. Rodrigo-Comino, J.; Neumann, M.; Remke, A.; Ries, J.B. Assessing environmental changes in abandoned German vineyards. Understanding key issues for restoration management plans.Hung. Geog. Bull.2018,67, 319–332. [CrossRef]
2. Ward, P.R.; Roper, M.M.; Jongepier, R.; Micin, S.F. Impact of crop residue retention and tillage on water infiltration into a water-repellent soil.Biologia2015,70, 1480–1484. [CrossRef]
3. Bogunovic, I.; Bilandzija, D.; Andabaka, Z.; Stupic, D.; Comino, J.R.; Cacic, M.; Brezinscak, L.; Maletic, E.;
Pereira, P. Soil compaction under different management practices in a Croatian vineyard. Arab. J. Geosci.
2017,10, 340. [CrossRef]
4. Rodrigo-Comino, J.; Gimenez-Morera, A.; Panagos, P.; Pourghasemi, H.R.; Pulido, M.; Cerda, A. The potential of straw mulch as a nature-based solution in olive groves treated with glyphosate. A biophysical and socio-economic assessment.Land Degrad. Dev. 2019, 1–13. [CrossRef]
5. Jakab, G.; Madarász, B.; Szabó, J.A.; Tóth, A.; Zacháry, D.; Szalai, Z.; Kertész,Á.; Dyson, J. Infiltration and soil loss changes during the growing season under ploughing and conservation tillage.Sustainability2017,9, 1726. [CrossRef]
6. Bartholy, J.; Pongrácz, R.; Kis, A. Projected changes of extreme precipitation using multi-model approach.
Q. J. Hung. Meteorol. Serv.2015,119, 129–142.
7. Diadin, D.; Vystavna, Y.; Vergeles, Y. Quantification of nitrate fluxes to groundwater and rivers from different land use types.Hung. Geog. Bull.2018,67, 333–341. [CrossRef]
8. Czigány, Sz.; Pirkhoffer, E.; Geresdi, I. Impact of extreme rainfall and soil moisture on flash flood generation.
Idojaras2010,114, 79–100.
9. Pásztor, L.; Körösparti, J.; Bozán, C.; Laborczi, A.; Takács, K. Spatial risk assessment of hydrological extremities: Inland excess water hazard, Szabolcs- Szatmár-Bereg County, Hungary.J. Maps2015,11, 636–644.
[CrossRef]
10. Balázs, B.; Bíró, T.; Dyke, G.J.; Singh, S.K.; Szabó, Sz. Extracting water-related features using reflectance data and principal component analysis of Landsat images.Hydrol. Sci. J.2018,63, 269–284. [CrossRef]
11. Ben-Hur, H. Runoff, erosion, and polymer application in moving-sprinkler irrigation. Soil Sci. 1994,158, 132–140. [CrossRef]
12. Jirk ˚u, V.; Kodešová, R.; Nikodem, A.; Mühlhanselová, M.; Žigová, A. Temporal variability of structure and hydraulic properties of topsoil of three soil types.Geoderma2013,204–205, 43–58. [CrossRef]
13. Khan, M.N.; Gong, Y.; Hu, T.; Lal, R.; Zheng, J.; Justine, M.F.; Azhar, M.; Che, M.; Zhang, H. Effect of Slope, Rainfall Intensity and Mulch on Erosion and Infiltration under Simulated Rain on Purple Soil of South-Western Sichuan Province, China.Water2016,8, 528. [CrossRef]
14. Di Prima, S.; Bagarello, V.; Lassabatere, L.; Angulo-Jaramillo, R.; Bautista, I.; Burguet, M.; Cerda, A.; Iovino, M.;
Prosdocimi, M. Comparing Beerkan infiltration tests with rainfall simulation experiments for hydraulic characterization of a sandy-loam soil.Hydrol. Processes2017,31, 3520–3532. [CrossRef]
15. Issaka, Z.; Li, H.; Yue, J.; Tang, P.; Darko, R.O. Water-smart sprinkler irrigation, prerequisite to climate change adaptation: A review.J. Water Clim. Chang.2018,9, 383–398. [CrossRef]
16. Bombino, G.; Denisi, P.; Gómez, J.A.; Zema, D.A. Water Infiltration and Surface Runoffin Steep Clayey Soils of Olive Groves under Different Management Practices.Water2019,11, 240. [CrossRef]
17. Cerdà, A.; Keesstra, S.D.; Rodrigo-Comino, J.; Novara, A.; Pereira, P.; Brevik, E.; Giménez-Morera, A.;
Fernández-Raga, M.; Pulido, M.; di Prima, S.; Jordán, A. Runoffinitiation, soil detachment and connectivity are enhanced as a consequence of vineyards plantations.J. Environ. Manag.2017,202, 268–275. [CrossRef]
18. Szucs, P.; Csepinszky, B.; Sisák, I.; Jakab, G. Rainfall simulation in wheat culture at harvest. Cereal Res.
Commun.2006,34, 81–84.
19. Centeri, C.; Jakab, G.; Szalai, Z.; Madarász, B.; Sisák, I.; Csepinszky, B.; Bíró, Z. Rainfall simulation studies in Hungary. InSoil Erosion: Causes, Processes and Effects; Fournier, A.J., Ed.; Nova Science Publisher: New York, NY, USA, 2011; pp. 177–217.
20. Mayerhofer, C.; Meißl, G.; Klebinder, K.; Kohl, B.; Markart, G. Comparison of the results of a small-plot and a large-plot rainfall simulator—Effects of land use and land cover on surface runoffin Alpine catchments.
Catena2017,156, 184–196. [CrossRef]
21. Szabó, J.A.; Jakab, G.; Szabó, B. Spatial and temporal heterogeneity of runoffand soil loss dynamics under simulated rainfall.Hung. Geog. Bull.2015,64, 25–34. [CrossRef]
22. Baghdadi, N.; El Hajj, M.; Choker, M.; Zribi, M.; Bazzi, H.; Vaudour, E.; Gilliot, J.M.; Ebengo, D.M. Potential of Sentinel-1 Images for Estimating the Soil Roughness over Bare Agricultural Soils. Water2018,10, 131.
[CrossRef]
23. Martinez-Agirre, A.; Álvarez-Mozos, J.; Giménez, R. Evaluation of surface roughness parameters in agricultural soils with different tillage conditions using a laser profile meter.Soil Tillage Res.2016,161, 19–30.
[CrossRef]
24. Bullard, J.E.; Ockelford, A.; Strong, C.L.; Aubault, H. Impact of multi-day rainfall events on surface roughness and physical crusting of very fine soils.Geoderma2018,313, 181–192. [CrossRef]
25. Szalai, Z.; Szabó, J.; Kovács, J.; Mészáros, E.; Albert, G.; Centeri, Cs.; Szabó, B.; Madarász, B.; Zacháry, D.;
Jakab, G. Redistribution of Soil Organic Carbon Triggered by Erosion at Field Scale Under Subhumid Climate, Hungary.Pedosphere2016,26, 652–665. [CrossRef]
26. Brasington, J.; Smart, R.M.A. Close-range digital photogrammetric analysis of experimental drainage basin evolution.Earth Surf. Process. Landf.2003,28, 231–247. [CrossRef]
27. Ruzgien ˙e, B.; Berteška, T.; Geˇcyte, S.; Jakubauskien ˙e, E.; Aksamitauskas, V. ˇC. The surface modelling based on UAV Photogrammetry and qualitative estimation.Measurement2015,73, 619–627. [CrossRef]
28. Thomsen, LM.; Baartman, J.E.M.; Barneveld, R.J.; Starkloff, T.; Stolte, J. Soil surface roughness: Comparing old and new measuring methods and application in a soil erosion model.Soil2015,1, 399–410. [CrossRef]
29. Tarolli, P.; Cavalli, M.; Masin, R. High-resolution morphologic characterization of conservation agriculture.
Catena2019,172, 846–856. [CrossRef]
30. Uysal, M.; Toprak, A.S.; Polat, N. DEM generation with UAV Photogrammetry and accuracy analysis in Sahitler hill.Measurement2015,73, 539–543. [CrossRef]
31. Gilliot, J.M.; Vaudour, E.; Michelin, J. Soil surface roughness measurement: A new fully automatic photogrammetric approach applied to agricultural bare fields.Comput. Electron. Agric. 2017,134, 63–78.
[CrossRef]
32. Da Silva, A.M.; Huang, C.H.; Francesconi, W.; Saintil, T.; Villegas, J. Using landscape metrics to analyze micro-scale soil erosion processes.Ecol. Indic.2015,56, 184–193. [CrossRef]
33. Bauer, T.; Strauss, P.; Grims, M.; Kamptner, E.; Mansberger, R.; Spiegel, H. Long-term agricultural management effects on surface roughness and consolidation of soils.Soil Tillage Res.2015,151, 28–38. [CrossRef]
34. Ding, W.; Huang, C. Effects of soil surface roughness on interrill erosion processes and sediment particle size distribution.Geomorphology2017,295, 801–810. [CrossRef]
35. Dövényi, Z.Inventory of Microregions in Hungary; MTAFKI: Budapest, Hungary, 2010; p. 876.
36. Dobos, E.; Kovács, K.; Dobos, A.; Vadnai, P.; Hadobás,Á.; Gál-Szabó, L. Pedological investigations and planning for irrigation system construction. Unpublished measurement report, 2017. (In Hungarian) 37. IUSS Working Group WRB.Word Reference Base for Soil Resources; IUSS/ISRIC/FAO: Rome, Italy, 2014; p. 139.
38. Rowell, D.L.Soil Science: Methods and Applications; Routledge: London, UK, 2014; p. 345.
39. Salles, C.; Poesen, J.; Borselli, L. Measurement of simulated drop size distribution with an optical spectro pluviometer: Sample size considerations.Earth Surf. Processes and Landforms1999,24, 545–556. [CrossRef]
40. Salles, C.; Poesen, J. An Optical Spectro Pluviometer for the measurement of raindrop properties.IAHS Publ.
1998,249, 97–102.
41. Kuipers, J. A relief meter for soil cumulative studies.Neth. J. Agric. Sci.1957,5, 255–262.
42. Wairihu, M.; Lal, R. Tillage and land use effects on soil microporosity in Ohio, USA and Kolombangara, Solomon Islands.Soil Tillage Res.2006,88, 80–84. [CrossRef]
43. Ruggenthaler, R.; Meißl, G.; Geitner, C.; Leitinger, G.; Endstrasser, N.; Schöberl, F. Investigating the impact of initial soil moisture conditions on total infiltration by using an adapted double-ring infiltrometer.Hydrol. Sci.
J.2016,61, 1263–1279. [CrossRef]
44. Vermang, J.; Norton, L.D.; Huang, C.; Cornelis, W.M.; da Silva, A.M.; Gabriels, D. Characterization of Soil Surface Roughness Effects on Runoffand Soil Erosion Rates under Simulated Rainfall.Soil Sci. Soc. Am. J.
2014,79, 903–916. [CrossRef]
45. Jakab, G.; Németh, T.; Csepinszky, B.; Madarász, B.; Szalai, Z.; Kertész,Á. The influence of short term soil sealing and crusting on hydrology and erosion at Balaton Uplands, Hungary.Carpathian J. Earth Environ. Sci.
2013,8, 147–155.
46. Zhao, L.; Hou, R.; Wu, F.; Keesstra, S. Effect of soil surface roughness on infiltration water, ponding and runoffon tilled soils under rainfall simulation experiments.Soil Tillage Res.2018,179, 47–53. [CrossRef]
47. Bottinelli, N.; Angers, D.A.; Hallaire, V.; Michot, D.; Le Guillou, C.; Cluzeau, D.; Heddadj, D.;
Menasseri-Aubry, S. Tillage and fertilization practices affect soil aggregate stability in a Humic Cambisol of Northwest France.Soil Tillage Res.2017,170, 14–17. [CrossRef]
48. Ben-Hur, M.; Shainberg, I.; Bakker, D.; Keren, R. Effect of soil texture and CaCO3content on water infiltration in crusted soil as related to water salinity.Irrig. Sci.1985,6, 281–294. [CrossRef]
49. Jester, W.; Klik, A. Soil surface roughness measurement—methods, applicability, and surface representation.
Catena2005,64, 174–192. [CrossRef]
50. Hwang, J.T.; Chen, Y.W.; Lian, W.Y.; Yang, Y.Y.; Chu, T.C. DSM generation on the shade of tree area of aerial photogrammetry. In Proceedings of the 23rd International Conference on Geoinformatics, IEEE, Wuhan, China, 19–21 June 2015. [CrossRef]
51. Chaney, K.; Swift, R.S. The influence of organic matter on aggregate stability in some British soils.Eur. J. Soil Sci.1984,35, 223–230. [CrossRef]
52. Amézketa, E. Soil Aggregate Stability: A Review.J. Sustainable Agric.1999,14, 83–151. [CrossRef]
53. Rengasamy, P.; Olsson, K.A. Sodicity and soil structure.Aust. J. Soil Res.1991,29, 935–952. [CrossRef]
54. Appels, W.M.; Bogaart, P.W.; van der Zee, S. Influence of spatial variations of microtopography and infiltration on surface runoffand field scale hydrological connectivity.Adv. Water Resour.2011,34, 303–313. [CrossRef]
55. Telbisz, T.; Kovács, G.; Székely, B.; Szabó, J. Topographic swath profile analysis: A generalization and sensitivity evaluation of a digital terrain analysis tool.Z. Geomorphol.2013,57, 485–513. [CrossRef]
56. Carter, M.R. Relative measures of soil bulk density to characterize compaction in tillage studies on fine sandy loams.Can. J. Soil Sci.1990,70, 425–433. [CrossRef]
©2019 by the authors. Licensee MDPI, Basel, Switzerland. This article is an open access article distributed under the terms and conditions of the Creative Commons Attribution (CC BY) license (http://creativecommons.org/licenses/by/4.0/).