Freezing Methods
A . E. SNYDER
I. Introduction 2 9 2 A . Characteristics of Sea W a t e r as Related to Freezing Processes 2 9 5
B. Formation and Separation of Ice Crystals 2 9 7 C. T h e r m o d y n a m i c s of Freezing Process 2 9 8
II. T h e o r y of Crystallization 3 0 0 A . General Discussion 3 0 0 B. Crystal Purity 301 C. Crystal G r o w t h and Habit 301
D . Nucleation 303 E. Entrained Liquor Content in Crystal M u s h 3 0 4
F. Range of Percentage of Entrained M o t h e r L i q u o r in M u s h 305 G. Difficulty of Decreasing Proportion of Entrained M o t h e r L i q u o r 3 0 6
III. T h e o r y of Separation and W a s h 3 0 6 A . M e t h o d s of Separation 3 0 6 B. S e p a r a t i o n — W a s h - C o l u m n T h e o r y 3 0 7
C. Hydraulic-Piston Analysis of Wash-Separation C o l u m n 3 0 8
IV. Description of Basic Freezing Processes 3 0 8 V . Detailed Analysis and Description of Direct-Refrigeration V a c u u m Freezing-
Vapor Compression System 3 1 5 A . Process Arrangement 3 1 5 B. Flow Diagram and Energy Balance 3 1 7
C. M a j o r Components and Systems 321
D . Plant Installations 333 E. Factors in Plant Economics 3 3 4
F. Cost S u m m a r y 3 3 8 V I . Desalting with Hydrates 339
A . Process Description 339 B. Advantages of the Hydrate Process 3 3 9
C. Application of the Hydrate Process 341
Acknowledgments 343 References 343
2 9 1
L Introduction
The conversion of saline water to fresh water by freezing has always existed in nature and has been known to men in northern climates for thousands of years. Desalination of water by freezing has been practiced by the inhabitants of Central Asia and Western Siberia for generations.
Short frost periods are utilized to freeze saline water in ditches, where it is allowed to melt in the sunlight and is used for watering cattle.
Scientifically we have also known for some time that the solidification of sea water is accompanied by complete segregation of dissolved salt on a local scale (microsegregation) and fairly pronounced macrosegrega- tion as well. The observed salt distribution in a layer of sea ice, at a particular point in time, solidified on open water in contact with still air at — 40°C is shown in Fig. 7.1. Mass transport continues to take
6 r
-Starting sea-water salinity - -
Ice - brine interface
• Ice surface
8 10
0 2 4 6 Depth from surface, cm
F I G . 7.1. Salinity distribution in ice layer forming under still air at — 4 0 ° C .
place throughout the semisolid layer as solidification progresses, such that the average salinity throughout the layer decreases with time as shown in Fig. 7.2. Fishermen, along the banks of the saline Aral Sea in the Kazakh Republic of the U.S.S.R., are known to collect sea ice during the winter and store it for summer use. Oceanographers at the
3h
Salinity vs time — normal freeze
_L 12 Time, hr
16 2 0 2 4
F I G . 7 . 2 . Average salinity vs. freezing time for young sea ice freezing in still air at - 4 0 ° C .
world-famous Scripps Institution of Oceanography in California, knowing that glacial and sea ice are relatively salt-free, have gone so far as to propose that icebergs be towed up from the Antarctic to California for remelting into fresh water.
All current practical desalination methods fall into one of two categories: those that remove the fresh water and leave behind a concentrated brine, or those that remove the salt and leave behind the fresh water as a residue. The freezing process, which we are discussing in this chapter, falls into the first class of phenomena, which is basically a category relating to solid or ice-forming phase-change phenomena within dilute solutions. When salt water is reduced to a certain critical temperature, which is a function of its salinity, ice crystals of pure
water are formed within the salt water. These ice crystals can be mechanically separated from the mother liquor and remelted to obtain pure water. Engineers have designed all existing freezing desalination processes on such fundamental knowledge.
Until a major scientific breakthrough occurs, the missing link to practical development of the freezing process is in engineering ap
plications. In fact, almost all known freezing processes can be easily demonstrated on a small-scale basis. The really significant problem of development has manifested itself in the application of the principles and techniques to economical large-scale plants. The truly difficult aspect has been the need to develop a technical capability to design a freezing installation that will have a delicate balance between high thermodynamic efficiency, low capital cost, and minimal maintenance expense.
Theoretically, freezing processes have several advantages over all forms of conventional distillation processes, which are their chief com
petitors. The operating-temperature level within the freezing process is at or below the freezing temperature, and at these temperatures scaling and corrosion are greatly decreased. This point must be em
phasized to recognize its importance. A serious disadvantage to the successful application of the distillation process on a large scale has been the accompanying scaling and corrosion problems. The absence of these troublemakers is a fantastic gain in favor of the freezing process.
Saline water contains ions of calcium, magnesium, bicarbonate, sulfate, sodium, and chlorine. Under the high-temperature operating conditions of most evaporative or distillation processes, precipitates can and will form as a hard scale on the surfaces. The prevention or removal of these scales requires expensive operational and maintenance practices which the freezing process does not require. The freezing process's escape from scale formation is, of course, due to the low operating temperatures, which keep the solubility of scale-forming compounds to a minimum.
With respect to corrosion, steel in contact with sea water at elevated temperatures experiences an increased rate of corrosive attack. The freezing process, on the other hand, with its lower temperatures, permits the use of inexpensive noncorrosive plastics and protective coatings on low-alloy steels. Furthermore, direct refrigeration techniques easily allow the elimination of a heat-exchange surface between the refrigerant and the sea-water effluent, which increases the thermodynamic efficiency of the process and thus reduces the energy-input requirements, a very important consideration, as we shall see.
A . CHARACTERISTICS OF SEA W A T E R AS RELATED TO FREEZING PROCESSES
Sea water is a complex solution of organic and inorganic salts derived over the course of geologic time from the solution of rocks, the gaseous effusion of volcanoes, biological activity, and probably to a far lesser extent from a meteoritic material in the earth's atmosphere. Sea water is about 2 7 0 0 times more abundant on earth than impounded fresh water; furthermore, its physical characteristics are quite different from those of fresh water because as a solution, its characteristics differ not only with temperature and pressure but with the concentration of the salt in solution, more commonly called the salinity. The salinity of sea water is rigorously defined as 4 4the total amount of solid material in grams contained in one kilogram of sea water when all the carbonate has been converted to oxide, the bromine and iodine replaced by chlorine and all organic material completely oxidized." Desalinated fresh water is usually defined as "water containing less than 1000 parts per million of dissolved salts." This is, in fact, the standard of the United States Public Health Service, and inasmuch as desalination is principally concerned with the manufacture of fresh water for human consumption, it has become customary to discuss salinities in terms of the number of parts of dissolved solids per million instead of the percentage used by oceanographers and scientists, although both are very nearly the same.
In the open ocean the total concentration of salinity varies between 33,000 and 38,000 ppm, depending upon the geologic location. For example, precipitation, evaporation, and the melting of ice in the polar regions all have an effect upon the salinity levels of sea water. In coastal areas, where there is a considerable inflow of fresh water from rivers and from ground water, the salinity values will also be lowered. Com- pletely enclosed seas in high latitudes with low evaporation rates together with large inflows of fresh water and precipitation, such as the Baltic Sea, have low salinities. On the other hand, the highest salinities are found in enclosed seas in subtropical zones, where almost no inflow of fresh water or precipitation occurs and where high evaporation rates take place. For instance, the Red Sea and the Persian Gulf have maximum salinities of 40,000 ppm.
Sea water, has the properties of a dilute solution. Figure 7.3 shows the different phase states for pure water and for sea water and illustrates the relationship between the two of vapor pressure, boiling point, and freezing point. This diagram is commonly called a phase diagram and shows the vapor pressure of sea water to be lower than the
F I G . 7.3. Phase diagram for sea water and pure water.
vapor pressure of pure water. As a result, the boiling point of sea water is higher than the boiling point of fresh water for the same pressure.
The depression of the freezing point of sea water below that of fresh water can also be inferred from this diagram. The intersection of the fusion and liquid phases is the temperature at which the two phases have the same vapor pressure and, therefore, are in equilibrium with each other. On the other hand, the freezing point of sea water is at a point, which is at the intersection of the vapor-pressure curve and the fusion curve for sea water.
Referring again to Fig. 7.3, it can readily be seen that as the salinity of the sea water increases, the freezing point decreases. If a series of experimental tests were conducted for range of sea waters of varying
densities to determine their freezing point, the resulting data would establish the plot shown in Fig. 7.4. This curve illustrates that the freezing point within the normal operating range will vary from —4.2 to - 1 . 9 5 ° C .
8h
Β. FORMATION AND SEPARATION OF ICE CRYSTALS
If sea water is reduced in temperature to a value very close to that of the freezing point, ice crystals will begin to form within the solution.
All freezing desalination processes are fundamentally based upon this phenomenon. Actual experiments have shown that ice crystals formed in this manner, under conditions somewhat similar to the physical conditions of a freezing chamber, always are minute in size. Microscopic examination of the crystals indicates that in addition to being small they are also flat, with their larger dimensions on the order of 0.1 to 0.4 mm and the smaller dimensions only one-fifth of this. As a con
sequence, the crystals have a very large surface-to-weight or surface-to- volume ratio.
F I G . 7.4. Equilibrium freezing curve for sea water.
Other investigators have shown that a mass of such minute ice crystals tends to retain in the interstices between the crystals a comparatively large volume of mother liquid, which can only be displaced by actually washing the crystals with desalted water. From this it is obvious that if the ice crystals could be formed as very large pure crystals, then the separation and subsequent washing operations would be quite simple, effective, and inexpensive. Control of the size of ice crystals under freezing-process conditions is an area in which much research still needs to be done.
C. THERMODYNAMICS OF FREEZING PROCESS
The freezing process occurs when the temperature of the sea water to be purified is reduced in temperature to a point where ice crystals are formed. The resulting crystals are then physically separated from the mother liquid, washed to remove any entrapped brine, and remelted into salt-free fresh water. This is a thermodynamic system in which the inflow and outflow of heat must be carefully controlled. Providing that the thermodynamic design for the system has been carefully made and that the heat gains or losses are held to an absolute minimum, the type of input energy required for the freezing process is mechanical or electrical energy to operate the pumps and other equipment.
The cost of energy, however, is one of the largest items of expense in any desalination process, and for this reason the thermodynamic design of the system must receive careful attention. Regardless of what form of energy is utilized in a particular system, thermodynamic theory dictates that there is a minimum value for the energy required in any process to separate salt and water. This minimum amount is, of course, a function of the salinities of the incoming feed water and outgoing brine. Water of zero salinity requires no energy to separate the water from nonexistent salts, but sea water of average density requires an average input of 2.7 kw-hr per 1000 gal of fresh water produced. Some comprehension of just how much energy this is can be had by recognizing that the amount of energy to raise 1000 gal to a height of 9 0 0 ft would closely approximate this amount.
A distinction must be made, however, between the minimum amount of energy needed to just separate water and salts, and the actual amount required in a practical process. It is sometimes mistakenly pointed out that the freezing process has a potentially higher efficiency than an evaporation process based upon the fact that the latent heat of freezing is only one-seventh the latent heat of evaporation. It is more of a thermo
dynamic truth to say that the freezing process may have advantages
over the evaporation process due to certain inherent heat-transfer efficiencies in the freezing process.
Actual thermodynamic calculations using realistic values for the controlling parameters have shown that theoretically there is very little thermodynamic difference between the freezing process and the distilla
tion process.
The theoretical energy requirement of the freezing process has been defined (Dodge, 1960; Wiegandt, 1961) as the minimum work required for pumping the latent heat of freezing from the freezing temperature of the brine to that of pure water.1 Wiegandt (1961) has shown that this reversible work in Btu per pound of product is given by the relationship
w = ΔΗΔΤΜ^
where Δ Η is the change of enthalpy of process water (latent heat of freezing), ΔΤίρα the freezing-point depression for the conditions of process, and Τ the temperature of process.
Assuming a freezing-point depression at approximately 50 % con
version and taking standard values for the sea-water temperature of 25°C and a salinity of 35,000 ppm, one can calculate from the above equation that the theoretical energy for the process would be about 6.3 kw-hr/1000 gal of product water. Assuming further allowances for the irreversible effects in any practical system, one can compute a realistic theoretical energy target for any freezing process of 4 0 kw-hr/1000 gal.
Recently, Colt Industries, Inc., which has been a leader in developing the freezing process in the United States, made public their ability to produce water by freezing with energy inputs of 4 0 kw-hr/1000 gal.
Furthermore, they predict that the power consumption by their process has a potential of being reduced to 30 kw-hr. These values are only 15 to 10 times greater than the required minimum and are certainly a significant step forward.
1 This definition is not identical with that for the thermodynamic m i n i m u m work for splitting sea water into fresh water and brine, which amounts to about 3.7 kw-hr/1000 gal of fresh water produced at 5 0 % recovery. This figure refers to a batch process at near- equilibrium, in which sea water is exposed to ever-decreasing temperatures until the desired brine concentration is reached. Wiegandt's expression, on the other hand, refers to a continuous process in which sea water enters a tower containing brine and ice which are continuously withdrawn. Because an entropy increase occurs at the point of mixing of sea-water feed and brine, this formula yields higher values for W.
II. Theory of Crystallization
A. GENERAL DISCUSSION
The study of crystal growth, habit, and texture is a specialized branch of crystallography. It has a fairly sophisticated theory and well-developed method of experimentation. Much of this work in recent years has been directed toward the purification and growth of large crystals of technical importance in the electrical industry—semi
conductors, ferroelectrics, piezoelectrics. Some of these crystals are grown from the melt, others from aqueous solutions. The control of dendritic crystal growth has recently been successfully achieved in the production of very large semiconductor crystals. The study of crystal growth and texture in metals is vital to the science of metallurgy and has been an active area of research for many years. There are also considerable accumulations of data relating to ice formations in oceans and the technology of purifying salt from brines, but these are not published in the journals where the scientist and engineer engaged in desalination research normally seeks crystallographic information. Much of this work has been conducted by metrologists interested in snow-crystal formation and geologists studying glacier and ice formations. Svanoe et al. (1961) have given an excellent basic description of crystallization theory.
Crystallization of ice from sea water, or the formation of a new solid phase from an undercooled melt, can be considered in two steps:
the formation of nuclei, and their growth to the desired dimensions.
In both steps the degree of undercooling of the brine is the controlling factor.
Many studies have been published on nucleation from pure water and from supercooled clouds. Although these studies do not apply directly to a continuous crystallization system, where nucleation and crystal growth occur together, these studies have advanced the under
standing of the crystallization process.
Regarding the appearance of initial nuclei from clear solutions, Hillig (1958) discussed results from freezing experiments. Pure water was sealed into thin-walled glass capillaries and subcooled gradually.
Nuclei did not appear, but the water froze spontaneously at an under
cooling of - 2 0 to - 2 3 ° C .
Chalmers (1959) stated that ordinary tap water cannot be undercooled by more than about 5 degrees, because of the presence of suspended particles which permit the formation of nuclei at that temperature.
The temperature for formation of ice nuclei from an undercooled
"melt" (or water) depends then upon the purity of the water, presence of suspended insoluble solids, agitation, etc., and, as indicated above, can reach an undercooling of —23°C.
In a continuous crystallization process, very small crystals will always be present in the zone where the undercooling is being produced.
These small crystals will control the degree of undercooling that can be maintained in the system and still keep the system under control.
Saeman (1956) and Robinson and Roberts (1957) discuss particle-size distribution in crystallizers of various types and develop means for predicting size ranges and distribution for growing beds of crystals of solute.
B. CRYSTAL PURITY
As pointed out by Chalmers (1959), the structure of the ice crystal has great regularity and symmetry. Because this highly organized structure cannot accommodate other atoms or molecules without very severe local strain, salt and practically every other solute in the water is rejected by the advancing surface of a growing ice crystal. This means that the impurities accumulate just ahead of the crystal surface, but the purity of the ice crystal (produced under well-controlled conditions) is high. Very few cases have been reported where an impurity locates within the ice crystal lattice. T r u b y (1955) reported that when growing ice crystals from water containing about 20 ppm fluorine as cesium fluoride, the fluoride ions are incorporated into the ice structrue, a most interesting but apparently quite rare case.
C. CRYSTAL G R O W T H AND H A B I T
The ice crystal belongs to the hexagonal system. The hexagonal crystal axes are the three α-axes, in the horizontal plane, of equal length with angles of 120° between the positive ends. The vertical axis is designated as the £-axis. The ice crystal can be further identified as belonging to the ditrigonal pyramidal class.
The faces on the ice crystal develop at different rates, depending on the specific conditions of growth. The form the crystal assumes, because of the relative sizes of its faces, is called the crystal habit.
In the growth of a crystal from a nucleus, the early forms that appear will be those of relatively high energy and rapid growth (Hurlbut, 1959).
Continued addition of material to these planes will build them out, while the less rapidly growing planes lag behind. As growth progresses, the rapidly growing faces disappear, literally growing themselves out of
existence, building the slower growing, more stable forms in the process. After this stage is complete, growth is much slower, as addition is now entirely to the slower growing, lowest energy form. Thus, crystals themselves, if viewed at various stages of their development, serve as models of the rate of growth.
Hillig (1958) reports growth rates along the £-axis as well as in the direction perpendicular to the c-axis (basal plane). These experiments were performed in thin-walled glass capillaries and with stationary single crystals in pure water. They give interesting information regarding the rates of growth along different crystal axes or faces, information that is most significant in helping to explain the formation of the different habits of ice crystals. The rate of growth as given has been recalculated on the basis of millimeter growth per unit time in minutes as follows (all figures are at an undercooling of 0.1°C):
Growth along c-axis: about 0.2 mm/min Growth perpendicular to c-axis: about 3 mm/min
These growth rates indicate that flat hexagonal plates would be the result of crystal growth in pure water. As will be seen later, such is not the case in ocean water.
Hillig states that at undercoolings up to about 0.2° the interface grew as a surface that appeared to be perfectly planar, and the crystal grew without change of orientation or loss of perfection as detectable with polarized light. Crystals may be grown at considerably higher rates at undercoolings larger than 0.2°C but they tend to be imperfect.
For crystals grown in pure, undercooled water under the above conditions the temperature is the only variable. For snow crystals, however, there are two important variables: the temperature and humidity of the vapor medium in which they grow. Table 7.1 gives ice-crystal formation for different temperature ranges, as reported by Isono (1958). It is interesting to point out that the crystals produced in one of the early freezing plants from ocean water were reported
T A B L E 7.1
ICE C R Y S T A L F O R M S FOR V A R I O U S TEMPERATURES
Temperature range Ice-crystal habit
0 ° C to - 3°C T h i n hexagonal plates - 5°C to - 9 ° C Hexagonal prisms or columns
- 1 0 ° C to - 2 0 ° C Hexagonal plates, but thicker than above Below - 2 0 ° C C o m p l e x prismatic habit
(Svanoe et al., 1961) to be predominantly of the hexagonal, platy habit, resembling snow crystals produced at — 1 0 to —20°C. Undoubtedly salinity played a part in inhibiting the growth perpendicular to the £-axis.
D. NUCLEATION
The production of nuclei can proceed by a number of processes:
(1) By a slight change in physical or chemical environment.
(2) By the inoculating influence of existing crystals or other nucleating agents.
(3) By attrition of existing crystals.
(4) By vigorous agitation as with a stirrer.
Early work on crystallization resulted in the formulation of two regions of supersaturated solutions, the metastable and labile. The definitions of metastable and labile conditions were first used by Ostwald, whose original paper is quoted by L a M e r (1952). This line of investiga- tion was followed by Miers, whose efforts were summarized by Buckley (1951).
The metastable region is one of low supersaturation. While the metastable supersaturation has significance, it must be used with caution, since the so-called allowable degree of supersaturation in continuous operation is only a fraction of the Miers' value, owing to the presence of small crystals, or nuclei, in the zone of supersaturation.
In the labile region the supersaturation is such that spontaneous nucleation occurs without seeding or agitation. In the labile region, crystallization, the dependence of the nucleation rate on the degree of supersaturation (subcooling), is so great that the rate of formation of nuclei cannot be ascertained.
The difficulty experienced by many investigators with the crystalliza- tion of water stems from their operation in the labile region. In small- batch equipment, Rose and Hoover (1955) produced extremely small ice crystals measuring only a few thousandths of an inch in size.
Photomicrographs of some of their crystals are illustrated in Fig. 7.5.
The relatively narrow range of the undercooling in which ice will grow without spontaneous nucleation has probably obscured the fact that there is for ice, as well as for other substances, a so-called metastable range of usable extent. The design of a suitable crystallizer is strongly influenced by this narrow range of subcooling, and this must be given careful consideration in the design of the crystallizer.
F I G . 7.5. Ice-crystal photomicrographs.
Ε . ENTRAINED LIQUOR CONTENT IN CRYSTAL M U S H
When starting up the freezing system, the sea water can be under- cooled beyond the equilibrium freezing point to a certain extent and for a limited time. When crystals do appear, the size of the nuclei of ice will depend upon the degree of undercooling; considerable under
cooling means small initial crystals, and in continuous operation it may take hours to reach what may be called "equilibrium size" at some particular set of operating conditions.
In tests of the Struthers Wells Corporation (Svanoe, 1959), high undercooling of the sea water was used to investigate this effect on initial crystal size. Although an undercooling of 1°F could be tolerated at the nucleation step, it was found that equilibrium conditions, as to crystal size, were reached faster when the undercooling of the sea water at the nucleation point was less than 0.5°F. T o obtain the desired results, the undercooling, nucleation, and growth rate must be balanced to obtain the desired quality. The rate of cooling and the uniform distribution of undercooling of the brine throughout the system is of the utmost importance in obtaining high-quality crystals W h e n start-ups are intermittent, equilibrium conditions, as to crystal size and quality, cannot be reached. W h e n the runs are continuous, however, the crystal size improves steadily. After obtaining steady-state conditions, the same general type of crystal product is continuously produced unless the run is interrupted.
F . RANGE OF PERCENTAGE OF ENTRAINED MOTHER LIQUOR IN M U S H
Mush is the name generally applied to the filtered product of the crystallizer. Unless this product is treated, it will be contaminated with mother liquor held on the surface of the ice crystals and in the interstices between the crystals. This contaminating liquor would be transported into the melting phase of the process and find its way into the product water unless it was first separated. Early Work done by the Applied Science Laboratories (Rose and Hoover, 1955) indicated that the percentage of ice formed by weight from the original solution is nearly equal to the percentage of mother liquor by weight carried along by the ice crystals. Thus the term "mush" refers to a mixture of ice crystals and entrained mother liquor.
Examples of all the different freezing conditions were tried. Several hundred systematic small-scale partial-freezing experiments were performed under various conditions. Systematic variations were made of the rate of cooling, the length of the cooling period, the kind of agitation, the material and size of the container, and the initial concentra- tion of the salt solution. In each experiment the ice was separated from the solution by draining or filtration under such conditions that melting of ice was reduced to a minimum. The weights of original salt solution, of mother liquor, and of filtered ice and entrained liquid were determined.
The salt content of both the ice and the mother liquor was determined, and experiments were given limited weight unless substantially all the original water and salt were accounted for in the products. In many cases the temperature of one or two points in the solution were examined from the beginning of the experiment to the end, and the temperature of the cooling bath was similarly followed. In many instances, the ice was examined under magnification. In some cases, the filtered ice was washed with pure water.
There is nothing unusual or surprising about finding crystals that are contaminated by adhering mother liquor, but in the case of ice formed from saline solutions it is very difficult to remove the mother liquor present with the ice crystals, even after conventional draining and filtering operations. This is probably due to two or three causes.
In the first place, optical examination has shown that the ice crystals are quite small and flat; the ratio of their length to thickness is of the order of five to one or greater. As a consequence, the mass of crystals has a very large surface-to-weight or surface-volume ratio. As we have noted a sizable proportion of the mother liquor is held in the many interstices between crystals, in addition to that on the surfaces. The essential data supporting the small crystal size of the ice and the tight
interstice network is shown in the photomicrographs of various in
vestigators. The abnormally high surface tension of water compared with most other substances, and the fact that both the liquid and the solid phases are water, probably cause the entrained mother liquor to adhere more tenaciously than in the case for other crystal mother systems.
G . DIFFICULTY OF DECREASING PROPORTION OF ENTRAINED MOTHER LIQUOR
Experiments conducted over a considerable range of conditions of ice formation indicate that possibly very few variations in the crystallization conditions will cause a systematic change in the proportion of entrained mother liquor. The most important factor is the size and shape of the crystal. The proportion of entrained liquor in various processes ranges from 15 to 45 % of the weight of the mush, with most values in the range 20 to 4 0 % . Thus, separation and wash of the crystals is a critical part of the freezing process.
IIL Theory of Separation and Wash
A . METHODS OF SEPARATION
The function of the separation equipment in the freezing process is to separate the ice crystals from the ice-brine slurry. Several methods of separation are available, each dependent upon a significant physical characteristic of the ice crystals which permit efficient separation of the ice from the brine. Crystal size and specific gravity are two such characteristics.
Filtration of ice crystals from the brine is an obvious approach, but requires a complicated, slow, and possibly troublesome filtration system; consequently this principle has not been applied practically.
The difference in specific gravity of ice and brine is the physical characteristic which has received the most attention in practical separa
tion techniques. In application this method takes the form of a large cylindrical vertical column rising from a head tank. The column walls are perforated or screened, and the ice-brine slurry when pumped into the bottom of the column flows upward in the column and a floating column of ice crystals is formed. The brine passes out into the angular tank. The ice is harvested from the top of the column, which is con
tinuously pushed upward by the hydraulic forces of the pressurized
ice-brine slurry in the foot of the column. As we have seen above, ice crystals formed in the freezing process are nearly pure water, but the gross separation of the ice from the ice-brine slurry does not, un- fortunately, free the ice of the brine. A bed of ice crystals separated in this manner and drained by gravity retains an equal weight of brine held within the crystals by capillary and viscous forces. This brine is removed by counterwashing with by-passed product water.
B. S E P A R A T I O N — W A S H - C O L U M N THEORY
Studies of the mass transfer taking place in the separation—wash column can be made, and several theories have been proposed (Bosworth et al., 1959). The simplest of these theories is discussed here.
In the wash column a consolidated porous bed of ice particles moves upward vertically. Brine adheres to the surface of the particles by viscous forces and is held in the interstices by capillary forces. Flowing downward countercurrent to the ice and attendent brine is a wash water more dilute than the brine. Because of the small size of the particles, the fluid flow is laminar. Velocity gradients exist in both the fluid associated with the ice and the wash water, but mixing of the two streams occurs only by diffusion. Salt diffuses from the brine to the wash water, thus freeing the ice of its salt content and increasing the salt concentration in the wash liquor.
Each ice particle is assumed to be pure frozen water, and the salt associated with the ice is concentrated in the liquid adhering to the various surfaces of the ice bed. The theory thus assumes that the ice is free of salt and that only the adhering brine is saline. The ice is only the carrier of the brine, and salt transfer is from one liquid to another.
The above description of a wash-column may be compared to a continuous countercurrent extraction process in which wash water is the extracting agent, brine is the original solvent, and the salt is the common solute. Equilibrium is very simply described in such a process, since the two solvents are the same substance (water) and no complex phase equilibrium is involved. A t equilibrium, the concentrations in each stream are equal. Mass balances on the salt fix the average con- centrations throughout the column for any set of terminal conditions.
If it is now further assumed that the composition of either the upward- moving brine stream or the downward-moving wash water may be specified by a single average concentration at any elevation, and further that the rate of salt transfer is proportional to the difference of these two concentrations, the whole process may be described analytically by simple rate equations and material balances.
C . HYDRAULIC-PISTON A N A L Y S I S OF WASH-SEPARATION COLUMN
The slurry feed into the bottom of the separation column is a dilute suspension of ice particles in brine containing a small percentage of ice.
This slurry flows upward through the bottom cone in the column and is eventually separated into two streams by the filtering screens at the top of the cone. One stream is in the liquid which passes through the screen and is removed from the column, and the other is the ice with some attending brine held by the small ice particles.
It is important to be able to predict at just what level in the cone the ice in the slurry begins to consolidate as it travels upward, and some physical picture of the mechanism is needed to derive the necessary relations. If the zone at which consolidation begins is well below the top of the cone, it is possible that packed ice may back up to the charge pump, and if the zone position fluctuates, it would produce erratic operation of the column. It has actually occurred in experimental plants that the packed ice sometimes does back up to the pump and that excessive pressures are developed. Also, for designing the wash-column charge pump for normal operation, it is necessary to know the thickness of the consolidated ice in order to calculate the pressure drop across it.
One very plausible theory of ice consolidation is this. The dilute slurry deposits ice particles on the underside of the ice column in an ever-increasing thickness. Thus the level of the bottom of the ice column moves downward through the cone. All the brine in the slurry must pass through that part of the consolidated ice which lies below the screen level, and this requires a certain pressure drop to maintain the flow. The pressure drop in turn creates a force on the bottom of the packed ice which, when great enough, will push it upward through the separation column. A dynamic equilibrium (steady state) will eventually l^e reached when the thickness of the ice is great enough to push the ice out at the same rate as it is brought in by the slurry.
IV. Description of Basic Freezing Processes
Turning now to some of the actual systems which are being con
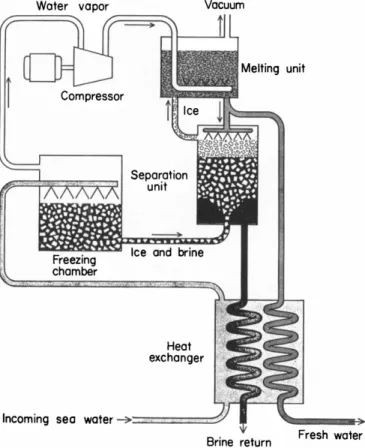
sidered for practical applications, almost all freeze-separation processes have similar functional components. This is primarily due to the fact that all freezing processes utilize similar mechanisms for forming ice and separating it from the brine. To understand this point, we shall first look at the indirect-refrigeration method which, although not the most promising, has all the elements for understanding the fundamentals of the freezing method. A schematic diagram of this system is shown
unit
B r i n e r e t u r n
F I G . 7.6. Indirect-refrigeration method.
in Fig. 7.6. The incoming sea water is first pumped through a heat exchanger, which reduces its temperature, if necessary. It is then admitted to a freezing chamber, which is cooled by means of the refrigeration coils of a separate refrigerating system. The sea water is sufficiently reduced in temperature to a level where ice crystals are formed. The ice and brine slurry then flow to a separation unit, where the ice and brine are separated. The separation unit is discussed in more detail below. The brine is returned to the supply source and the ice is transferred to a melting unit, where the heat originally removed by the refrigerant is used to melt the ice as the refrigerant is condensed.
The melted ice is then taken from the melting unit as product water, part of which is by-passed to the separating unit, where it is used for washing the ice crystals.
The heat-exchange interface between the sea water and refrigerant in the freezing chamber is a distinct disadvantage and, therefore, a method which will permit direct exchange of heat between the sea water and the refrigerant would be highly desirable. This is the direct-refrigeration technique (State of Israel, 1958). One technique for effecting a direct heat exchange is to use the water itself as a refrigerant. By introducing the sea water to be purified into a vacuum chamber, which is maintained at a pressure equal to the vapor pressure of sea water at or below the freezing point, some of the water immediately flashes into vapor. The evaporation of the water removes heat from the sea water equal to the total latent heat of vaporization for the mass of evaporated water.
With proper design this will reduce the sea water to a temperature where nucleation of ice crystals will begin.
Figure 7.7 is a schematic diagram of a direct-refrigeration method
W a t e r v a p o r V a c u u m
F I G . 7.7. Vacuum freeze-vapor compression method.
which uses water as a refrigerant and then mechanically compresses the resulting water vapor. This method is called the vacuum freeze-vapor compression method. As before, in the direct-refrigeration process, the incoming sea water is cooled in a heat exchanger and then sprayed into a freezing chamber which is operated at the correct pressure. The ice and brine slurry is led to the separation unit, where the ice and brine are separated. The ice is then transferred to a melting unit. The water vapors originating in the freezing chamber are compressed in a com- pressor and discharged to the melting unit. The ice crystals and water vapor exchange heat within the melting unit and the ice is melted and the vapors condensed to form the product water. A n auxiliary refrigera- tion coil may be necessary in the melting unit to make up for heat gained. As before, some of the finished product water is bypassed for washing. The system design is simple and requires a minimum of accessory equipment. On the other hand, the compressor design is difficult, owing to large volume requirement.
To avoid the difficulties of compressor design, a direct-refrigeration method can be devised which absorbs the water vapors and then reclaims the vapors from the absorbent. Figure 7.8 is a schematic diagram of a direct-refrigeration method similar to the previous one, except that the produced vapor is absorbed rather than compressed.
As before, sea water is refrigerated in the freezing chamber, and the resulting ice brine is drained off and pumped through the heat exchanger to discharge. The ice removed from the separator is pumped through coils in the melting unit. The water vapor leaving the freezing chamber is absorbed into the concentrated absorbent, which is sprayed over the cooling coils in the melting unit. The absorbent, now cold and dilute, passes through a heat exchanger on its way to the absorbent generator.
Here the water vapor which had been absorbed is driven out of the absorbent by heating and led to the vapor condenser, where it passes over cooling coils and is condensed. T h e condensed vapor is then part of the product water, the remainder of which is made up of melted ice which has been piped from the separating unit through the heat exchanger to discharge. Auxiliary refrigeration is also required. The absorbent which is used is usually lithium bromide.
Another interesting variation of the direct-refrigeration method is the use of direct evaporation and condensation of the refrigerant in contact with the sea water. The refrigerant used in this process must, of course, be insoluble in water. Such a process was originally proposed by Professor Wiegandt at Cornell University. This method uses isobutane as the refrigerant and is schematically illustrated in Fig. 7.9. In the freezing chamber, liquid butane, which has a boiling point near the freezing
F I G . 7.8. Vapor-absorption method.
point of sea water (—0.5°C at atmospheric pressure), is dispersed in the sea water by internal jet sprays. It is immediately vaporized, removing heat from the sea water, which causes the sea water to freeze into an ice-brine slurry. The slurry is led to the separation unit, where the ice is separated and then transferred to the melting unit. The isobutane vapor leaving the freezing chamber goes to a compressor and then to the melting unit. A heat exchange takes place between the vapor and ice resulting in a mixture of water and condensed isobutane. The water and refrigerant are then separated in a separator and the product water is discharged through the heat exchanger. The necessary water for counterwashing is again by-passed from the main line.
Other freezing schemes have been examined, such as zone freezing,
S e p a r a t i o n u n i t
F r e s h w a t e r B r i n e r e t u r n
F I G . 7.9. Butane m e t h o d .
but the three methods of direct-refrigeration outlined here appear to have the greatest potential.
Ice-brine separation is a process common to all freezing processes.
As discussed in Sections II and III, assuming that a slurry of ice and brine has been produced in a process, it is necessary to separate the two as completely as possible to prevent entrapment or carry-over of the brine into the melting chamber. Ice has a specific gravity of 0.92 and brine at —4.5°C has a specific gravity of 1.05. Thus ice floats on brine, which permits a gravity-separation system. A s we have already noted, the ice crystals must also be washed with fresh water to remove any brine carried within the interstices of the crystals. After the ice is
separated from the brine, it can easily be sprayed with fresh water to wash down any potential brine carry-over.
In almost all freezing processes, ice-brine separation is accomplished by countercurrent washing with fresh water in a vertical moving bed called the wash-separation column. (See Fig. 7.10 for a schematic view
Wash water
Liquid level
Annular screen
Harvested ice to melt tank
Slurry in Brine out
F I G . 7.10. Wash-separation column.
of a wash column in operation.) In this column the ice-brine slurry is introduced at the bottom, where much of the brine is removed by filtration. The remaining bed of ice crystals is pushed vertically upward through the column by hydraulic forces and is washed free of any entrapped brine by a continuous countercurrent stream of fresh water applied to the top of the ice pack. The ice is continuously harvested at the top of the column by scrapping and is then admitt
ed to the melting unit. Figure 7.11 shows the wash-separation column of the Colt Industries desalination unit on test at Beloit, Wisconsin.
F I G . 7 . 1 1 . Colt Industries, Inc., vacuum freezing-vapor compression model on test in Beloit, W i s .
V* Detailed Analysis and Description of Direct-Refrigeration Vacuum Freezing-Vapor Compression System
This section presents a detailed description of one of the processes which can be used by the reader as an example to demonstrate the method for examination and evaluation of other freezing plants using different processes. The process discussed here is the vacuum freezing- vapor compression process, and the information given here was furnished through the courtesy of Colt Industries, Inc.
A . PROCESS ARRANGEMENT
To put the phenomena previously discussed to work in a practical desalination system, we refer first to Fig. 7.12. This schematic diagram shows in simplified form the essential parts of the direct-freezing
F I G . 7 . 1 2 . Desalination by vacuum freezing-vapor compression.
process for desalting and shows the paths of the various fluids in the system:
(1) Sea water enters the system after having been filtered to remove entrained solids. This water is at the same temperature as the source, usually 60° to 75°F. Since this is the highest sea-water temperature in the process, the sea water is passed through a deaerator at this point to remove air and other noncondensible gases. These gases, if not removed by deaeration, would make the maintenance of vacuum in the freezing and melting areas difficult and would interfere with direct heat transfer in the melting area.
(2) The warm deaerated sea water is then pumped to heat exchangers for cooling. This heat exchange is between the sea water and the cold product water. The sea water is cooled and the product water is warmed to a temperature only slightly lower than the incoming sea water.
Another heat exchange takes place between the sea water and the cold brine. The sea water is cooled and the waste brine is warmed in the same measure as above.
(3) The cold sea water is next introduced into a freezing vessel, where the pressure is maintained at approximately 3 mm Hg absolute.
Under this pressure condition, the sea water boils and releases vapor.
As the vaporization removes heat from a pool of cold sea water in the freezer, ice crystals are formed in the pool. The residual liquid in the pool is a brine of increased concentration.
(4) The ice crystals and brine are pumped from the freezing vessel and delivered to a brine-separation device, where the cold brine is separated from the ice crystals and crystals are cleaned of residual brine.
A counterwashing column performs the separation and cleaning.
(5) Cold brine is pumped from the counterwasher through the heat exchangers and then discharged to the sea or processed for reclamation of sea-water minerals. Some of the cold brine is recirculated from the counterwasher to the freezer to control the fluidity of the slurry of brine and ice crystals in the freezer.
(6) Clean fresh-water crystals reach the top of the counterwasher and are mechanically scraped off for delivery via a chute into the melter.
T o prevent the entry of air and simplify the delivery of ice to the melter, the counterwasher is maintained at the same pressure as the melter, approximately 5 mm Hg absolute.
(7) In the melter, the fresh-water snow is distributed and brought in contact with water vapor from the freezer, which has been compressed to the 5-mm Hg level. This pure-water vapor is condensed and the fresh-water ice is melted. The product water thus formed is approximate- ly at its freezing point. It is pumped through the heat exchangers, cooling the incoming sea water. From there the product water is delivered to a product tank and is ready to be taken into a distribution system.
(8) T o keep the system in thermal balance it is necessary to com- pensate for the heat entering the system. This heat enters from several sources, i.e., from the power applied to the main compressor, pumping work and heat penetration from the atmosphere. This extra heat shows up as extra water vapor and thus requires extra ice for its condensation;
otherwise the total ice in the system would constantly decrease. A heat-removal system is provided to maintain the thermal balance. In Fig. 7.12 this heat-removal system is shown as a conventional refrigera- tion unit removing heat from the incoming sea-water stream and freezing some ice crystals in this stream.
(9) To keep the freezer and melter free of any accumulation of air or other noncondensible gases, an air-removal system is provided to continually extract air and some water vapor from the melting area.
The water vapor is condensed and added to the fresh water. The air is discharged to atmospheric pressure.
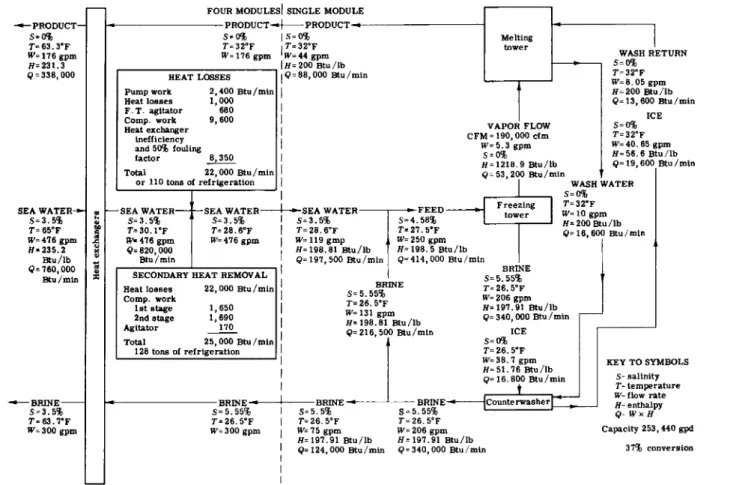
B . F L O W DIAGRAM AND ENERGY BALANCE
T o describe the specific operation of one desalting module, Fig. 7.13 identifies the various fluid streams in the process. The main sea-water
Α. Ε. SNYDER
8
FIG. 7.13. Basic process flow diagram for four-module desalting plant.
inlet is indicated as a flow sufficient for a four-module plant, which in the particular example shown has a total output of 253,440 gal/day, an output of 4 4 gal/min for each of the four modules.
The heat exchangers operate as a battery serving the four modules.
Following the heat exchanger is a heat-removal or refrigeration unit, indicated as a prefreezer. Its purpose is to provide each module with enough extra ice to keep the system in thermal balance. It removes excess heat from the system.
Upon leaving the prefreezer, the sea water is divided into four inlet streams. Each of the four modules receives the cold, deaerated feed supply of sea water at 27.5°F and containing a small percentage of ice crystals.
The component labeled hydroconverter is a unit combining a freezer, vapor compressor, and melter. All four hydroconverters are identical.
Each supplies brine slurry consisting of fresh-water ice crystals and brine to its own counterwasher for brine separation and crystal cleaning.
The cold product water and cold brine are returned from all modules to the heat-exchanger battery, where heat is extracted from the incoming sea water before releasing the product water and brine at essentially ambient temperature.
A similar but more detailed diagram is the mass and energy balance shown in Fig. 7.14. The same flow pattern is followed. It is to be noted that the salinity in this case is indicated to be 3.5 % (35,000 ppm) and the temperature chosen as representative is 65°F. After passing through the heat exchangers, the feed-stream temperature has been reduced to 30.1°F. It then passes through the prefreezer, where further heat is removed and emerges at 28.6°F.
The dashed line in Fig. 7.14 divides the diagram between the data on the left, applying to all four modules, and the data on the right, applying to a single module. This diagrammatic approach is taken because after leaving the prefreezer the main feed stream is divided to feed each module with its own stream. After passing through the four modules, the product and brine streams each recombined to pass through the heat exchangers.
It should be noted that as the feed stream enters the freezing-tower portion of the hydroconverter, it is mixed with cold recirculated brine.
The purpose is to control the fluidity of the slurry mixture leaving the freezing tower and to provide sufficient flow for adequate functioning of the sea-water distribution device before freezing.
Thermal inefficiencies have been shown as heat entering all at the point of secondary heat removal. This is, of course, not literally true, but is sufficiently accurate for the purpose of the mass and energy
Α. Ε. SNYDER
FIG. 7.14. Mass and energy balance diagram for four-module desalting plant.
-•—PRODUCT— -« PRODUCT-*] PRODUCT -« -« 1 S=0% S = 0% |S = 0% Melting
T=63.3°F T=32eF iT=32°F tower '
W=176gpm ^=176 gpm 'w=44 gpm WASH RETURN ff=231.3 IΗ = 200 Btu /lb *" 1 s = 0™ Q = 338,000 I HEAT LOSSES Ι ι Q = 88,000 Btu/min Γ,= ?2!ΐ
1 Τ Vv = 8.05gpm
Pump work 2,400 Btu/min I n H= 200 Btu /lb Heat losses 1,000 Q = 13, 600 Btu /min F.T. agitator 680
Si
9,600 VAPOR FLOW 5=0%taeMiSy CFM=190,000 cfm T=32°F
factor ff=m8.9 Btu/lb <?= 19,600 Btu/min Total 22,000 Btu/min I Q= 53,200 Btu/min t
or 110 tons of refrigeration | I WASH WATER
" ι Freezine T=32°F
SEA WATER-*- oo —SEA WATER SEA WATER 1 —S E A WATER 1 »-FEED »- tnw./ W=10<rDm S=3.5% & S=3.5% " S=3.5% I S=3.5% S=4.58% 1 I H=200Btu/lb T=65°F £ T=30.1°F T=28.6°F | T=28.6°F 7=27.5eF <?= 16 600 Btu/min W= 476 gpm Jc TV=476 gpm W= 476 gpm I W=119gmp ti W= 250 gpm
ff=235.2 χ <?=820,000 H= 198.81 Btu/lb H= 198.5 Btu/lb
Btu/lb " Btu/min I Q= 197, 500 Btu/min Q= 414,000 Btu/min
0=760.000 2> ι 1 1 I BRINE
Btu/min « SECONDARY HEAT REMOVAL S=5.55%
Heat losses 22,000 Btu/min . -2?INE r=26.5°F
Comp. work I T^eS-Sr —206 gpm 1st stage 1,650 £i?iJL tf= 197.91 Btu/lb
2ndstage 1,690 , H= 198.^Btu/lb Q= 340,000 Btu/min p-^
Agitator _Π0_ <?= 216, 500 Btu/min ICE I Total 25,000 Btu/min A S=0%
128 tons of refrigeration I T= 26.5eF
I 38.7 gpm KEY TO SYMBOLS ι H= 51.76 Btu/lb
Q= 16.800 Btu /min S- salinity I ι T- temperature ι ι 1 •—y~* 1 W- flow rate -*»— BRINE BRINE-* 1 BRINE -* 1 BRINE-* |Counterwasher| ^ | H_ pnthalnv
S-3.5% S=5.55% I S=5.5% S = 5.55% ' 1 Q-WxH T=63.7°F T=26.5°F | T=26.5°F T = 26.5°F
W= 300 gpm W= 300 gpm ι W=75gpm W= 206 gpm Capacity 253,440 gpd ff=197.91 Btu/lb H= 197.91 Btu/lb
I Q= 124,000 Btu/min Q = 340,000 Btu/min 37% conversion
balance being discussed. Compressor work for the prefreezer, as well as the prefreezer agitator, is shown in the block entitled "Secondary heat removal" in Fig. 7.14. The prefreezer has a total heat-removal capacity of 25,500 Btu/min. Of this amount, 22,000 Btu/min is required for the system and 3500 Btu/min is the internal loss of the prefreezer itself.
Conventional refrigeration equipment for removal of 25,500 Btu/min
— 1 2 8 tons of refrigeration—is required .for this quarter of a million gallon per day plant.
C. M A J O R COMPONENTS AND SYSTEMS
1. Heat Exchangers
Heat exchangers recover the refrigeration invested in two fluid streams to be discharged. Three identical specially designed heat exchangers are used for the four-module plant serving a as basis for this description. Cold brine is the source of cooling in two of the heat exchangers before it is returned to the sea. Cold product water is used in the third heat exchanger before it is transferred to the product-holding tank.
For maximum efficiency, the heat exchanger is of the counterflow type, and the temperature difference between the fluids entering and leaving each end averages about 1.6°F. This low approach temperature is the key to the high efficiency of the process and an increase of only 0.1 °F in this temperature in the three heat exchangers amounts to an
Sea water in 1 159 gpm at 65°F
Brine out 63.7 °F
Brine / sea water
Heat exchanger
Sea water out 28.4 °F
Brine in 150 gpm at 26,5 eF 2 required
Sea water in — 159 gpm at 6 5 ° F
Product water out 63.3 ° F
Product/sea water
Heat exchanger
Sea water out 33.2 ° F
Product water 176 gpm at 3 2 ° F I required
F I G . 7.15. Heat-exchanger flow diagrams.
increase in the secondary refrigeration load of over 2 tons of refrigeration, since colder product and waste streams are discharged from the plan.
Figures 7.13 and 7.14 show typical flow and temperature conditions for the heat exchangers, and these conditions are summarized in Fig. 7.15.
2. Heat-Removal System
The heat-removal system of the vacuum-freezing desalting process is an auxiliary system which is used to keep the process in equilibrium.
Even with all the pumps and compressors performing at their maximum possible theoretical efficiency, there would be an amount of vapor produced which would be in excess of what could be condensed without supplementary heat removal. This vapor must be removed from the system or condensed, or ice must be added to the system. Since the equipment would not be 100 % efficient, additional work is required to operate the pumps and compressors. This work takes the form of heat input to the system, as does any heat leakage into the system. One of the main sources of heat is the inefficiency caused by the approach
F I G . 7 . 1 6 . Final assembly, plate-type heat exchangers for saline-water service.
temperatures on the system side of the heat exchangers (Fig. 7.16), even though the heat exchanger keeps this approach temperature small. The differences in temperature between the incoming sea water and the outgoing brine and product water must be treated as a heat leakage into the system.
In the process under discussion, the sum of these heat inputs must be removed from the system to maintain thermal balance. The method Colt Industries has chosen to do this is shown in the accompanying sketch of the prefreezer, Fig. 7.17. Basically, this device cools the feed
F I G . 7 . 1 7 . Colt Industries' prefreezer.
water as it comes from the heat exchangers by removing a quantity of vapor with a compressor and condenses the vapor on a coil condenser, which is cooled by mechanical refrigeration. This method has several advantages: