Sensor-based IoT monitoring of Electronics Manufacturing in University Lab Environment
Attila Géczy,
Department of Electronics Technology
Budapest University of Technology and Economics, Faculty of Electrical Engineering and Informatics) Budapest, Hungary
gattila@ett.bme.hu Róbert Gelbmann
Department of Electronics Technology
Budapest University of Technology and Economics, Faculty of Electrical Engineering and Informatics) Budapest, Hungary
Lajos Kuglics
Department of Electronics Technology
Budapest University of Technology and Economics, Faculty of Electrical Engineering and Informatics) Budapest, Hungary
Gábor Harsányi
Department of Electronics Technology
Budapest University of Technology and Economics, Faculty of Electrical Engineering and Informatics) Budapest, Hungary
István Megyeri,
Department of Electronics Technology
Budapest University of Technology and Economics, Faculty of Electrical Engineering and Informatics) Budapest, Hungary
Abstract—We present a sensor-based IoT monitoring of an electronics manufacturing laboratory in a university environment.
The project focuses on the possibilities of retrofitting the current electronics manufacturing equipment (e.g., surface mount technology apparatus) with sensors to gather extensive in-situ information about the critical parameters of the machines and their ambient surroundings. The project is based on two different sensor nodes functioning as fixed and mobile measurement devices around the given points of the laboratory located at our university. The demonstration presents a cost-effective solution of retrofitting machines with IoT-based sensor nodes, enabling new data acquisition functionalities. Also, the demonstration shows an example of a system from where the students can learn about IoT and Industry 4.0 requirements in their educational environment and from remote access. The project also highlights the importance of operational safety and health (OSH) in such workplaces. The paper presents the block diagrams and the functionalities of the sensor nodes. Also, it presents the frontend and backend setup. The user interface layers are also presented, one, which is available through web access, and the other is a proprietary app for clear visualization of the recorded data. The two approaches share the same SQL database, which is stored on the server.
Keywords— IoT, Industry 4.0, electronics manufacturing, SMT, surface mounting, Raspberry Pi, applied sensors I. INTRODUCTION (HEADING 1)
Our department was a pioneer in establishing a modern electronics manufacturing laboratory for educational purposes. This was also a motivating factor in presenting a virtualized version of our laboratory for e-learning [1] back in 2000. The laboratory was moved to a new location recently; now, we prepared an IoT-based smart-device extension for further expanding the education possibilities of our lab, not only for students but also for industrial partners too, to present the local and remote monitoring possibilities of an IoT based system.
The concept was presented in the literature at other universities or teaching institutes as well. In the following part we selected some of the most recent results in the given field, to show the relevancy of our work.
Khriji et al [2] showed a solution for wireless sensor network (WSN) for a smart-lab purpose. The IoT devices are integrated to a centralized system, with a proprietary application programming interface (API), to present an easy to use method to collect and represent the sensor data. The test device results are stored in MySQL database, and the visualization is presented with JSON technology. Pachecho et al. [3] presented the easy use of Arduino, in order to perform adoption of IoT technologies for easy remote learning. The cheap solution is relevant in many economic sectors, such as transportation, energy, agriculture, home automation and the electronics industry as well. Maiti et al. [4] showed that an IoT network can be used for a complex university course, where sensors and lab equipment monitoring is used for smart learning in agricultural application. Lin presented an experimental classroom with intelligent laboratory management system based on the IoT technology. The work presented the sensor and hardware basis, also the application which is running on mobile platform. Lin showed that such methods can improve
the teaching and reduce the burden of management and logistics of a laboratory class [5]. Tokarz et al [6] also showed an IoT network infrastructure for remote learning (or in other words, distant laboratory classes), where the physical hardware and student interaction is enhanced with IoT approach. The method is also connected to the recent SARS-COV-2 outbreak, which needed novel solutions for distant learning. In a most recent paper, Samonte et al. [7] presented a mobile application based IoT smart laboratory, where the environment variables and laboratory settings are used to analyze data or generate visual reports. The biosafety, the air quality, temperature, humidity and power outages are monitored in medical or experimental facilities. The study shows the application of microcontrollers, sensors, and related breakout boards. Safety is also a concern in the paper of Kanál and Kovácsházy [8], where BLE (Bluetooth Low Energy) sensor boards, a BLE-WiFi gateway (formed by a single board card computer) are utilized to investigate parameters for students overall well-being at universities and dormitories. The CO2 level, temperature, humidity, noise, and illumination are highlighted in the given work.
Further examples can also be found in the literature, as the topic is getting more attention, due to the remote learning aspects.
We focused on the idea to present an universal node, which can be used at the laboratory ambiance, and also around given apparatus. Next to the fixed node, we present a mobile node, which can be worn by the user to investigate personal ambiance in the working area, to emphasize the importance of operational safety and health (OSH) too. The nodes are connected to a central card computer (Raspberry Pi), which works as a server in the network. The data can be visualized by a proprietary Android app and from web browser as well.
The concept is focused to be applied in an electronics manufacturing environment at university level. Our work can also help to promote remote education in the IoT mindset, as it was discussed above.
II. EXPERIMENTAL A. Concept of the smart laboratory
The laboratory consists of several rooms as Figure 1 presents. The concept is to install sensor nodes to given locations and to given workers. When the nodes are installed, the map of the laboratory is accessible from online (web or native app), and a fixed, installed tablet (or an arbitrary mobile device) gives local, immediate access to all information, when entering the laboratory.
Figure 1 shows our map with some selected positions of the fixed nodes, and the mobile device at the main entrance.
Fig. 1. Topology of our laboratory highlighting the positioned sensor nodes and the user interface on a mobile device.
B. Nodes used for data acquisition
The data is gathered by a Raspberry Pi 4, which is located in the center of the laboratory, and which is working as a server and a data logging system.
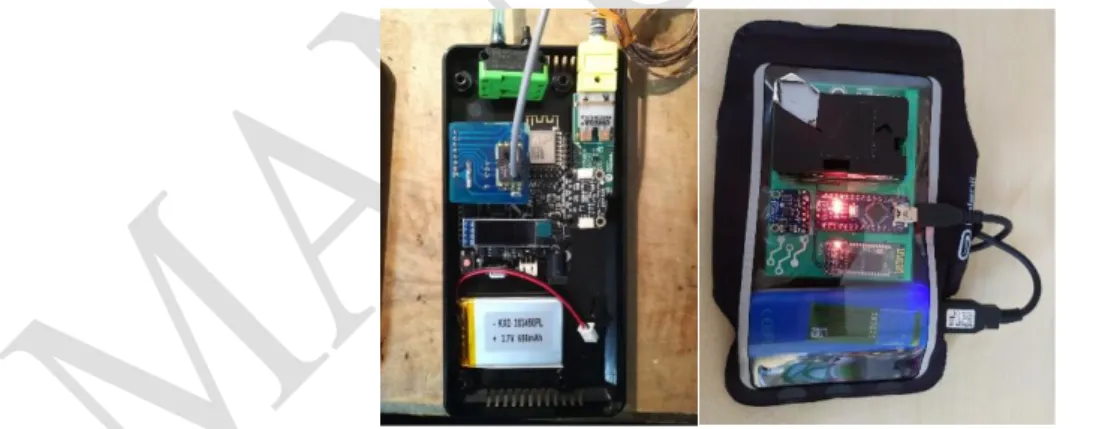
For the fixed node we use a proprietary device based on a Fishino Uno with ESP2866 Wifi, which is in connection with the central server (Raspberry Pi 4). The microcontroller board is in connection with a Sensirion SDP810 pressure sensor (interchangeable) to monitor pressure relations in reflow ovens, particularly vapour phase soldering, which is in focus for characterization studies. A MAX31855 K-type thermocouple amplifier breakout board is also added with an BME 680 sensor cluster with breakout board, to monitor temperature, humidity and ambient pressure relations. Furthermore a micro SD/SD card slot, for local logging, a 3,7 V Li-Po 650 mAh battery with proper DC/DC regulation (5V and 3,3V) for working during short outages, and a 128*64 px OLED screen is added for local information available to the operator. Figure 2 shows the first prototype of the fixed node.
Fig. 2. Fixed node during development stage Figure 3 shows an extended block diagram of the fixed node.
Fig. 3. Fixed node block diagram
For the wearable node, an Arduino Nano is used as the CPU. We used Arduino IDE 1.8.10 for software development. The sensors are the following. A CCS811 (I2C) module was applied, which is used for VOC and eCO2 measurement. Winsen ZPH01 particulate matter sensor was applied with PWM/UART. The Bluetooth module is HC-05. The power is supplied by a 2200 mAh power bank with 5V/1A output. The Bluetooth data is received by the central node (Raspberry Pi). The wearable node is presented in Figure 4.
Fig. 4. Nodes in their more advanced prototype boxed-packaged form. Left: fixed node; Right: wearable node with arm fixture.
The wearable node is described in deeper details in [9]. The data is gathered by a Raspberry Pi 4, which is located in the center of the laboratory, and which is working as a server and a data logging system.
C. Backend and frontend
The backend and the frontend is based on the following setup. There is a Django (Python-based) shell to promote fast visualization. In order to improve visualization, an easy integration from Chart.JS to Django is performed. The responsive design is based on a HTML (CSS+JavaScript) system.
Summing up, the data flow is based on an SQL server, which is in connection with Django, then the flow points to Chart.JS+HTML base. Figure 5 presents the setup visually.
Fig. 5. Database to visualisation
It must be noted that the visualization is continuously improving from the aspect of design, the given results show a snapshot of the work during development.
D. Backend and frontend
The mobile app was developed in Android Studio (Kotlin), where standard libraries were used for http, graphical and other functions. A naviagtion bar is used to list the selectable options:
• laboratory map
• standard XY plot visualization
• progress bar/gauge bar view on the sensors of the nodes
• information about the sensors for educational purposes
• credits of the application.
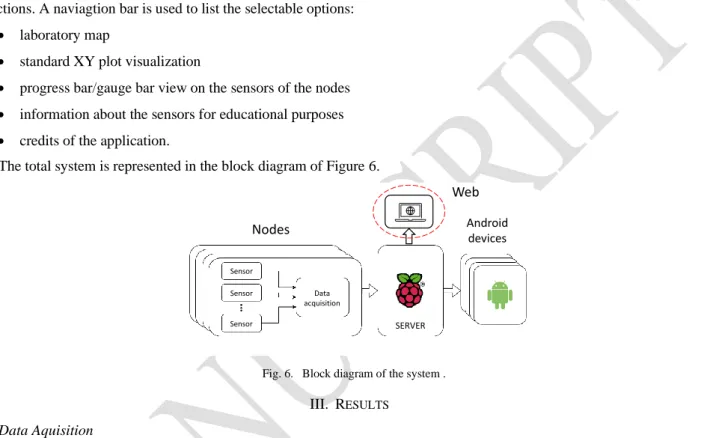
The total system is represented in the block diagram of Figure 6.
Fig. 6. Block diagram of the system .
III. RESULTS A. Data Aquisition
Data acquisition was stable and firm with one fixed node and one wearable node. It must be noted that the size of the database is increasing with every days of worktime. With 1 s data acquisition time step, approximately 50 days of data resulted in 4.3 million SQL lines. The data can be handled by the computer, but it is necessary to backup and restart the database from time to time, in order to avoid congestion.
B. Mobile App
Figure 7 represents the mobile application view. In this view the laboratory map is the starting point, from where the given node can be selected. Then the sensor data can be selected from the data acquisition and the resulting database.
Fig. 7. Mobile app view (left: laboratory map, center and right: exemplary sensor data).
The next figure (Fig. 8) represents the bar chart (progress bar) and throttle/gauge chart visualization of the data.
Sensor Sensor
Sensor
Data acquisition
Nodes
Web
SERVER
Android devices
Fig. 8. Mobile app view with progress bar view (left, center) and gauge bar view (right)
The mobile app is currently working both from Android phones and from emulators on the PC.
C. Website view
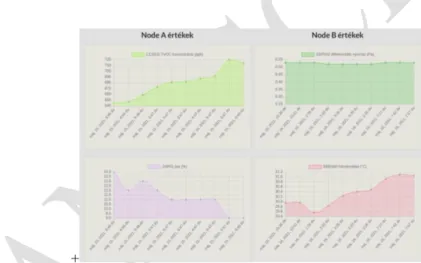
Figure 9 presents a snapshot view on the web visualization. The figure presents timely snapshots over two nodes, where the different sensor values are presented in a time scale.
Node A represents a wearable measurement node in the lab, with two highlighted sensor results: CCS811 TVOC (Total volatile organic compounds) in (ppb) concentration value and ZHP01 particle count on the left. Node B on the right presents the monitoring of a reflow soldering oven with SDP810 differential pressure sensor and the ambiance around the oven with a BOSCH BME680 cluster, where the temperature is measured next to the oven for OSH purposes.
The next Figure 10 presents another overview on the sensors, which are described with pictures and a short note on their working principles. It is important for the students and any visitors to see, what is the role of each node, and what principles are the applied sensors working with.
+
Fig. 9. Recorded data visualization of two nodes (Node A – on the left, with TVOC measurement and particle count in the ambiance; Node B – on the right with differential pressure measured inside a reflow oven and a temperature increase in the ambiance of the oven.)
Fig. 10. Sensor description view on the applied types, breakout boards, parameters, working principles, etc.
IV. CONCLUSIONS Now we can conclude the work with the following statements.
• Communication between the sensors were established within the nodes.
• The nodes are communicating with the central unit.
• The data is saved into a database, which is accessible with both a browser view and the proprietary app.
• Both the app and the web-based viewer is up and running, however the design must be improved to adhere to more modern and professional applications.
For the future, the following tasks are planned. A new modular cluster must be designed for a more efficient wearable device, which can also be optimized for various wearable approaches. Also, localization with Bluetooth technology could be investigated for the wearable devices. The website can be improved for more information and exemplary data recorded previously. Also, the node count should be improved so that all workplaces can be monitored around the lab. The demonstration is planned to be presented in the laboratory during the next semester to the students, where ~300 students are involved in different lab-classes in a revolving stage manner. The sensors may enable better and continuous characterization of our running processes, which data is planned to be utilized in future researches – e.g. the novel characterization of vapour phase soldering with pressure sensors.
ACKNOWLEDGMENT (Heading 5) The help of Bence Szabó and László Gál (UniPCB) is appreciated in the laboratory.
The research reported in this paper and carried out at the BME has been supported by the NRDI Fund based on the charter of bolster issued by the NRDI Office under the auspices of the Ministry for Innovation and Technology.
The vapour phase soldering related research was supported by the National Research, Development and Innovation Office—
NKFIH, FK 132186.
REFERENCES
[1] Gordon Peter; Bojta Peter; Hertel Lorant; Kallai Istvan; Lepsenyi Imre; Varnai Laszlo; Illyefalvi-Vitez Zsolt;Progress in electronics packaging virtual laboratory development, Electronic Components and Technology Conference: Proceedings, Piscataway, USA, IEEE (2000) 1 756 pp. 1293-1299.
[2] S. Khriji, D. El Houssaini, R. Barioul, T. Rehman and O. Kanoun, "Smart-Lab: Design and Implementation of an IoT-based Laboratory Platform," 2020 IEEE 6th World Forum on Internet of Things (WF-IoT), 2020, pp. 1-5, doi: 10.1109/WF-IoT48130.2020.9221143.
[3] A. Fernández-Pacheco, S. Martin and M. Castro, "Implementation of an Arduino Remote Laboratory with Raspberry Pi," 2019 IEEE Global Engineering Education Conference (EDUCON), 2019, pp. 1415-1418, doi: 10.1109/EDUCON.2019.8725030.
[4] A. Maiti, T. Byrne and A. A. Kist, "Teaching Internet of Things in a Collaborative Laboratory Environment," 2019 5th Experiment International Conference (exp.at'19), 2019, pp. 193-198, doi: 10.1109/EXPAT.2019.8876480.
[5] R. Lin, "IoT Experimental Classroom Project under the Mode of Industry-University-Research Collaboration," 2020 5th International Conference on Smart Grid and Electrical Automation (ICSGEA), 2020, pp. 433-436, doi: 10.1109/ICSGEA51094.2020.00099.
[6] Krzysztof Tokarz; Piotr Czekalski; Gabriel Drabik;Jarosław Paduch; Salvatore Distefano; Riccardo Di Pietro; Giovanni Merlino; Carlo Scaffidi; Raivo Sell; Godlove Suila Kuaban, Internet of Things Network Infrastructure for The Educational Purpose, 2020 IEEE Frontiers in Education Conference (FIE) [7] M. J. C. Samonte, F. A. G. Mendoza, R. Pablo and S. M. P. Villa, "Internet-of-Things Based Smart Laboratory Environment Monitoring System," 2021 IEEE 8th International Conference on Industrial Engineering and Applications (ICIEA), 2021, pp. 497-502, doi: 10.1109/ICIEA52957.2021.9436758.
[8] A. K. Kanál and K. Tamás, "Assessment of Indoor Air Quality of Educational Facilities using an IoT Solution for a Healthy Learning Environment,"
2020 IEEE International Instrumentation and Measurement Technology Conference (I2MTC), 2020, pp. 1-6, doi: 10.1109/I2MTC43012.2020.9129231.
[9] A. Géczy, L. Kuglics, L. Jakab and G. Harsányi, "Wearable Smart Prototype for Personal Air Quality Monitoring," 2020 IEEE 26th International Symposium for Design and Technology in Electronic Packaging (SIITME), 2020, pp. 84-88, doi: 10.1109/SIITME50350.2020.9292309.