Sensing System for Intra-Abdominal Pressure Measurement
Teodor Tóth, Monika Michalíková, Jozef Živčák
Technical University of Košice, Faculty of Mechanical Engineering, Department of biomedical engineering and measurement, Letná 9, Košice, 04200 Slovakia teodor.toth@tuke.sk; monika.michalikova@tuke.sk; jozef.zivcak@tuke.sk
Richard Raši
Louis Pasteur University Hospital, Rastislavova 43, Košice, 04 001 Slovakia rasi@unlp.sk
Abstract: The development of technology and information technology offers new possibilities for detecting intra-abdominal pressure (IAP) in critically ill patients.
Presently, non-invasive measuring through the monitoring of pressure in the bladder has begun to be promoted. Studies on monitoring pressure in the urinary tract point to a high level of correlation with pressure in the abdominal cavity. These measures are currently conducted in the majority of workplaces by manual measurement in specified time intervals. In this article the verification of a monitoring system for measuring IAP is described, which is part of a proposed system for automatisation of IAP detection.
Keywords: intra-abdominal pressure; measurement; sensors
1 Reasons for the Origin of IAH
The reasons for the origin of inter-abdominal hypertension can be divided into a number of groups based on the aetiology of origin:
1. post-traumatic – the reason for origin is a traumatic mechanism with subsequent damage to individual organs: massive multi-organ disabling, burning, intra-abdominal or retroperitoneal bleeding (a traumatic rupture of the aorta, bleeding from the spleen), massive contusion of the body (anti- shock trousers), swelling of tissues after a massive intake of fluids during resuscitation, [12]
2. on the basis of disease and disease complications – infection of the abdominal cavity (stercoraceus or biliary peritonitis), a place of abscess, acute pancreatitis, decompensation cirrhosis with ascites, edema and ascites after a massive intake of fluids, hemoperitoneum or hemoretroperitoneum, [12]
3. as a response to therapeutic procedures – peritoneal dialysis, artificial lung ventilation [12]
4. surgical procedures and their complications – laparoscopic surgery with enforced creation of pneumoperitonea, a large stomach operation, diaphragmatic hernia, application of an abdominal belt after an operation, post-operative bleeding, closing of the abdominal wall caused by pulling, oedema after a major operation (oncological operations). Acute post- operative dilation of the stomach; this is possible also after undergoing a gastrofibroscopic examination. [12]
Massive influx of fluids with forced volume therapy works on the abdominal wall in several ways. It leads to dilation of the veins in the area of the abdominal wall, becoming an oedema of the intestinal walls with increased pressure on the venous and lymphatic system with a resultant worsening of drainage. The stagnation of fluids in the intestinal wall endures with the development of tissue hypoxia. A vicous cycle begins; blood gets into the intestinal wall but does not reach the drainage of the venous system; the oedema grows. A decline in kidney function follows. According to recent studies close monitoring of the inflow and outflow of fluids is appropriate. [6, 7, 12]
2 Treatment of ACS
In clinical practice we have been coming across occurrences of ACS for a long time, and history has recorded data in which increased IAP in critically ill patients leads to a growth in morbidity and mortality. [1, 2, 5, 7]
At present the occurrence of ACS is connected with repeated use of an old-new conception of treatment of serious traumatic injuries. In this strategy of treatment algorithm, a multi-stage procedure, described by different authors as Staged Laparotomy (Morris,1993), Planned Reoperation (Hisrhberg,1994), Abbreviated Laparotomy (Brenneman,1994) and Damage Control Laparotomy (Ivatury, 1997), is again fully acceptable. [1, 2, 12]
The essence of this approach is the carrying out of an immediate introductory laparotomy with necessary treatment of the organs and by stopping the life- endangering bleeding. The aim is to anticipate the origin of irreversible coagulopathy, because coagulopathy worsened by hypothermia and acidosis is considered as a primary factor in the timely death of patients after a serious abdominal injury. [12]
3 Verification of Measuring System
The testing device for verifying the pressure sensor consists of two parts (Fig. 3).
In the first a model of the abdomen is made from a 250 ml saline bag (in the place of the bladder). This saline bag is placed in the bottom of a 35L container which allows pressure to be built up to 25 mmHg. Velcro is used to anchor the bag to the bottom of the container. [8, 10]
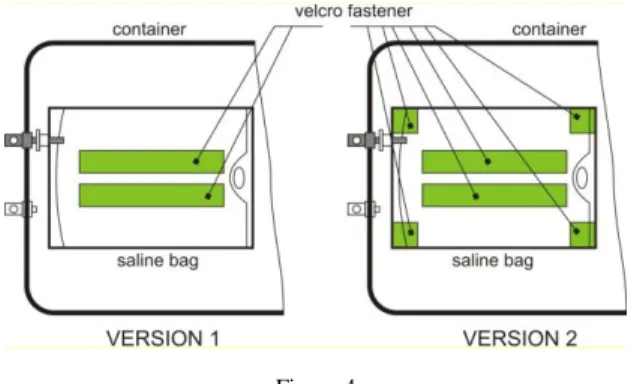
For determining the impact of the anchoring of the model of the bladder two versions of the clamp were tested. In the first version, the bag for the saline was anchored with two Velcro fastener strips along its full length in the middle. Upon testing it was determined that the edges of the bag have a tendency to lift and thus shift the zero point for measurement. To prevent such lifting of the bag edges, Velcro strips were attached to the inside of the container and to the four corners of the bag (Figure 4). [8, 10, 11]
Figure 3
Schematic representation of sensing system [8, 10]
The second part is the sensing system.
The selection of an inter-abdominal pressure sensor is subject to strict hygienic and safety conditions. Among the most basic are that it be possible to disinfect the sensor and that upon its being damaged no contamination of the measuring space can occur. [8, 10, 11]
Figure 4 Versions of the clamp
On the basis of the given criteria the selected sensor was model number DMP 331 P from the company BD SENSORS. The sensor is also supplied in a variant filled with edible oil. The basic parameters of the sensor are presented in Table 2. [8]
The measuring range (0-0.1) bar corresponds to 10 kPa or 75 mmHg, while 3.3 kPa or 25 mmHg is desirable. The sensor, therefore, has sufficient reserve for measuring. The sensor has an output of (0 – 5) V, thus it is possible to connect it directly into the microcontroller. [8]
Table 2
Basic parameter of DMP 331 P sensor [8]
Value
Measuring range [bar] 0 – 0,1
Accuracy 0,5% from measuring range
Output [V] 0-5
Cover IP 65
Material of the sensor body stainless steel
Filling edible oil
The sensing system is connected to a reduction through tubing of 4mm inner diameter [10].
The measurement was performed as follows:
the saline bag was filled with 100 ml of water
5 mmHg pressure was created through the water column, and the value was read from the level gauge,
stabilization of the water level (15 - 20) s,
measuring process (Figure 5),
increasing the pressure up to 25 mmHg stepwise by 5 mmHg per step, measuring after each increment,
decreasing the pressure after reaching 25 mmHg stepwise by 5 mmHg steps, measuring after each decrement,
20 measurement packs were obtained with this approach, and each pack contained 5 levels of measurement (5 – 25 mmHg with 5 mmHg steps) (Figure 5) (Table 3) (Table 4) [9, 10].
Figure 5
Schematic representation of measuring process [9, 10]
Each measurement contains 50 values with 100 ms pause between two values. The pressure sensor has an analog output (0 – 5V), which is processed in a PIC microprocessor. The program in the PIC was designed to read data from the sensor, perform the A/D conversion (10-bit) and then send the data to a PC. [8, 10]
The outcome consists of data in a range from 0 to 1023, which represents the total range of the sensor (0 – 75) mmHg or (0 – 0.1) bar. These are subsequently converted to a pressure value through the relation [8]
mmHg
1023 . 75 _value measured pBD
The surface tension of the water in the container is reduced by adding washing up liquid, which allows for a more exact filling of the container to the desired level.
[8, 10]
Table 3
Table of the recalculated pressure values for version 1 [8, 10]
i Pressure [mmHg]
p(5)i p(10)i p(15)i p(20)i p(25)i 1 5,413 10,326 15,180 20,084 24,889 2 5,368 10,194 15,072 19,870 24,834 3 5,408 10,267 15,154 19,950 24,845 4 5,377 10,232 15,113 19,978 24,821 5 5,411 10,284 15,157 20,001 24,840 6 5,430 10,249 15,114 19,944 24,886 7 5,430 10,273 15,255 19,985 24,817 8 5,403 10,214 15,075 19,911 24,837 9 5,368 10,267 15,075 19,933 24,817 10 5,443 10,236 15,092 19,762 24,824 11 5,422 10,271 15,114 19,982 24,804 12 5,421 10,226 15,041 19,889 24,839 13 5,361 10,227 15,095 19,960 24,786 14 5,371 10,254 15,051 19,905 24,826 15 5,431 10,249 15,063 19,971 24,783 16 5,491 10,309 15,097 19,997 24,905 17 5,504 10,352 15,166 20,006 24,853 18 5,415 10,283 15,107 20,026 24,865 19 5,472 10,279 15,157 20,015 24,837 20 5,443 10,315 15,135 20,006 24,861 Meanp 5,419 10,265 15,116 19,959 24,838 Standard deviation sp 0,040 0,040 0,052 0,069 0,032
sp
p3 5,538 10,384 15,270 20,166 24,934 sp
p3 5,300 10,146 14,961 19,752 24,743
The values from the A/D converter are recalculated to a pressure value (Table 3, Figure 6). Data evaluation was performed in Microsoft Excel 2003. [8, 10]
Figure 6
Trend for 5 mmHg, SD – standard deviation [8, 10]
The dependency of the measured values on the expected values is linear (Fig. 7), with a correlation coefficient from 0.98 to 1. [8, 10]
Figure 7
Dependency of the measured values on the expected values
Differences in the measured values upon comparison of both variants for solving the anchoring of the bag of saline solution are greater than 0.5 mmHg for each range. (Table 4, Table 5)
Table 4
Table of the recalculated pressure values for version 2 [8, 10]
i
Pressure [mmHg]
p(5)i p(10)i p(15)i p(20)i p(25)i
1 4,799 9,713 14,472 19,274 24,258 2 4,799 9,809 14,414 19,403 23,965 3 4,826 9,638 14,367 19,346 23,978 4 4,821 9,701 14,522 19,518 23,993 5 4,771 9,463 14,430 19,304 24,000 6 4,786 9,691 14,589 19,424 23,930 7 4,837 9,521 14,422 19,334 23,936 8 4,805 9,691 14,518 19,397 24,006 9 4,779 9,641 14,434 19,333 24,021 10 4,779 9,645 14,469 19,384 23,877 11 4,757 9,570 14,346 19,264 23,874 12 4,736 9,658 14,431 19,204 23,963 13 4,691 9,567 14,447 19,315 23,930 14 4,716 9,638 14,427 19,367 24,028 15 4,701 9,644 14,458 19,321 24,019 16 4,680 9,560 14,446 19,292 23,977 17 4,685 9,685 14,475 19,296 23,950
18 4,676 9,616 14,378 19,219 23,897 19 4,691 9,543 14,386 19,267 23,908 20 4,692 9,632 14,302 19,368 23,924 Averagep 4,751 9,631 14,437 19,332 23,972 Standard deviation sp 0,055 0,078 0,065 0,074 0,082
sp
p3 4,918 9,865 14,631 19,553 24,218 sp
p3 4,585 9,397 14,242 19,110 23,725
The following table (Table 5), which determines the difference of a nominal (reference) value versus a measured value, serves for determining the better variant.
Table 5
Pressure differences between two variants
i Pressure [mmHg]
p(5)i p(10)i p(15)i p(20)i p(25)i
1 0,6139 0,6134 0,7079 0,8098 0,6309 2 0,5689 0,3846 0,6585 0,4668 0,8692 3 0,5825 0,6292 0,7874 0,604 0,867 4 0,5559 0,5311 0,591 0,4604 0,8283 5 0,6397 0,8207 0,7274 0,6975 0,84 6 0,6441 0,5584 0,5246 0,5202 0,9564 7 0,5928 0,7525 0,8327 0,6507 0,8815 8 0,598 0,5234 0,5574 0,5136 0,8311 9 0,5894 0,6262 0,641 0,6002 0,7965 10 0,6644 0,5908 0,6228 0,3778 0,9472 11 0,6654 0,7006 0,768 0,7181 0,9301 12 0,6849 0,5676 0,6099 0,6852 0,8757 13 0,6704 0,6596 0,6478 0,6448 0,8564 14 0,6555 0,6162 0,6243 0,5384 0,7981 15 0,7301 0,6053 0,6055 0,6499 0,7639 16 0,8106 0,7489 0,6513 0,7052 0,9285 17 0,8192 0,6672 0,6909 0,7098 0,9029 18 0,739 0,6672 0,7287 0,8075 0,9676 19 0,7814 0,7365 0,7714 0,7481 0,9294 20 0,7509 0,683 0,8329 0,638 0,9372 Mean 0,6678 0,6341 0,6790 0,627 0,86689 Standard deviation sp 0,0804 0,0975 0,0881 0,1171 0,0803
The individual values are calculated as follows:
Deviation 1 = Absolute value (nominal value – value of “version 1”).
Total deviation for the selected version = the sum of all deviations for selected version. (Table 6), (Figure 8)
Table 6
Calculation of fifferences between two variants
Nominal Value Version 1 Version 2 Deviation 1 Deviation 2
5 5,419 4,751 0,419 0,249
10 10,265 9,631 0,265 0,369
15 15,116 14,437 0,116 0,563
20 19,959 19,332 0,041 0,669
25 24,838 23,972 0,162 1,028
Total deviation 1,003 2,8779
From the results it is obvious that the total deviation for Variant 2 is nearly 3- times the total deviation for Variant 1. Fom this it follows that anchoring the bag of saline solution using Variant 1 is more suitable.
Figure 8
Values for differences between two variants
3.1 Measurement Error Determination
The total error measurement is given by the error of the sensor and the error of the converter.
The error of the sensor is given by the manufacturer and represents 0.5% of the measuring range, which is, to the extent required, a precision of measuring to a whole number; the sensor also satisfies this condition. [8]
mmHg 375 , 0 resp.
Pa 50 5 , 0 100 .
Pa 10000 _
s 100 .
ge
sensor_ran
ensor error
s
For digitalisation of the pressure from the sensor, an integrated 10-bit converter is used. [8]
The sensitivty of the converter LSB (Least Significant Bit) can be calculated from the relation:
V 00488 , 0 2
V 5 2 10
FSn LSB
where FS (Full Scale) is the range of the converter and n is the number of bits.
A quantization error represents the theoretical maximum difference between the value of the analogue parameter and its maximum value corresponding to the given code word; it is given by the relation:
V 00244 , 2 0
V 00488 , 0
2
LSB QE
The accuracy of the pressure measurement for a measuring a range of 0.1 bar, i.e.
75 tors, can be calculated from the relation:
mmHg 0732 0 mmHg 75 V . 5
V 0,00488 _
s
.ensor range ,
FS
LSB
If a sensor error reaches the maximum allowable value and at the same time a quantization error is also expressed, then there is a total error of measurement:
Pa 66 , 4 5 resp.
mmHg 41 , 0 mmHg 75 V . 5
V 00244 , mmHg 0 375 , 0
_ s .
ensor range
FS QE
s p
s
Because intra-abdominal pressure is measured for an entire unit, this error is below the margin of acceptability. Its value can be lowered by use of a converter with higher resolution capability. The total error of measurement for a 16-bit converter is on the level of the sensor error. [8]
Pa 13 , 0 5 resp.
mmHg 376 , 0 mmHg 75 V . 5
2 V 5 2 1 mmHg 375 , 0
_ s 2 . 2 1
16
ensor range
FS FS
n s p
s
Conclusion
A proposed measuring device for medical applications must satisfy the appropriate conditions for safety and for reliable use. The sterilisation of all parts which come into contact with body fluids (urine) is one of these conditions. This condition has a basic effect during sensor selection.
In the course of testing the system’s sensor two methods of anchoring the bag for saline solution were verified. The methodology for testing was the same in both cases. In view of the principles of the measurement (measuring with a column of water) it was necessary to measure under stable weather conditions, because a change in atmospheric pressure can influence the measured values. The difference between the two methods of anchoring for pressures of 5 – 20 mmHg is approximately 0.65 mmHg and for a range of 25 mmHg it is approximately 0.87 mmHg. Because when measuring internal-abdominal pressure measuring in units of mmHg is sufficient, the measuring of intra-abdominal pressure is within the tolerance limits for both Variants. From an evaluation of the results, it follows that measuring using Variant 1 is more precise.
The total error of the sensing system is on a level of 0.41 mmHg. For decreasing the total error of measurement it is possible to use a stand-alone 16-bit A/D converter. The total error in this case will be equal to the sensor error.
Acknowledgement
This contribution is the result of the project implementation: Center for research of control of technical, environmental and human risks for permanent development of production and products in mechanical engineering (lTMS:26220 120060) supported by the Research & Development Operational Programme fund ed by the ERDF.
References
[1] Malbrain, ML., Cheatham, ML., Kirkpatrick, A., Sugrue, M., Parr, M., De Waele, J., Balogh, Z., Leppäniemi, A., Olvera, C., Ivatury, R., D'Amours, S., Wendon, J., Hillman, K., Johansson, K., Kolkman, K., Wilmer, A.:
Results from the International Conference of Experts on Intra-abdominal Hypertension and Abdominal Compartment Syndrome. I. Definitions, Intensive Care Med. 2006 Nov; 32(11):1722-32. Epub 2006 Sep 12
[2] Malbrain, ML., Cheatham, ML., Kirkpatrick, A., Sugrue, M., Parr, M., De Waele, J., Balogh, Z., Leppäniemi, A., Olvera, C., Ivatury, R., D'Amours, S., Wendon, J., Hillman, K., Wilmer, A.: Results from the International Conference of Experts on Intra-abdominal Hypertension and Abdominal Compartment Syndrome. II. Recommendations. Intensive Care Med. 2007 Jun; 33(6):951-62. Epub 2007 Mar 22
[3] Malbrain, ML., Deeren DH.: Effect of Bladder Volume on Measured Intravesical Pressure: a Prospective Cohort Study, Critical Care 2006, 10:R98, http://ccforum.com/content/10/4/R98
[4] Efstathiou, E., Zaka, M., et al.: "Intra-Abdominal Pressure Monitoring in Septic Patients." Intensive Care Medicine 31, 2005, Supplement 1(131):
S183, Abstract 703
[5] Kinball, EJ.: IAP Measurement: Bladder Techniques, WCACS,, Antwerp, 2007
[6] Malbrain ML, Cheatham ML, Kirkpatrick A, Sugrue M, De Waele J, Ivatury R.: Abdominal Compartment Syndrome: it's Time to Pay Attention!, Intensive Care Medicine, Volume 32, Number 11, November 2006, pp. 1912-1914(3)
[7] Ivatury, R., Cheatham M., Malbrain, M., Sugrue, M.: Abdominal Compartment Syndrome, Landes Biosciences, ISBN 978-1-58706-196-7 [8] Toth, T.: Návrh zariadenia na meranie intra – abdominálneho tlaku,
Doktorandská dizertačná práca, Košice, 2009
[9] Tóth, T., Michalíková, M., Bednarčíková, L., Petrík, M., Živčák, J.:
Verification of Measuring System for Automation Intra – Abdominal Pressure Measurement, In: MEDICON 2010 : 12 Mediterranean Conference on Medical and Biological Engineering and Computing 2010 : May 27-30. 2010, Chalkidiki, Greece. - s.l. : Springer, 2010 P. 513-516. - ISBN 978-3-642-13038-0
[10] Tóth, T., Živčák, J., Liberko, I.: Verification of Measuring System for Intra – Abdominal Pressure Measurement, SAMI 2010, 8th International Symposium on Applied Machine Intelligence and Informatics, January 28- 30, 2010, Herľany, Slovakia, pp. 297-299, ISBN 978-1-4244-6423-4 [11] Tóth, T., Michalíková, M., Tkáčová, M., Živčák, J.: Overenie snímacieho
systému na meranie intra-abdominálneho tlaku, Trendy v biomedicínském inženýrství: 21. - 23.září, 2011, Rožnov pod Radhoštěm. – Ostrava, pp.
134-137, ISBN 978-80-248-2479-6
[12] Liberko, I.: Neinvazívne meranie vnútrobrušného tlaku pri kompartment syndróme brušnej dutiny : doktorandská dizertačná práca Košice, 2010
![Table of the recalculated pressure values for version 1 [8, 10]](https://thumb-eu.123doks.com/thumbv2/9dokorg/1234632.94945/6.748.186.564.157.702/table-recalculated-pressure-values-version.webp)
