A Graphical Tool for Parsing and Inspecting Surgical Robotic Datasets
D´avid El-Saig∗, Ren´ata Nagyn´e Elek ∗ and Tam´as Haidegger∗†
∗Antal Bejczy Center for Intelligent Robotics, University Research, Innovation and Service Center (EKIK) Obuda University, Budapest, Hungary´
†Austrian Center for Medical Innovation and Technology (ACMIT), Wiener Neustadt, Austria Email:{david.elsaig, renata.elek, haidegger}@irob.uni-obuda.hu
Abstract—Skill and practice of surgeons greatly affect the outcome of surgical procedures, thus surgical skill assessment is exceptionally important. In the clinical practice, even today, the standard is peer assessment of the capabilities. In the case of robotic surgery, the observable motion of the laparoscopic tools can hide the expertise level of the operator. JIGSAWS is a database containing kinematic and video data of surgeons training with the da Vinci Surgical System. The JIGSAWS can be an extremely powerful tool in surgical skill assessment research, but due to its data-storage it is not user-friendly. In this paper, we propose a graphical tool for the JIGSAWS, which can ease the usage of this annotated surgical dataset.
Index Terms—surgical robotics, surgical skill assessment, JIG- SAWS, annotated surgical database, surgical data science
I. INTRODUCTION
Surgical robotics in our days is a widely used technique in the field of Minimally Invasive Surgeries due to its ac- curacy, advanced vision system and ergonomics. With the da Vinci Surgical System (Intuitive Surgical Inc., Sunnyvale, CA)—which is currently the most successful surgical robot—
clinicians perform nearly a million interventions annually [1].
While, surgical robotics has advantages for the patient and the surgeon as well, it requires training and extensive skills from the operator.
“Human motion is stochastic in nature” [2], and many believe that skills are hidden in the motion, and somehow it can be determined based on the data analysis of a task execution. This task can be a surgical procedure: knot-tying, suturing, dissection, etc. Nowadays there are no standard objective assessment methods of surgical skills in the clinical practice. This would be crucial for quality assurance reasons, and for direct feedback to the clinician. Peer assessment (when an expert scores the clinician during the procedure based on a known metric) is relatively easy to implement, but it requires a senior clinician during the intervention, and it can be subjective [3]. Automated skill assessment techniques are harder to apply, yet they can provide an objective and universal solution to surgical skill estimation. For automated skill assessment, we have to examine annotated surgical data to construct a theory. Surgical robotics provides an exceptional opportunity to study human motion due to the recordable kinematic and video data.
Robot-Assisted Minimally Invasive Surgery (RAMIS) data collection can be done with different tools. The da Vinci
Research Kit (DVRK) is a hardware and software platform for the da Vinci providing complete read and write access to the robot’s arms [4]. Virtual reality simulators (dVSS, dV-Trainer, RoSS, etc.) can also be platforms for surgical data collection [5]. According to our knowledge, JIGSAWS (JHU–ISI Gesture and Skill Assessment Working Set) is the only publicly available annotated database for RAMIS skill assessment. JIGSAWS contains eight surgeons’ data, who have different levels of expertise and they are rated using a Global Rating Score derived from a modified version of the OSATS system. Kinematic and video data were captured during the execution of three surgical tasks [6] (Fig. 1):
a suturing b knot-tying c needle-passing.
The manual annotations of the surgical gestures and the expertise levels were also determined. However, JIGSAWS database is a unique tool to work with surgical data, but it is not easy to process the information in it due to the complicated metadata storage.
In this paper, we propose a graphical interface tool for parsing and inspecting the JIGSAWS dataset. This software provides a user-friendly environment for processing the JIG- SAWS database. It can separate and save the different types of data, furthermore it visualizes the captured information. It can be downloaded for free from its GitHub page, with detailed instructions on its wiki: https://github.com/DAud-IcI/staej/.
Our aim is to use our tool for examine surgical data, and automated skill assessment method development for RAMIS.
In the near future we plan to extend our tool to handle not just reading out the information, but writing in and visualize DVRK data as well.
Fig. 1. Surgical tasks captured in the JIGSAWS database (a) suturing, b) knot-tying, c) needle-passing) [6]
II. MATERIALS ANDMETHODS
A. Environment
The JIGSAWSproject created a dataset from the recording of eight surgeons performing three common surgical training tasks using the da Vinci Surgical System, five subsequent times each. The collected data is hosted by the Johns Hopkins Uni- versity and it is freely available for academic non-commercial usage. [7]
Da Vinci Research Interface, also known as the dVSS API [8], is the technology that allows continuous streaming of diagnostics from the da Vinci to an external device through an Ethernet interface. It streams kinematic data from the Endoscope Control Manipulator (ECM), the Master Tool Ma- nipulators (MTM) and the Patient-Side Manipulators (PSM) at a constant but configurable rate. Additionally, it reports other user events asynchronously. This was the primary source of raw data for the JIGSAWS dataset.
B. Development tools
Python 3 is a high-level programming language and the environment of choice for this project. It is available for all major operating systems, and it is already frequently used in the field of robotics [9]. This makes the open source contribution more beneficial to the community.
SQLiteis a transactional database engine that is compliant with the SQL standard, but its entire database is a single file designed for single application or for an embedded scope [10]. Thanks to these features, it is ideal for a standalone applications with optional portability. In this project it was implemented using thePeeweePython ORM library. Addition- ally, Peewee supports several other database back-ends [11], so the application can be upgraded to use a common database server with relatively little effort.
GObjectis the fundamental generic type system at the heart of GLib-based applications (including GTK applications). It is a C-based object oriented system that is intentionally easy to map onto other languages. Its distinguishing feature is the signal system and the powerful notification mechanism built around it [12]. This project uses it indirectly through GTK+
and GStreamer, and also directly through its enhanced MVVM style base classGNotifier.
GTK+is the widget toolkit employed in the project. It has a wide platform support including Windows and UNIX-like systems such as Linux and macOS. It is part of the GLib ecosystem so it can harness all the power of GObject and safely cooperate with other libraries, including GStreamer.
GStreameris a pipeline based streaming framework with a modular system and many plug-ins. It is written in C and its elements inherit from GObject. While it’s designed for audio and video it can stream any kind of data [13], although we only use it for DivX video. The rationale for using a more complicated media solution is to prepare the application for possible future features, such as compositing annotations or rendered images on the playback, as multiplexing streams is a regular activity within GStreamer.
gnotier
videoplayer
handler
main model.database
import_zip
enter-staej
matplotlibdrawingarea
livediagram accordion
model.kinematics
Fig. 2. Diagram of the package structure to surgical data processing and presentation
PyGObject is the library which enables Python to com- municate with the aforementioned C libraries using dynamic bindings [14].
Glade is a graphical user interface designer that creates XML files in the GtkBuilder format [15]. It provides a language-independent, declarative way to design the user interface and attach events. The Gtk.Builder class is used to import the file into GTK+.
Matplotlib[16] is a Python library for creating plots, which helps the user in visualizing the large volume of numeric data provided in the JIGSAWS dataset. The specific advantage of matplotlib over other solutions is that its output is designed to be familiar for MATLAB users and this establishes a manner of consistency between the plots visible in our tool and those generated from the exported MAT files.
C. Design
Due to the preferred visual nature of interaction the user interface received specific attention. The layout was created in the Glade Interface Designer and one of the design goals was to present a pleasant look that fits in with the family of modern GTK3 applications. To provide an intuitive and familiar interface we took inspiration from popular multimedia players such as iTunes and Rhythmbox.
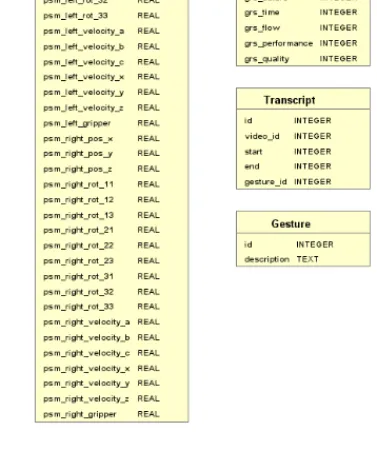
The database model mirrors the structure outlined in JIG- SAWS (Fig 3). Each surgical exercise is listed in the Video table, which contains the file name and the skill ratings. The transcript table contains the manual annotations indicated by their code number and the opening and closing time stamps.
The Gesture table holds the short description of each code used for the annotations. To ease navigation the videos are grouped together by activity type (eg. Suturing) which are identified by IDs in the Task table. Finally, the Kinematic table describes every frame of the recorded videos. It contains a unique key, the video ID and the timestamp as frame number. Additionally it contains four sets of floating point values which describe the state of one of the four manipulators. (in order: left MTM,
Fig. 3. The database model of the JIGSAWS data structure used in our tool. We created a strongly typed model with names and types based on the dataset and the documentation distributed along with it. Kinematics describe the physical state of the dVSS at a point in time, Task lists the surgical tasks from Fig 1., Video provides metadata and rating for a specific surgical trial, Transcript lists each individual annotated surgemes and Gesture contains the known surgeme types.
right MTM, left PSM, right PSM) Each group of Kinematics columns contain the following 19 properties:
1 three spatial coordinates of the tool tip 2 nine items of the tool tip’s rotational matrix
3 three dimensional vector for the tool tip’s linear velocity 4 three dimensional vector for the tool tip’s rotational
velocity
5 one scalar indicating the angular velocity of the gripper The controller classes form an inheritance chain with dif- ferent levels of specificity. GNotifier has the most generic and low-level responsibilities. It acts as an event registrar with the purpose to approximate a ViewModel of the Model- View-ViewModel (MVVM) architectural pattern through the implementation of “one way from source” and “two way”
bindings. It inherits from GObject.Object so it emits the
“notify” event when one of its properties is changed and uses this feature to automatically synchronize properties with respective GTK+ widgets. It has a collection of common widgets that have a default implementation, but it can also be extended by adding custom handlers.VideoPlayerimplements the GStreamer-specific features and facilitates interactions
between GStreamer and GTK+. It provides error handling and a number of commonly useful properties and methods for con- venience.Handlercontains all of the high level features related to the specific implementation of our tool. It also registers the bindings and and handlers provided by its ancestor classes.
We have also developed some new widgets. LiveDiagram uses the Cairo vector graphics library to draw a line chart with content that can be dynamically updated. Matplotlib- DrawingAreais a wrapper for matplotlib in the GTK+ context.
Its descendant TrajectoryPlot is more specific, it implements a plot of 3D space with both single point and segment highlighting.Accordionturns a container widget that contains an alternating series of buttons and containers into a logical unit: a widget where always all but one of the containers are collapsed and clicking any of the buttons selects the container below it.
III. RESULTS
We have successfully implemented an application which imports, exports and visualizes surgical robotic datasets. The program made such data more accessible and it has already aided students with working on the JIGSAWS dataset.
A. Features
Our tool is comprised of two modules, which which share a common back-end:
• enter-staej.py is a command line utility script, which creates the SQLite database from the .zip files in JIG- SAWS. With this approach it is not necessary to create a new set of distribution packages, so there is no need for additional infrastructure. It can be initiated using the python enter-staej.py jigsaws/*.zip command, and it can be turned portable by overriding the value of the “APPDATA” environment variable be- forehand.
• main.pyis the main application, it is a visual front-end where the user can navigate the data imported using enter-staej.py. Once this initialization is done, it can simply be launched using Python:python3 main.py.
A screenshot of the application is visible (Fig. 4) with the explanation of each user interface element below:
1 Video file selector, where the available trials are listed 2 Search bar used to filter by video name
3 Video Info tab shows a selection of general information about the trial as can be seen on the top half of the picture.
4 Gestures tab shows the Gesture Panel and the Stereo State Trajectory.
5 Shows the gesture at the video’s current timestamp.
6 Generic information about the video.
7 Information about the subject (surgeon) and their ratings on this video.
8 The video is played here and can be controlled with the user interface below.
• The play/pause (Ù) button is used to enable or disable playback.
Fig. 4. Screenshots from the application. The upper picture shows the video metadata, the kinematics indicators and the video player. The lower picture demonstrates the gesture playlist and the state trajectory diagram.
• The slow forward/backward (ý, ) buttons skip one frame (301s) and also pause the playback.
• The fast forward/backward (j, k) buttons skip a whole second but have no effect on the playback state.
9 Kinematics Timeline, illustrates the change of selected values in relation over time. It also tracks the current position of playback in the video.
10 Kinematics Timeline parameter selector. The user can pick which values are displayed in the previous diagram using the list of checkboxes in this dropdown.
11 The kinematics box shows the current state of all kine- matic variables at the moment of the currently displayed frame. The visualizations are adjusted to the lowest and highest values within the current video for each individual parameter. This way, we reduce the chance of the changes being imperceptibly small and guarantee that the values are never out of bounds. The side effect of this adjustment is that the values can not be read in absolute relation to each other. The aforementioned Kinematics Timeline fulfills that purpose.
12 Export dialog button.
13 The Gestures Panel is a playlist style interface where the user can jump to the beginning of a specific gesture
Fig. 5. Export dialog with the Export Builder tab visible
within the video. The start and end times are displayed in frames.
14 Stereo State Trajectory, these dual plots display the left and right coordinates of either the MTM or the PSM. It shows the entire path, on it the current position and the segment which corresponds to the current gesture shown on the video. The two diagrams are visually locked together in that if one is rotated the other will follow.
Export dialog has multiple features. One option is to use an SQL query that is directly executed on the tool’s internal database. However, this requires some knowledge of SQL and the specific database structure, which is documented on the repository’s wiki.
A more convenient approach is the Export Builder. Here, the user can select which part of the database to export (the options include everything, the current video, the selected gesture, etc), filter the selection by video name and select from a wide list of columns which can be included in the output. Internally, the selection is compiled into an SQL query which is treated as a user query from above.
An additional panel on the Export dialog lets the user pick the destination format. Here the options are .csv files and Matlab .mat files at the time of writing. Once the data is queried using either of the aforementioned methods a file picker dialog box appears, where a file of the previously selected type can be saved.
B. Practical Applications
Our tool can be helpful in training because it illustrates the delicate hand motions which are performed during an operation. These are normally obscured by the surgeon’s hand. As this information is combined with video illustration, trainees may get a better picture about the motions involved.
The expanding repertoire in the Export Builder aids re- searchers who wish to work with JIGSAWS to quickly retrieve relevant data. Analysis is more convenient and less error prone than parsing the text files or manual query creation.
To demonstrate this application, we used our tool to examine the velocity values in case of the left Patient Side Manipulator during knot-tying. For this, we saved the left PSM x, y and z velocity values from a novice, an intermediate-skilled and
Fig. 6. Histograms of left PSM linear velocity values in case of knot-tying on different expertise levels. We can find the linear velocity histograms in the first line in x, in the second line in y, and in the third line in z direction. We can see the similarity between the shapes of the histograms in case of the different expertise levels, but we can see the differences in the standard deviation, the maximum values, the probability of zero velocity, etc.
an expert surgeon. To study the velocity values, we created histograms from the time-series (Fig. 6). After basic data- preprocessig (such as normalization due to the different time to complete values), the exported data is feasible to compare, furthermore it is a possible input for descriptive statistics and statistical hypothesis testing for surgical skill assessment. With this tool we can examine for example the velocities of the arms, the robot orientations, the trajectories of the movements, the hand shaking, etc. in case of surgeons with different skill levels, but it is also possible to work on surgeme recognition and classification due to the manual surgeme annotations.
IV. CONCLUSION AND FUTURE WORK
In this work, we presented a graphical tool for JIGSAWS, which is a surgical robotic kinematic and video data collection of footages captured during surgical training. This tool can be widely used for Robot-Assisted Minimally Invasive Surgery data analysis. In the future, we would like to validate JIG- SAWS data using our tool and the da Vinci Research Kit.
Once we have established unambiguous correlation between JIGSAWS and DVRK data, we will employ the application to examine human motion in case of robotic surgeries. Our aim is to explore hidden indications in kinematic data for surgical
skill level, to apply our knowledge for automated RAMIS skill assessment.
ACKNOWLEDGMENT
The research was supported by the Hungarian OTKA PD 116121 grant. This work was partially supported by ACMIT (Austrian Center for Medical Innovation and Technology), which is funded within the scope of the COMET (Competence Centers for Excellent Technologies) program of the Austrian Government. T. Haidegger is a Bolyai Fellow of the Hungarian Academy of Sciences. T. Haidegger and R. Nagyn´e Elek are supported through the New National Excellence Program of the Ministry of Human Capacities.
REFERENCES
[1] ´A. Tak´acs, D. ´A. Nagy, I. Rudas, and T. Haidegger, “Origins of Surgical Robotics: From Space to the Operating Room,” Acta Polytechnica Hungarica, vol. 13, pp. 13–30, 2016.
[2] C. E. Reiley and G. D. Hager, “Task versus subtask surgical skill evaluation of robotic minimally invasive surgery,” Med Image Comput Comput Assist Interv, vol. 12, no. 1, pp. 435–442, 2009.
[3] S. K. Jun, M. S. Narayanan, P. Agarwal, A.Eddib, P. Singhal, S. Garimella, V. Krovi, “Robotic Minimally Invasive Surgical skill assessment based on automated video-analysis motion studies,” 4th IEEE RAS EMBS International Conference on Biomedical Robotics and Biomechatronics (BioRob), 2012, pp. 25–31.
[4] P. Kazanzides, Z. Chen, A. Deguet, G. S. Fischer, R. H. Taylor, and S. P. DiMaio, “An open-source research kit for the da Vinci Surgical System,” 2014, pp. 6434–6439.
[5] A. Tanaka, C. Graddy, K. Simpson, M. Perez, M. Truong, and R. Smith,
“Robotic surgery simulation validity and usability comparative analysis,”
Surg Endosc, vol. 30, no. 9, pp. 3720–3729, Sep. 2016.
[6] Y. Gao, S. S. Vedula, C. E. Reiley, N. Ahmidi, B. Varadarajan, H.
C. Lin, L. Tao, L. Zappella, B. B´ejar, D. D. Yuh, C. C. G. Chen, R.
Vidal, S. Khudanpur, and G. D. Hager, “The JHU-ISI Gesture and Skill Assessment Working Set (JIGSAWS) - A Surgical Activity Dataset for Human Motion Modeling”, MICCAI Workshop, 2014.
[7] JIGSAWS: The JHU-ISI Gesture and Skill Assessment Working Set – CIRL, https://cirl.lcsr.jhu.edu/research/hmm/datasets/jigsaws release/
[Accessed: 2018-08-31]
[8] S. P. DiMaio and C. J. Hasser: The da Vinci Research Interface, MIDAS Journal, 2008. jul. (reference URL as requested on website:
http://hdl.handle.net/10380/1464)
[9] R. Fraanje, T. Koreneef, A. Le Mair and S. de Jong, “Python in robotics and mechatronics education” 2016 11th France-Japan and 9th Europe-Asia Congress on Mechatronics (MECATRONICS), 17th International Conference on Research and Education in Mechatronics (REM), Compiegne, 2016, pp. 14-19.
[10] About SQlite, https://www.sqlite.org/about.html [Accessed: 2018-08-21]
[11] Adding a new Database Driver, http://docs.peewee-orm.com/en/latest/
peewee/database.html#adding-a-new-database-driver [Accessed: 2018- 08-21]
[12] Introduction: GObject Reference Manual, https://developer.gnome.org/
gobject/stable/pr01.html [Accessed: 2018-08-21]
[13] Wim Taymans, Steve Baker, Andy Wingo, Ronald S. Bultje, Stefan Kost:
GStreamer Application Development Manual (1.10.1), GStreamer Team, 2016
[14] PyGObject Overview – How does it work? https://pygobject.
readthedocs.io/en/latest/#how-does-it-work [Accessed: 2018-08-21]
[15] What is Glade? https://glade.gnome.org/ [Accessed: 2018-08-21]
[16] Matplotlib: Python Plotting https://matplotlib.org/ [Accessed: 2018-08- 21]
![Fig. 1. Surgical tasks captured in the JIGSAWS database (a) suturing, b) knot-tying, c) needle-passing) [6]](https://thumb-eu.123doks.com/thumbv2/9dokorg/1393219.116008/1.1263.643.1017.1220.1313/surgical-tasks-captured-jigsaws-database-suturing-needle-passing.webp)